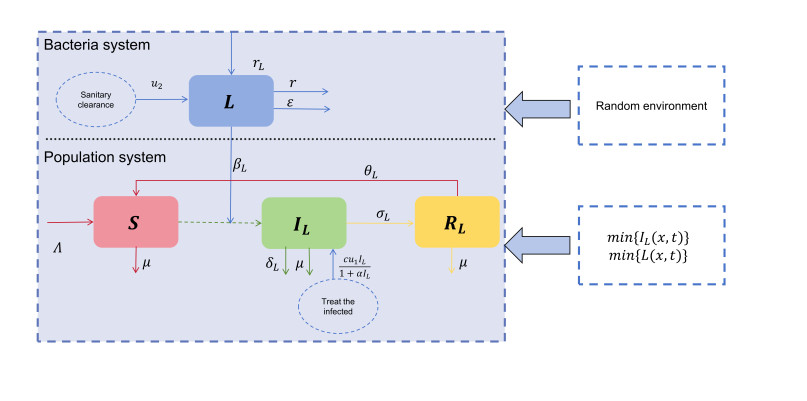
Random environment and human activities have important effects on the survival of listeria. In this paper, treating infected people and removing bacteria from the environment as control strategies, we developed a listeriosis model that considers random noise and spatial diffusion. By constructing a Lyapunov function, we demonstrated the existence and uniqueness of the global positive solution of the model. However, it was a challenging task to realize the optimal control of the model by solving the Pontryagin random maximum principle with the lowest control cost. Therefore, our study on near-optimal controls is of great significance for controlling the spread of listeriosis. Initially, we gave some adjoint equations and a priori estimates. Subsequently, the Pontryagin random maximum principle was utilized to establish the sufficient and necessary conditions for achieving near-optimal controls. Ultimately, the theoretical findings are corroborated through numerical analysis.
Citation: Zhaoyan Meng, Shuting Lyu, Mengqing Zhang, Xining Li, Qimin Zhang. Sufficient and necessary conditions of near-optimal controls for a stochastic listeriosis model with spatial diffusion[J]. Electronic Research Archive, 2024, 32(5): 3059-3091. doi: 10.3934/era.2024140
Random environment and human activities have important effects on the survival of listeria. In this paper, treating infected people and removing bacteria from the environment as control strategies, we developed a listeriosis model that considers random noise and spatial diffusion. By constructing a Lyapunov function, we demonstrated the existence and uniqueness of the global positive solution of the model. However, it was a challenging task to realize the optimal control of the model by solving the Pontryagin random maximum principle with the lowest control cost. Therefore, our study on near-optimal controls is of great significance for controlling the spread of listeriosis. Initially, we gave some adjoint equations and a priori estimates. Subsequently, the Pontryagin random maximum principle was utilized to establish the sufficient and necessary conditions for achieving near-optimal controls. Ultimately, the theoretical findings are corroborated through numerical analysis.

| [1] |
A. Schuchat, B. Swaminathan, C. V. Broome, Epidemiology of human listeriosis, Clin. Microbiol. Rev., 4 (1991), 169–183. https://doi.org/10.1128/cmr.4.2.169 doi: 10.1128/cmr.4.2.169

|
| [2] |
K. Hu, S. Renly, S. Edlund, M. Davis, J. Kaufman, A modeling framework to accelerate food-borne outbreak investigations, Food Control, 59 (2015), 53–58. https://doi.org/10.1016/j.foodcont.2015.05.017 doi: 10.1016/j.foodcont.2015.05.017
|
| [3] |
H. Hof, History and epidemiology of listeriosis, FEMS Immunol. Med. Microbiol., 35 (2003), 199–202. https://doi.org/10.1016/S0928-8244(02)00471-6 doi: 10.1016/S0928-8244(02)00471-6
|
| [4] | C. W. Chukwu, J. Mushanyu, M. L. Juga, A mathematical model for co-dynamics of listeriosis and bacterial meningitis diseases, Commun. Math. Biol. Neurosci., 2020. https://doi.org/10.28919/cmbn/5060 |
| [5] | WHO, World Health Organization Accessed 2019-12-16. Available from: https://www.who.int/news-room/fact-sheets/detail/listeriosis. |
| [6] |
P. J. Witbooi, C. Africa, A. Christoffels, I. H. I. Ahmed, A population model for the 2017/18 listeriosis outbreak in South Africa, PLoS One, 15 (2020), e0229901. https://doi.org/10.1371/journal.pone.0229901 doi: 10.1371/journal.pone.0229901
|
| [7] |
J. K. K. Asamoah, E. Addai, Y. D. Arthur, E. Okyere, A fractional mathematical model for listeriosis infection using two kernels, Decis. Anal. J., 6 (2023), 100191. https://doi.org/10.1016/j.dajour.2023.100191 doi: 10.1016/j.dajour.2023.100191
|
| [8] | C. W. Chukwu, F. Nyabadza, A theoretical model of listeriosis driven by cross contamination of ready-to-eat food products, Int. J. Math. Math. Sci., (2020), 1–14. https://doi.org/10.1155/2020/9207403 |
| [9] | S. Osman, O. D. Makinde, D. M. Theuri, Stability analysis and modelling of listeriosis dynamics in human and animal populations, Global J. Pure Appl. Math., 14 (2018), 115–138. |
| [10] | C. W. Chukwu, F. Nyabadza, Modeling the potential role of media campaigns on the control of listeriosis, preprint, medRxiv: 2020.12.22.20248698. https://doi.org/10.1101/2020.12.22.20248698 |
| [11] |
A. Gray, D. Greenhalgh, L. Hu, X. Mao, J. Pan, A stochastic differential equation SIS epidemic model, SIAM J. Appl. Math., 71 (2011), 876–902. https://doi.org/10.1137/10081856X doi: 10.1137/10081856X
|
| [12] |
F. Zhang, X. Zhang, The threshold of a stochastic avian–human influenza epidemic model with psychological effect, Physica A, 492 (2018), 485–495. https://doi.org/10.1016/j.physa.2017.10.043 doi: 10.1016/j.physa.2017.10.043
|
| [13] |
Q. Liu, D. Jiang, T. Hayat, A. Alsaedi, Dynamics of a stochastic multigroup SIQR epidemic model with standard incidence rates, J. Franklin Inst., 356 (2019), 2960–2993. https://doi.org/10.1016/j.jfranklin.2019.01.038 doi: 10.1016/j.jfranklin.2019.01.038
|
| [14] |
S. Osman, D. Otoo, C. Sebil, Analysis of listeriosis transmission dynamics with optimal control, Appl. Math., 11 (2020), 712–737. https://doi.org/10.4236/am.2020.117048 doi: 10.4236/am.2020.117048
|
| [15] |
C. W. Chukwu, F. Nyabadza, J. K. K. Asamoah, A mathematical model and optimal control for listeriosis disease from ready-to-eat food products, Int. J. Comput. Sci. Math., 17 (2023), 39–49. https://doi.org/10.1504/IJCSM.2023.130421 doi: 10.1504/IJCSM.2023.130421
|
| [16] |
R. Akella, P. R. Kumar, Optimal control of production rate in a failure prone manufacturing system, IEEE Trans. Autom. Control, 31 (1986), 116–126. https://doi.org/10.1109/TAC.1986.1104206 doi: 10.1109/TAC.1986.1104206
|
| [17] |
Q. Gan, R. Xu, P. Yang, Travelling waves of a delayed SIRS epidemic model with spatial diffusion, Nonlinear Anal. Real World Appl., 12 (2011), 52–68. https://doi.org/10.1016/j.nonrwa.2010.05.035 doi: 10.1016/j.nonrwa.2010.05.035
|
| [18] |
S. Jana, S. K. Nandi, T. K. Kar, Complex dynamics of an SIR epidemic model with saturated incidence rate and treatment, Acta Biotheor., 64 (2016), 65–84. https://doi.org/10.1007/s10441-015-9273-9 doi: 10.1007/s10441-015-9273-9
|
| [19] |
X. Zhou, Stochastic near-optimal controls: necessary and sufficient conditions for near-optimality, SIAM J. Control Optim., 36 (1998), 929–947. https://doi.org/10.1137/S0363012996302664 doi: 10.1137/S0363012996302664
|
| [20] | F. H. Clarke, Optimization and Nonsmooth Analysis, Society for Industrial and Applied Mathematics, 1990. |
| [21] | I. Ekeland, On the variational principle, J. Math. Anal. Appl., 47 (1974), 324–353. https://doi.org/10.1016/0022-247X(74)90025-0 |
| [22] |
Y. Wang, Z. Wu, Necessary and sufficient conditions for near-optimality of stochastic delay systems, Int. J. Control, 91 (2018), 1730–1744. https://doi.org/10.1080/00207179.2017.1327725 doi: 10.1080/00207179.2017.1327725
|
| [23] |
M. Hafayed, S. Abbas, On near-optimal mean-field stochastic singular controls: Necessary and sufficient conditions for near-optimality, J. Optim. Theory Appl., 160 (2014), 778–808. https://doi.org/10.1007/s10957-013-0361-1 doi: 10.1007/s10957-013-0361-1
|
| [24] |
X. Zhang, R. Yuan, Sufficient and necessary conditions for stochastic near-optimal controls: A stochastic chemostat model with non-zero cost inhibiting, Appl. Math. Modell., 78 (2020), 601–626. https://doi.org/10.1016/j.apm.2019.10.013 doi: 10.1016/j.apm.2019.10.013
|
| [25] | F. H. Clarke, Nonsmooth analysis and optimization, in Proceedings of the International Congress of Mathematicians, 5 (1983), 847–853. |
| [26] |
D. J. Higham, An algorithmic introduction to numerical simulation of stochastic differential equations, SIAM Rev., 43 (2001), 525–546. https://doi.org/10.1137/S0036144500378302 doi: 10.1137/S0036144500378302
|
| [27] |
R. Buchholz, H. Engel, E. Kammann, F. Tr$\ddot{o}$ltzsch, Erratum to: On the optimal control of the Schl$\ddot{o}$gl-model, Comput. Optim. Appl., 56 (2013), 187–188. https://doi.org/10.1007/s10589-013-9570-7 doi: 10.1007/s10589-013-9570-7
|
| [28] |
W. W. Hager, H. Zhang, Algorithm 851: CG_DESCENT, a conjugate gradient method with guaranteed descent, ACM Trans. Math. Software, 32 (2006), 113–137. https://doi.org/10.1145/1132973.1132979 doi: 10.1145/1132973.1132979
|
| [29] |
C. W. Chukwu, F. Nyabadza, A theoretical model of listeriosis driven by cross contamination of ready-to-eat food products, Int. J. Math. Math. Sci., 2020 (2020), 1–14. https://doi.org/10.1155/2020/9207403 doi: 10.1155/2020/9207403
|
| [30] |
C. W. Chukwu, F. Nyabadza, Mathematical modeling of listeriosis incorporating effects of awareness programs, Math. Models Comput. Simul., 13 (2021), 723–741. https://doi.org/10.1134/S2070048221040116 doi: 10.1134/S2070048221040116
|
| [31] |
G. Zhang, Q. Zhu, Event-triggered optimal control for nonlinear stochastic systems via adaptive dynamic programming, Nonlinear Dyn., 105 (2021), 387–401. https://doi.org/10.1007/s11071-021-06624-8 doi: 10.1007/s11071-021-06624-8
|
| [32] | X. Mao, Stochastic Differential Equations and Applications, Elsevier, 2007. https://doi.org/10.1533/9780857099402 |
Figures(4) / Tables(2)
Zhaoyan Meng, Shuting Lyu, Mengqing Zhang, Xining Li, Qimin Zhang. Sufficient and necessary conditions of near-optimal controls for a stochastic listeriosis model with spatial diffusion[J]. Electronic Research Archive, 2024, 32(5): 3059-3091. doi: 10.3934/era.2024140


 DownLoad: