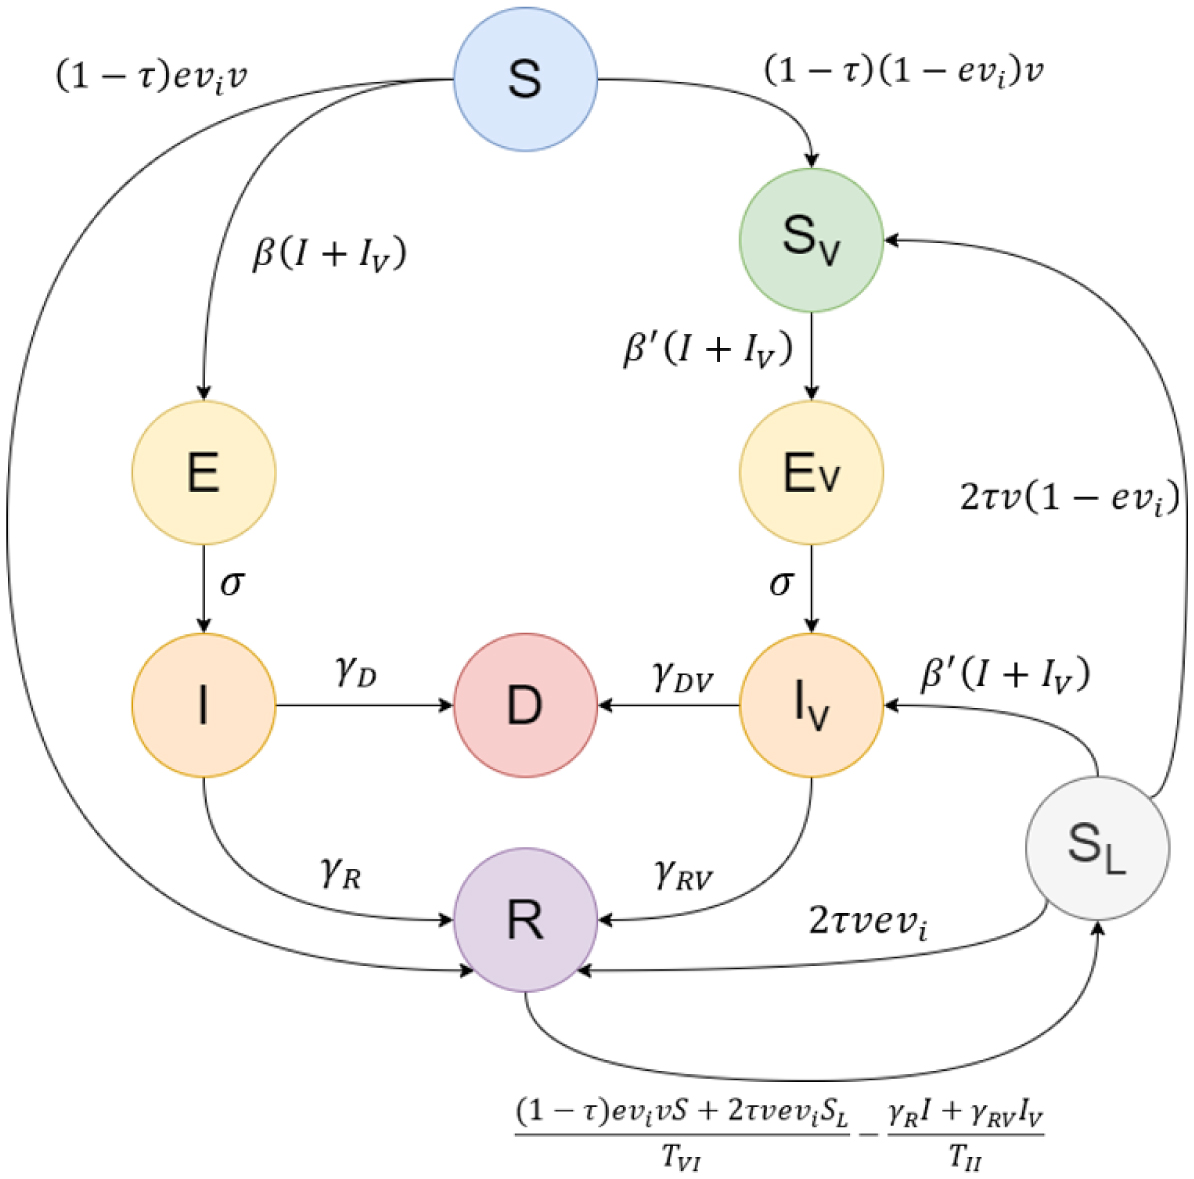
Public health authorities face the issue of optimal vaccine distribution during the spread of pandemics. In this paper, we study the optimal way to distribute a finite supply rate of COVID-19 doses between either the first or second doses for unvaccinated individuals and the third doses (booster shots) for fully vaccinated individuals. We introduce a novel compartmental model that accommodates the vaccinated populations. This Booster model is implemented to simulate two prototypes of populations: one with a highly infected and highly vaccinated proportion, and another with a lowly infected and lowly vaccinated percentage. We namely use sample data from Russia and Djibouti, respectively.
Our findings show that around one quarter of the vaccines should be employed as booster shots and the rest as first and second doses to minimize the deaths for the first type of population. On the other hand, the second type of population can minimize their number of deaths by mainly focusing on administering the initial two doses, rather than giving any booster shots. The novel Booster model allows us to study the effect of the third dose on a community and provides a useful tool to draw public policies on the distribution of vaccines during pandemics.
Citation: Omar El Deeb, Joseph El Khoury Edde. COVID19 vaccines as boosters or first doses: simulating scenarios to minimize infections and deaths[J]. AIMS Biophysics, 2024, 11(2): 239-254. doi: 10.3934/biophy.2024014
Public health authorities face the issue of optimal vaccine distribution during the spread of pandemics. In this paper, we study the optimal way to distribute a finite supply rate of COVID-19 doses between either the first or second doses for unvaccinated individuals and the third doses (booster shots) for fully vaccinated individuals. We introduce a novel compartmental model that accommodates the vaccinated populations. This Booster model is implemented to simulate two prototypes of populations: one with a highly infected and highly vaccinated proportion, and another with a lowly infected and lowly vaccinated percentage. We namely use sample data from Russia and Djibouti, respectively.
Our findings show that around one quarter of the vaccines should be employed as booster shots and the rest as first and second doses to minimize the deaths for the first type of population. On the other hand, the second type of population can minimize their number of deaths by mainly focusing on administering the initial two doses, rather than giving any booster shots. The novel Booster model allows us to study the effect of the third dose on a community and provides a useful tool to draw public policies on the distribution of vaccines during pandemics.

| [1] | Worldometer, COVID-19 Coronavirus Pandemic, 2023. Available from: https://www.worldometers.info/coronavirus/ |
| [2] | CDC, SARS-CoV-2 Variant Classifications and Definitions, Centers for Disease Control and Prevention, 2021. Available from: https://www.cdc.gov/coronavirus/2019-ncov/variants/variant-classifications.html?CDC_AA_refVal=https%3A%2F%2Fwww.cdc.gov%2Fcoronavirus%2F201 9-ncov%2Fvariants%2Fvariant-info.html |
| [3] |
Pulliam JR, Van Schalkwyk C, Govender N, et al. (2022) Increased risk of SARS-CoV-2 reinfection associated with emergence of Omicron in South Africa. Science 376: eabn4947. https://doi.org/10.1126/science.abn4947 
|
| [4] | British Society for Immunology, A Guide to Vaccinations for COVID-19, British Society for Immunology, 2021. Available from: https://www.immunology.org/sites/default/files/BSI_GuidetoVaccinationsCOVID19_Aug21.pdf |
| [5] | Heida R, Hinrichs WLJ, Frijlink HW I Inhaled vaccine delivery in the combat against respiratory viruses: a 2021 overview of recent developments and implications for COVID-19 (2021)21: 957-974. https://doi.org/10.1080/14760584.2021.1903878 |
| [6] |
Self WH (2021) Comparative effectiveness of Moderna, Pfizer-BioNTech, and Janssen (Johnson & Johnson) vaccines in preventing COVID-19 hospitalizations among adults without immunocompromising conditions—United States, March–August 2021. Morbidity and Mortality Weekly Report 70: 1337-1343. 10.15585/mmwr.mm7038e1
|
| [7] | Menachemi N, Dixon BE, Wools-Kaloustian KK, et al. (2021) How many SARS-CoV-2–infected people require hospitalization? Using random sample testing to better inform preparedness efforts. J Public Health Man 27: 246-250. https://doi.org/10.1097/phh.0000000000001331 |
| [8] | Kermack WO, McKendrick AG (1927) A contribution to the mathematical theory of epidemics. Proceedings of the Royal Society A 115: 700-721. https://doi.org/10.1098/rspa.1927.0118 |
| [9] |
Giandhari J, Pillay S, Wilkinson E, et al. (2020) Early transmission of SARS-CoV-2 in South Africa: an epidemiological and phylogenetic report. Int J Infect Dis 103: 234-241. https://doi.org/10.1016/j.ijid.2020.11.128
|
| [10] |
El Deeb O, Jalloul M (2020) The dynamics of COVID-19 spread: evidence from Lebanon. Math Biosci Eng 17: 618-5632. https://doi.org/10.3934/mbe.2020302
|
| [11] |
Kim YJ, Seo MH, Yeom HE (2020) Estimating a breakpoint in the pattern of spread of COVID-19 in South Korea. Int J Infect Dis 97: 360-364. https://doi.org/10.1016/j.ijid.2020.06.055
|
| [12] |
Kharroubi S (2020) Modeling the spread of COVID-19 in Lebanon: a Bayesian perspective. Front Appl Math Stat 6: 40. https://doi.org/10.3389/fams.2020.00040
|
| [13] | El Deeb O, Jalloul M (2020) Forecasting the outbreak of COVID-19 in Lebanon. medRxiv . https://doi.org/10.1101/2020.09.03.20187880 |
| [14] | Hattaf K, Yousfi N (2020) Dynamics of SARS-CoV-2 infection model with two modes of transmission and immune response. Math Sci Eng 17: 5326-5340. https://doi.org/10.3934/mbe.2020288 |
| [15] |
Abou Hassan F, Bou Hamdan M, Ali F, et al. (2023) Response to COVID-19 in Lebanon: update, challenges and lessons learned. Epidemiol Infect 151: 23. https://doi.org/10.1017/S0950268823000067
|
| [16] |
El Deeb O, Jalloul M (2021) Efficacy versus abundancy: comparing vaccination schemes. PLoS One 17: e0267840. https://doi.org/10.1371/journal.pone.0267840
|
| [17] |
Zhou Y, Yang K, Zhou K, et al. (2014) Optimal vaccination policies for an SIR model with limited resources. Acta Biotheor 62: 171-181. https://doi.org/10.1007/s10441-014-9216-x
|
| [18] |
Nguyen C, Carlson J (2016) Optimizing real-time vaccine allocation in a stochastic SIR model. PLoS One 11: e0152950. https://doi.org/10.1371/journal.pone.0152950
|
| [19] |
Colombo R, Garavello M (2019) Optimizing vaccination strategies in an age structured SIR model. Mat Biosci Eng 17: 1074-1089. https://doi.org/10.3934/mbe.2020057
|
| [20] |
Wang X, Wu H, Tang S (2022) Assessing age-specific vaccination strategies and post-vaccination reopening policies for COVID-19 control using SEIR modeling approach. B Math Biol 84: 108. https://doi.org/10.1007/s11538-022-01064-w
|
| [21] | Campos E, Cysne R, Madureira A, et al. (2021) Multi-generational SIR modeling: determination of parameters, epidemiological forecasting and age-dependent vaccination policies. Infect Dis Model 6: 751-765. https://doi.org/10.1016/j.idm.2021.05.003 |
| [22] |
Rao I, Brandeau M (2021) Optimal allocation of limited vaccine to control an infectious disease: Simple analytical conditions. Math Biosci 337: 108621. https://doi.org/10.1016/j.mbs.2021.108621
|
| [23] |
Gavish N, Katriel G (2022) The role of childrens' vaccination for COVID-19—Pareto-optimal allocations of vaccines. PLoS Comput Biol 18: e1009872. https://doi.org/10.1371/journal.pcbi.1009872
|
| [24] |
Collier AY, Yu J, McMahan K, et al. (2021) Differential kinetics of immune responses elicited by Covid-19 vaccines. New Engl J Med 385: 2010-2012. https://doi.org/10.1056/nejmc2115596
|
| [25] | The ConnexionFrance to give third Covid vaccine dose to those with immunodeficiency (2021). https://www.connexionfrance.com/article/French-news/France-to-give-third-Covid-vaccine-dose-to-those-with-immunodeficiency |
| [26] |
Krause PR, Fleming TR, Peto R, et al. (2021) Considerations in boosting COVID-19 vaccine immune responses. The Lancet 398: 1377-1380. https://doi.org/10.1016/S0140-6736(21)02046-8
|
| [27] |
Theparod T, Kreabkhontho P, Teparos W (2023) Booster dose vaccination and dynamics of COVID-19 pandemic in the fifth wave: an efficient and simple mathematical model for disease progression. Vaccines 11: 589. https://doi.org/10.3390/vaccines11030589
|
| [28] | Center for Disease Control and Prevention (CDC), Interim Guidance on Ending Isolation and Precautions for Adults with COVID-19, 2021. Available from: https://www.cdc.gov/coronavirus/2019-ncov/hcp/duration-isolation.html |
| [29] |
Lacobucci G (2021) Covid-19: Single dose of Pfizer and Oxford vaccines cuts risk of hospital admission by 80% in over 80s, data suggest. BMJ 372: n612. https://doi.org/10.1136/bmj.n612
|
| [30] |
Bernal JL, Andrews N, Gower C, et al. (2021) Effectiveness of the Pfizer-BioNTech and Oxford-AstraZeneca vaccines on covid-19 related symptoms, hospital admissions, and mortality in older adults in England: test negative case-control study. BMJ 373: n1088. https://doi.org/10.1136/bmj.n1088
|
| [31] |
Moghadas SM, Vilches TN, Zhang K, et al. (2021) The impact of vaccination on Coronavirus disease 2019 (COVID-19) outbreaks in the United States. Clin Infect Dis 12: 2257-2264. https://doi.org/10.1093/cid/ciab079
|
| [32] | Mathieu E, Coronavirus (COVID-19) Vaccinations, Our World in Data, 2000. Available from: https://ourworldindata.org/covid-vaccinations |
| [33] |
Tomchin DA, Fradkov AL (2020) Prediction of the COVID-19 spread in Russia based on SIR and SEIR models of epidemics. IFAC-PapersOnLine 53: 833-838. https://doi.org/10.1016/j.ifacol.2021.04.209
|
| [34] |
Kudryashov N, Chmykhov M, Vigdorowitsch M (2021) Analytical features of the SIR model and their applications to COVID-19. Appl Math Model 90: 466-473. https://doi.org/10.1016/j.apm.2020.08.057
|
| [35] |
Sharov K (2020) Creating and applying SIR modified compartmental model for calculation of COVID-19 lockdown efficiency. Chaos, Solitons Fractals 141: 110295. https://doi.org/10.1016/j.chaos.2020.110295
|
| [36] | Takele R (2020) Stochastic modelling for predicting COVID-19 prevalence in East Africa Countries. Infect Dis Model 5: 598-607. https://doi.org/10.1016/j.idm.2020.08.005 |


Figures(7) / Tables(1)

Omar El Deeb, Joseph El Khoury Edde. COVID19 vaccines as boosters or first doses: simulating scenarios to minimize infections and deaths[J]. AIMS Biophysics, 2024, 11(2): 239-254. doi: 10.3934/biophy.2024014


 DownLoad: