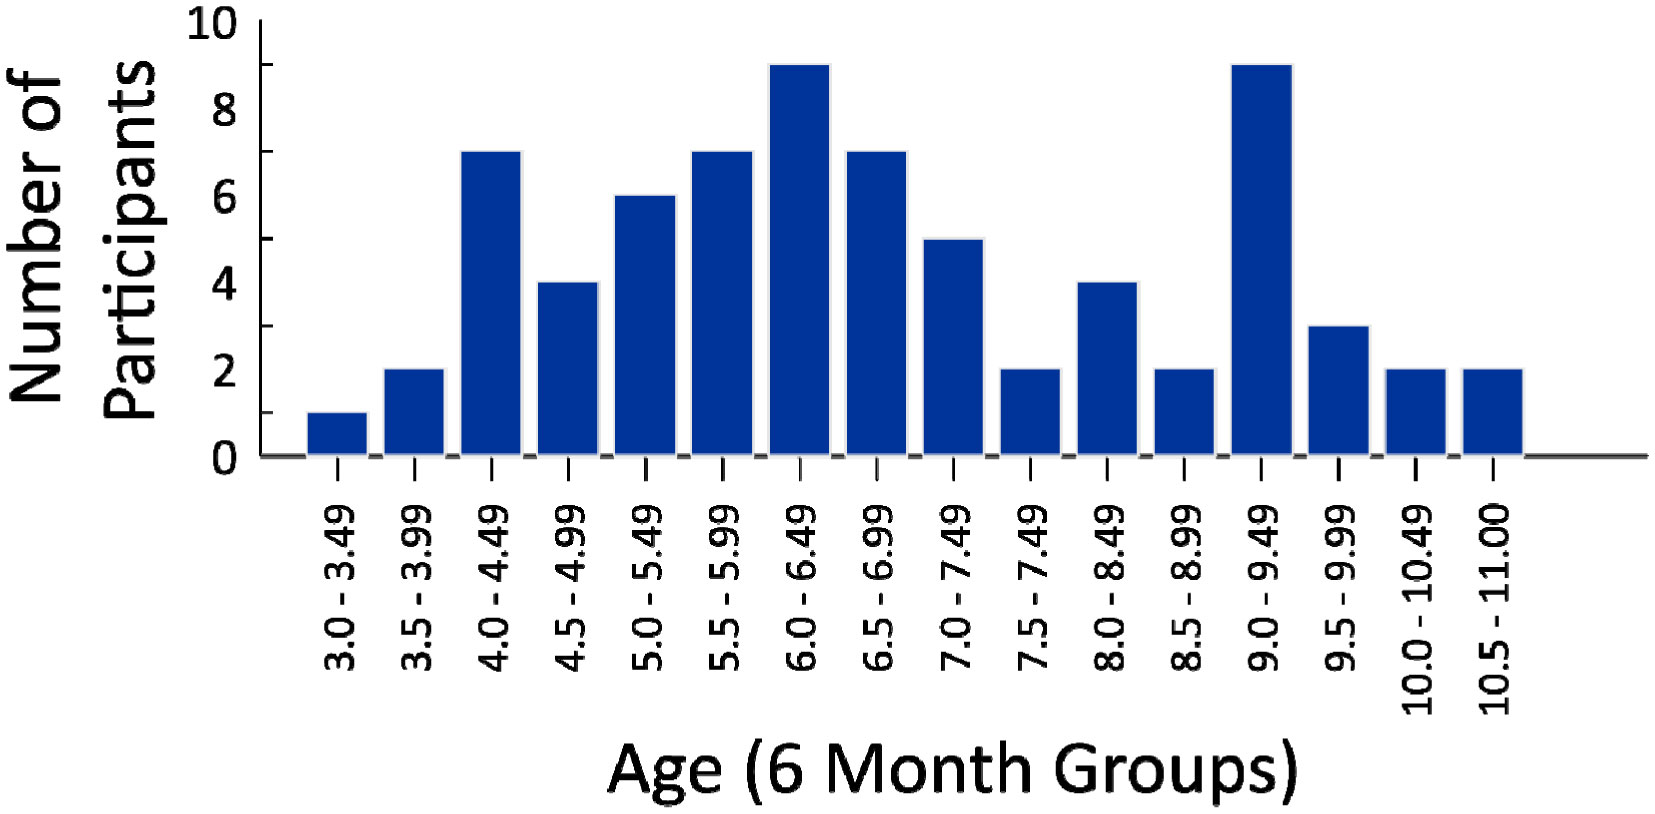
This study investigated the relation between sports participation, body size, and postural control in children between 3 and 11 years of age. To explore this question, children's body sway was measured across multisensory conditions manipulating visual input (the presence versus absence of visual information) and proprioceptive input (varying stance widths), with postural sway in these conditions then related to reports of children's sports participation, and anthropometric measures. Corroborating well-known findings, postural sway was systematically influenced by multisensory factors, with the removal of visual information and narrower stance widths decreasing postural stability. Of more novelty, postural sway in the most stable stance, but without vision, was significantly predicted by measures of sports participation and body size variables, with these factors contributing independently to this prediction. Moreover, the impact on postural sway of having visual input, relative to removing visual input in unstable stances, was significantly predicted by sports participation in activities stressing changing stances and bases of support (e.g., dance, martial arts). Generally, these findings support multisensory and dynamic systems theories of perceptual-motor behavior, and also support sports specificity effects in assessments of the relation between posture and sports.
Citation: Piali Bhati, Theodore C. K. Cheung, Gobika Sithamparanathan, Mark A. Schmuckler. Striking a balance in sports: the interrelation between children's sports experience, body size, and posture[J]. AIMS Neuroscience, 2022, 9(2): 288-302. doi: 10.3934/Neuroscience.2022016
This study investigated the relation between sports participation, body size, and postural control in children between 3 and 11 years of age. To explore this question, children's body sway was measured across multisensory conditions manipulating visual input (the presence versus absence of visual information) and proprioceptive input (varying stance widths), with postural sway in these conditions then related to reports of children's sports participation, and anthropometric measures. Corroborating well-known findings, postural sway was systematically influenced by multisensory factors, with the removal of visual information and narrower stance widths decreasing postural stability. Of more novelty, postural sway in the most stable stance, but without vision, was significantly predicted by measures of sports participation and body size variables, with these factors contributing independently to this prediction. Moreover, the impact on postural sway of having visual input, relative to removing visual input in unstable stances, was significantly predicted by sports participation in activities stressing changing stances and bases of support (e.g., dance, martial arts). Generally, these findings support multisensory and dynamic systems theories of perceptual-motor behavior, and also support sports specificity effects in assessments of the relation between posture and sports.

| [1] |
Nashner LM (1976) Adapting reflexes controlling the human posture. Exp Brain Res 26: 59-72. https://doi.org/10.1007/BF00235249 
|
| [2] | Horak FB, Macpherson JM (1996) Postural orientation and equilibrium. Handbook of physiology: A critical, comprehensive presentation of physiological knowledge and concepts . New York: Oxford University Press pp. 255-292. https://doi.org/10.1002/cphy.cp120107 |
| [3] |
Winter DA, Prince F, Patla AE (1997) Validity of the inverted pendulum model of balance in quiet stance. Gait Posture 5: 153-154. https://doi.org/10.1016/S0966-6362(97)83376-0
|
| [4] |
Ivanenko YP, Gurfinkel VS (2018) Human postural control. Front Neurosci 12. https://doi.org/10.3389/fnins.2018.00171
|
| [5] |
Massion J (1994) Postural control system. Curr Opin Neurobiol 4: 877-887. https://doi.org/10.1016/0959-4388(94)90137-6
|
| [6] |
Massion J (1998) Postural control systems in developmental perspective. Neurosci Biobehav R 22: 465-472. https://doi.org/10.1016/S0149-7634(97)00031-6
|
| [7] |
Shumway-Cooke A, Woollacott MJ (1985) The growth of postural stability: Postural control from a developmental perspective. J Motor Behav 17: 131-147. https://doi.org/10.1080/00222895.1985.10735341
|
| [8] |
Riach CL, Hayes KC (1987) Maturation of postural sway in young children. Dev Med Child Neurol 29: 650-658. https://doi.org/10.1111/j.1469-8749.1987.tb08507.x
|
| [9] |
Schmuckler MA (1997) Children's postural sway in response to low and high frequency information for oscillation. J Exp Psychol Human 23: 528-545. https://doi.org/10.1037/0096-1523.23.2.528
|
| [10] |
Schmuckler MA, Tang A (2019) Multisensory factors in postural control: Varieties of visual and haptic effects. Gait Posture 71: 87-91. https://doi.org/10.1016/j.gaitpost.2019.04.018
|
| [11] |
Barela JA, Jeka JJ, Clark JE (2003) Postural control in children. Exp Brain Res 150: 434-442. https://doi.org/10.1007/s00221-003-1441-5
|
| [12] | Thelen E, Smith LB (1994) A dynamic systems approach to the development of cognition and action. Cambridge, MA: MIT Press. |
| [13] |
Perone S, Simmering VR (2017) Applications of dynamic systems theory to cognition and development: New Frontiers. Adv Child Dev Behav 52: 43-80. https://doi.org/10.1016/bs.acdb.2016.10.002
|
| [14] | Thelen E (1989) Self-organization in developmental processes: Can systems approaches work?. Systems and development: The Minnesota symposia on child psychology . Hillsdale, NJ: Lawrence Erlbaum Assoc pp. 77-117. |
| [15] |
Spencer JP, Vereijken B, Diedrich FJ, et al. (2000) Posture and the emergence of manual skill. Developmental Sci 3. https://doi.org/10.1111/1467-7687.00115
|
| [16] |
Clearfield MW, Dineva E, Smith LB, et al. (2009) Cue salience and infant perseverative reaching: Tests of the dynamic field theory. Developmental Sci 12: 26-40. https://doi.org/10.1111/j.1467-7687.2008.00769.x
|
| [17] | Fogel A (2006) Dynamic systems research on interindividual communication: The transformation of meaning making. Journal of Developmental Processes 1: 7-30. |
| [18] |
Fitzgerald D, Trakarnratanakul N, Smyth B, et al. (2010) Effects of a wobble board-based therapeutic exergaming system for balance training on dynamic postural stability and intrinsic motivation levels. J Orthop Sport Phys 40: 11-23. https://doi.org/10.2519/jospt.2010.3121
|
| [19] |
Blakemore S-J, Frith C (2005) The role of motor contagion in the prediction of action. Neuropsychologia 43: 260-267. https://doi.org/10.1016/j.neuropsychologia.2004.11.012
|
| [20] |
Zemková E (2014) Sport-specific balance. Sports Med 44: 579-590. https://doi.org/10.1007/s40279-013-0130-1
|
| [21] |
Hyryosomallis C (2011) Balance ability and athletic performance. Sports Med 41: 221-232. https://doi.org/10.2165/11538560-000000000-00000
|
| [22] |
Glazier PS (2017) Towards a grand unified theory of sports performance. Hum Movement Sci 56: 139-156. https://doi.org/10.1016/j.humov.2015.08.001
|
| [23] |
Kiers H, van Dieën J, Dekkers H, et al. (2013) A systematic review of the relationship between physical activities in sports or daily life and postural sway in upright stance. Sports Med 43: 1171-1189. https://doi.org/10.1007/s40279-013-0082-5
|
| [24] | Opala-Berdzik A, Głowacka M, Wilusz K, et al. (2018) Quiet standing postural sway of 10- to 13-year-old national-level, female acrobatic gymnasts. Acta Bioeng Biomech 20: 117-123. |
| [25] |
Liang Y, Hiley M, Kanosue K (2019) The effect of contact sport expertise on postural control. PLoS ONE 142: e0212334. https://doi.org/10.1371/journal.pone.0212334
|
| [26] |
Golomer E, Crémieux J, Dupui P, et al. (1999) Visual contribution to self-induced body sway frequencies and visual perception of male professional dancers. Neurosci Lett 267: 189-192. https://doi.org/10.1016/S0304-3940(99)00356-0
|
| [27] |
Perrin P, Deviterne D, Hugel F, et al. (2002) Judo, better than dance, develops sensorimotor adaptabilities involved in balance control. Gait Posture 15: 187-194. https://doi.org/10.1016/S0966-6362(01)00149-7
|
| [28] |
Paillard T, Noé F (2006) Effect of expertise and visual contribution on postural control in soccer. Scand J Med Sci Spor 16: 345-348. https://doi.org/10.1111/j.1600-0838.2005.00502.x
|
| [29] |
Tsang WW, Wong VS, Fu SN, et al. (2004) Tai Chi improves standing balance control under reduced or conflicting sensory conditions. Arch Phys Med Rehab 85: 129-137. https://doi.org/10.1016/j.apmr.2003.02.002
|
| [30] |
Sahli S, Ghroubi S, Rebai H, et al. (2013) The effect of circus activity training on postural control of 5-6-year-old children. Sci Sport 28: 11-16. https://doi.org/10.1016/j.scispo.2011.10.010
|
| [31] |
Kiomourtzoglou E, Derri V, Mertzanidou O, et al. (1997) Experience with perceptual andmotor skills in rhythmic gymnastics. Percept Motor Skill 84: 1363-1372. https://doi.org/10.2466/pms.1997.84.3c.1363
|
| [32] |
Cheung TCK, Schmuckler MA (2021) Multisensory postural control in adults: Variation in visual, proprioceptive, and somatosensory inputs. Hum Movement Sci 79: 102845. https://doi.org/10.1016/j.humov.2021.102845
|
| [33] |
Han J, Waddington G, Adams R, et al. (2016) Assessing proprioception: A critical review of methods. J Sport Health Sci 5: 80-90. https://doi.org/10.1016/j.jshs.2014.10.004
|
| [34] | Taylor JL (2010) Proprioception. Encyclopedia Neurosci : 1143-1149. https://doi.org/10.1016/B978-008045046-9.01907-0 |
| [35] |
Goulding A, Jones IE, Taylor RW, et al. (2003) Dynamic and static tests of balance and postural sway in boys: Effects of previous write bone fractures and high adiposity. Gait Posture 17: 136-141. https://doi.org/10.1016/S0966-6362(02)00161-3
|
| [36] |
Schmuckler MA (2017) Postural response to predictable and non-predictable visual flow in children and adults. J Exp Child Psychol 163: 32-52. https://doi.org/10.1016/j.jecp.2017.06.005
|
| [37] | Cheung TCK, Schmuckler MA Multisensory influences in children's balance: The role of visual, haptic, and proprioceptive information ((in preparation)). |
| [38] |
Raymakers JA, Samson MM, Verhaar HJJ (2005) The assessment of body sway and the choice of the stability parameter(s). Gait Posture 21: 48-58. https://doi.org/10.1016/j.gaitpost.2003.11.006
|
| [39] | Benjamini Y, Hochberg Y (1995) Controlling the false discovery rate: A practical and powerful approach to multiple testing. J R Stat Soc B : 289-300. https://doi.org/10.1111/j.2517-6161.1995.tb02031.x |
| [40] |
Carver S, Kiemel T, Jeka JJ (2006) Modeling the dynamics of sensory reweighting. Biol Cybern 95: 123-134. https://doi.org/10.1007/s00422-006-0069-5
|
| [41] |
Assländer L, Peterka RJ (2016) Sensory reweighting dynamics following removal and addition of visual and proprioceptive cues. J Neurophysiol 116: 272-285. https://doi.org/10.1152/jn.01145.2015
|
| [42] |
Demura S, Kitabayashi T, Uchiyama M (2006) Body sway characteristics during static upright poture in young children. Sport Sci Health 1: 158-161. https://doi.org/10.1007/s11332-006-0028-5
|
| [43] |
Sá CSC, Coffino CC, Ramos RT, et al. (2018) Development of postural control and maturation of sensory system in children of different ages: A cross sectional study. Braz J Phys Ther 22: 70-76. https://doi.org/10.1016/j.bjpt.2017.10.006
|
| [44] |
Schmuckler MA, Gibson EJ (1989) The effect of imposed optical flow on guided locomotion in young walkers. Brit J Dev Psychol 7: 193-206. https://doi.org/10.1111/j.2044-835X.1989.tb00800.x
|


Figures(3) / Tables(2)

Piali Bhati, Theodore C. K. Cheung, Gobika Sithamparanathan, Mark A. Schmuckler. Striking a balance in sports: the interrelation between children's sports experience, body size, and posture[J]. AIMS Neuroscience, 2022, 9(2): 288-302. doi: 10.3934/Neuroscience.2022016


 DownLoad: