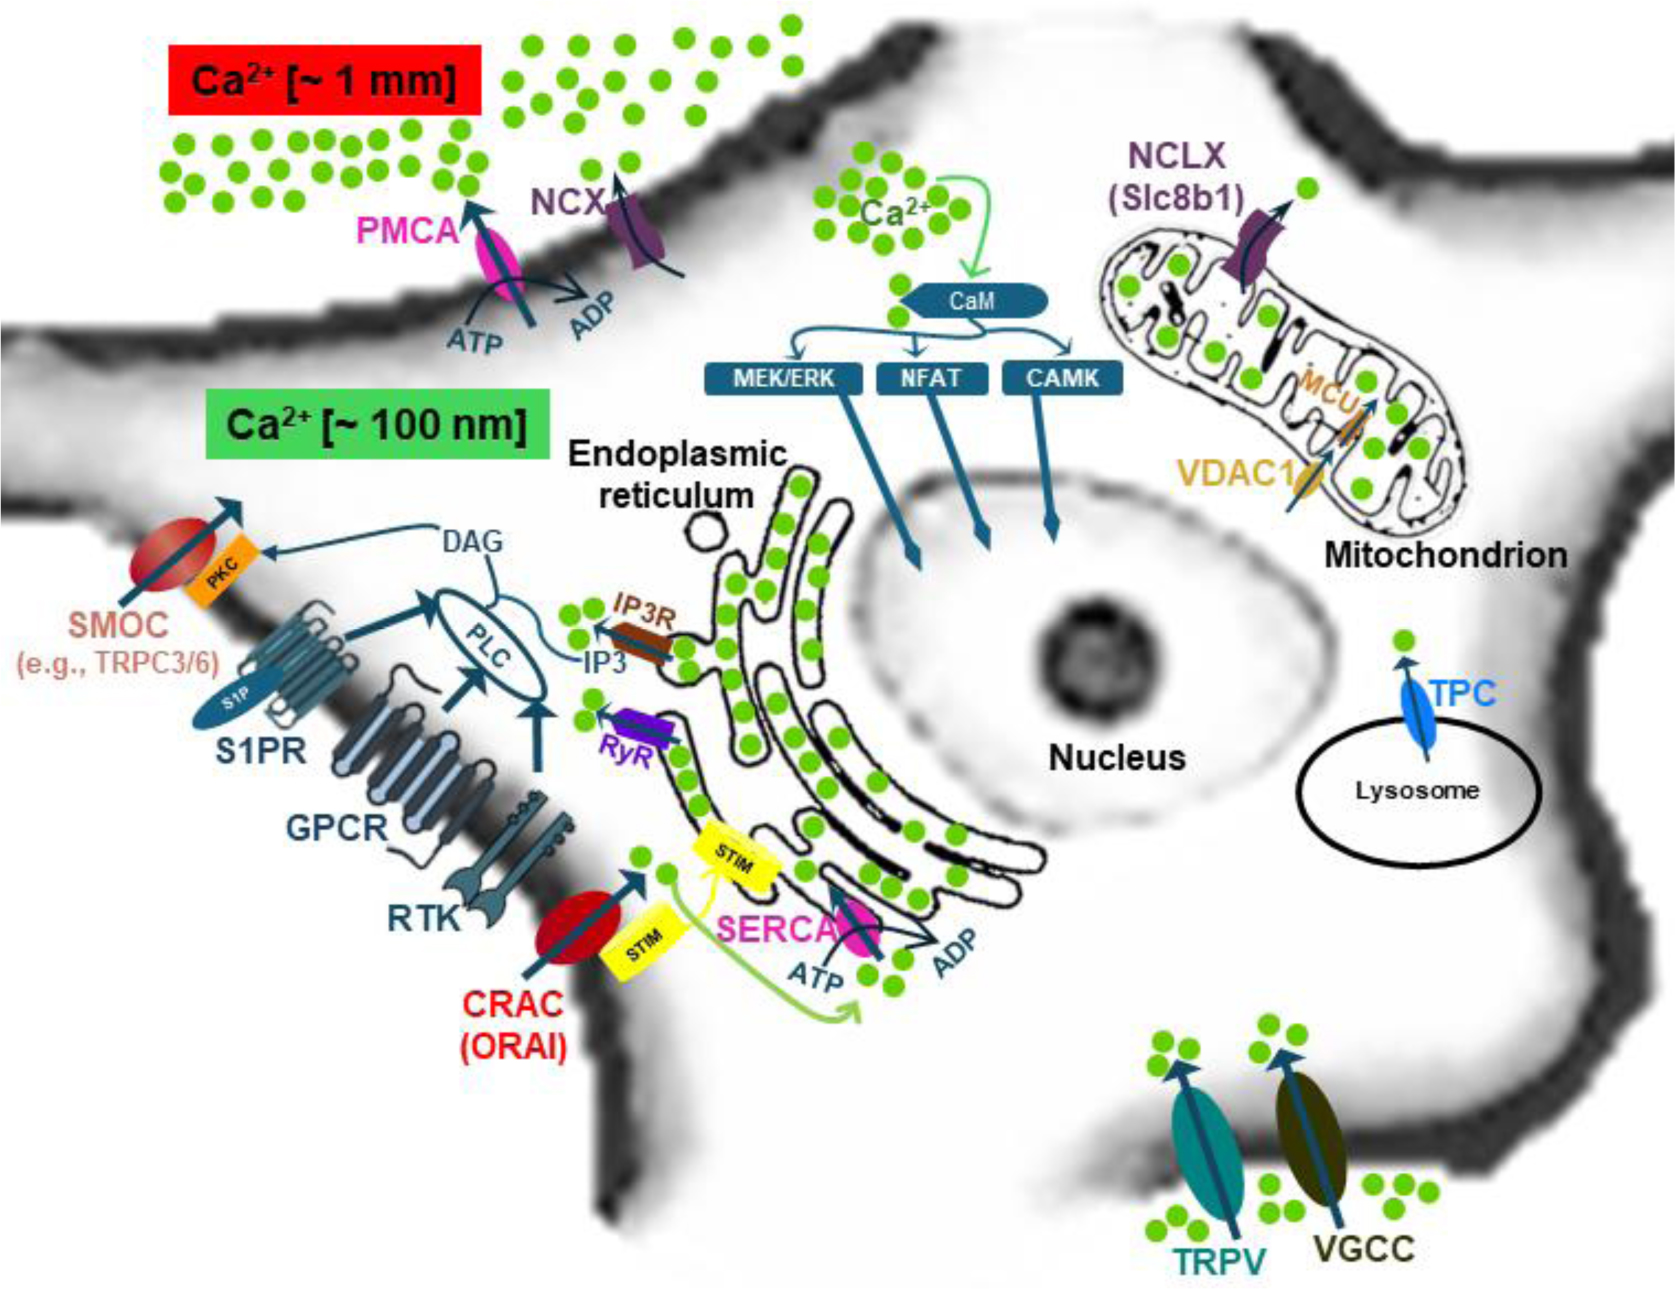
Calcium (Ca2+) signaling plays a pivotal role in coordinating neural stem cell (NSC) proliferation across various cell cycle stages, regulating immediate early gene transcription, and governing processes like quiescence and cell division. Additionally, calcium signaling pathways are implicated in the initiation, progression, and therapeutic targeting of glioblastoma multiforme (GBM), particularly focusing on glioma stem cells (GSCs). Intracellular calcium levels are increased through the activation of channels, transporters, and calcium-binding proteins (CaBPs), which generate specific calcium signals characterized by spatial, temporal, and intensity profiles. Moreover, extracellular factors such as growth factors, neurotransmitters, and extracellular nucleotides modulate calcium levels to finely regulate NSC and GBM behavior. Calcium-associated proteins and ion channels like calcium release-activated (CRAC) channels and voltage-gated calcium channels play key roles in NSC proliferation and differentiation. Despite calcium's versatile and widespread role as a second messenger critical for regulating various cellular functions, the specific roles of calcium in stem cell niches, stem cell maintenance, and glioblastoma stem cells are still in early stages of exploration. This article aimed to provide a comprehensive and current understanding of the roles of calcium signaling in NSC behavior and interactions within their niche, which are critical for neurogenesis, brain repair mechanisms, and understanding age-related decline in stem cell function. Investigating the heterogeneity of GBM tumors resembling neurospheres and their similarity to neural stem cells (NSCs) highlights the critical involvement of calcium in governing cellular behaviors such as quiescence, proliferation, and migration. Furthermore, this manuscript illuminates various potential interventions targeting calcium channels and associated signaling pathways to mitigate GSC activities and hinder GBM recurrence, offering a promising avenue for developing novel therapeutic strategies against GBM.
Citation: Ola A Al-Ewaidat, Sopiko Gogia, Valiko Begiashvili, Moawiah M Naffaa. The multifaceted role of calcium signaling dynamics in neural cell proliferation and gliomagenesis[J]. AIMS Biophysics, 2024, 11(3): 296-328. doi: 10.3934/biophy.2024017
Calcium (Ca2+) signaling plays a pivotal role in coordinating neural stem cell (NSC) proliferation across various cell cycle stages, regulating immediate early gene transcription, and governing processes like quiescence and cell division. Additionally, calcium signaling pathways are implicated in the initiation, progression, and therapeutic targeting of glioblastoma multiforme (GBM), particularly focusing on glioma stem cells (GSCs). Intracellular calcium levels are increased through the activation of channels, transporters, and calcium-binding proteins (CaBPs), which generate specific calcium signals characterized by spatial, temporal, and intensity profiles. Moreover, extracellular factors such as growth factors, neurotransmitters, and extracellular nucleotides modulate calcium levels to finely regulate NSC and GBM behavior. Calcium-associated proteins and ion channels like calcium release-activated (CRAC) channels and voltage-gated calcium channels play key roles in NSC proliferation and differentiation. Despite calcium's versatile and widespread role as a second messenger critical for regulating various cellular functions, the specific roles of calcium in stem cell niches, stem cell maintenance, and glioblastoma stem cells are still in early stages of exploration. This article aimed to provide a comprehensive and current understanding of the roles of calcium signaling in NSC behavior and interactions within their niche, which are critical for neurogenesis, brain repair mechanisms, and understanding age-related decline in stem cell function. Investigating the heterogeneity of GBM tumors resembling neurospheres and their similarity to neural stem cells (NSCs) highlights the critical involvement of calcium in governing cellular behaviors such as quiescence, proliferation, and migration. Furthermore, this manuscript illuminates various potential interventions targeting calcium channels and associated signaling pathways to mitigate GSC activities and hinder GBM recurrence, offering a promising avenue for developing novel therapeutic strategies against GBM.

| [1] |
Maldonado-Soto AR, Oakley DH, Wichterle H, et al. (2014) Stem cells in the nervous system. Am J Phys Med Rehabil 93: S132-144. https://doi:10.3389/fcell.2020.00533 
|
| [2] |
Mira H, Morante J (2020) Neurogenesis from embryo to adult-lessons from flies and mice. Front Cell Dev Biol 8: 533. https://doi:10.1097/PHM.0000000000000111
|
| [3] |
Kudla J, Becker D, Grill E, et al. (2018) Advances and current challenges in calcium signaling. New Phytol 218: 414-431. https://doi:10.1111/nph.14966
|
| [4] |
Moreau M, Leclerc C (2004) The choice between epidermal and neural fate: a matter of calcium. Int J Dev Biol 48: 75-84. https://doi:10.1387/ijdb.15272372
|
| [5] |
Somasundaram A, Shum AK, McBride HJ, et al. (2014) Store-operated CRAC channels regulate gene expression and proliferation in neural progenitor cells. J Neurosci 34: 9107-9123. https://doi:10.1523/JNEUROSCI.0263-14.2014
|
| [6] |
Colella M, Gerbino A, Hofer AM, et al. (2016) Recent advances in understanding the extracellular calcium-sensing receptor. F1000Res 5. https://doi:10.12688/f1000research.8963.1
|
| [7] |
Ermakov A, Daks A, Fedorova O, et al. (2018) Ca2+-depended signaling pathways regulate self-renewal and pluripotency of stem cells. Cell Biol Int 42: 1086-1096. https://doi:10.1002/cbin.10998
|
| [8] |
Lee JH, Lee JE, Kahng JY, et al. (2018) Human glioblastoma arises from subventricular zone cells with low-level driver mutations. Nature 560: 243-247. https://doi:10.1038/s41586-018-0389-3
|
| [9] |
Barami K (2007) Biology of the subventricular zone in relation to gliomagenesis. J Clin Neurosci 14: 1143-1149. https://doi:10.1016/j.jocn.2007.04.009
|
| [10] |
Quinones-Hinojosa A, Chaichana K (2007) The human subventricular zone: a source of new cells and a potential source of brain tumors. Exp Neurol 205: 313-324. https://doi:10.1016/j.expneurol.2007.03.016
|
| [11] |
Recht L, Jang T, Savarese T, et al. (2003) Neural stem cells and neuro-oncology: quo vadis?. J Cell Biochem 88: 11-19. https://doi:10.1002/jcb.10208
|
| [12] |
Zarco N, Norton E, Quinones-Hinojosa A, et al. (2019) Overlapping migratory mechanisms between neural progenitor cells and brain tumor stem cells. Cell Mol Life Sci 76: 3553-3570. https://doi:10.1007/s00018-019-03149-7
|
| [13] | Rodriguez SMB, Staicu GA, Sevastre AS, et al. (2022) Glioblastoma stem cells-useful tools in the battle against cancer. Int J Mol Sci 23. https://doi:10.3390/ijms23094602 |
| [14] |
Samanta K, Parekh AB (2017) Spatial Ca2+ profiling: decrypting the universal cytosolic Ca2+ oscillation. J Physiol 595: 3053-3062. https://doi:10.1113/JP272860
|
| [15] |
Pinto MC, Kihara AH, Goulart VA, et al. (2015) Calcium signaling and cell proliferation. Cell Signal 27: 2139-2149. https://doi:10.1016/j.cellsig.2015.08.006
|
| [16] |
Berridge MJ, Bootman MD, Roderick HL (2003) Calcium signalling: dynamics, homeostasis and remodelling. Nat Rev Mol Cell Biol 4: 517-529. https://doi:10.1038/nrm1155
|
| [17] | Marchant JS (2019) Ca2+ signaling and regeneration. CSH Perspect Biol 11: a035485. https://doi:10.1101/cshperspect.a035485 |
| [18] |
Hao B, Webb SE, Miller AL, et al. (2016) The role of Ca2+ signaling on the self-renewal and neural differentiation of embryonic stem cells (ESCs). Cell Calcium 59: 67-74. https://doi:10.1016/j.ceca.2016.01.004
|
| [19] |
Toth AB, Shum AK, Prakriya M (2016) Regulation of neurogenesis by calcium signaling. Cell Calcium 59: 124-134. https://doi:10.1016/j.ceca.2016.02.011
|
| [20] |
Li H, Rao A, Hogan PG (2011) Interaction of calcineurin with substrates and targeting proteins. Trends Cell Biol 21: 91-103. https://doi:10.1016/j.tcb.2010.09.011
|
| [21] |
Morgan PJ, Hubner R, Rolfs A, et al. (2013) Spontaneous calcium transients in human neural progenitor cells mediated by transient receptor potential channels. Stem Cells Dev 22: 2477-2486. https://doi:10.1089/scd.2013.0061
|
| [22] | Rosenberg SS, Spitzer NC (2011) Calcium signaling in neuronal development. CSH Perspect Biol 3: a004259. https://doi:10.1101/cshperspect.a004259 |
| [23] |
Parekh AB (2008) Ca2+ microdomains near plasma membrane Ca2+ channels: impact on cell function. J Physiol 586: 3043-3054. https://doi:10.1113/jphysiol.2008.153460
|
| [24] |
Petersen OH, Courjaret R, Machaca K (2017) Ca2+ tunnelling through the ER lumen as a mechanism for delivering Ca2+ entering via store-operated Ca2+ channels to specific target sites. J Physiol 595: 2999-3014. https://doi:10.1113/JP272772
|
| [25] | Bootman MD, Bultynck G (2020) Fundamentals of cellular calcium signaling: a primer. CSH Perspect Biol 12: a038802. https://doi:10.1101/cshperspect.a038802 |
| [26] | Barak P, Parekh AB (2020) Signaling through Ca2+ microdomains from store-operated CRAC channels. CSH Perspect Biol 12: a035097. https://doi:10.1101/cshperspect.a035097 |
| [27] |
Bagur R, Hajnoczky G (2017) Intracellular Ca2+ sensing: its role in Calcium homeostasis and signaling. Mol Cell 66: 780-788. https://doi:10.1016/j.molcel.2017.05.028
|
| [28] |
Duan PF, Yuan XP, Gan S, et al. (2020) Time delay induces saw-tooth calcium wave and transition in intracellular calcium oscillation. Chinese J Phys 66: 150-156. https://doi:10.1016/j.cjph.2020.05.003
|
| [29] |
Lin L, Duan WL (2018) Transport phenomena in intracellular calcium dynamics driven by non-Gaussian noises. Physica A 492: 431-437. https://doi:10.1016/j.physa.2017.10.037
|
| [30] | Duan WL, Zeng CH (2017) Statistics for anti-synchronization of intracellular calcium dynamics. Appl Math Comput 293: 611-616. https://doi:10.1016/j.amc.2016.07.041 |
| [31] |
Zhang Y, Wu Y, Zhang M, et al. (2023) Synergistic mechanism between the endoplasmic reticulum and mitochondria and their crosstalk with other organelles. Cell Death Discov 9: 51. https://doi:10.1038/s41420-023-01353-w
|
| [32] |
Bruce JIE (2018) Metabolic regulation of the PMCA: role in cell death and survival. Cell Calcium 69: 28-36. https://doi:10.1016/j.ceca.2017.06.001
|
| [33] |
Giladi M, Tal I, Khananshvili D (2016) Structural features of ion ransport and allosteric regulation in sodium-calcium exchanger (NCX) proteins. Front Physiol 7: 30. https://doi:10.3389/fphys.2016.00030
|
| [34] |
Mammucari C, Raffaello A, Vecellio Reane D, et al. (2018) Mitochondrial calcium uptake in organ physiology: from molecular mechanism to animal models. Pflug Arch Eur J Phy 470: 1165-1179. https://doi:10.1007/s00424-018-2123-2
|
| [35] |
Morgan AJ (2016) Ca2+ dialogue between acidic vesicles and ER. Biochem Soc Trans 44: 546-553. https://doi:10.1042/BST20150290
|
| [36] |
Prakriya M, Lewis RS (2015) Store-operated Calcium channels. Physiol Rev 95: 1383-1436. https://doi:10.1152/physrev.00020.2014
|
| [37] |
Parekh AB, Putney JW (2005) Store-operated calcium channels. Physiol Rev 85: 757-810. https://doi:10.1152/physrev.00057.2003
|
| [38] |
Lintschinger B, Balzer-Geldsetzer M, Baskaran T, et al. (2000) Coassembly of Trp1 and Trp3 proteins generates diacylglycerol- and Ca2+-sensitive cation channels. J Biol Chem 275: 27799-27805. https://doi:10.1074/jbc.M002705200
|
| [39] |
Liu X, Bandyopadhyay BC, Singh BB, et al. (2005) Molecular analysis of a store-operated and 2-acetyl-sn-glycerol-sensitive non-selective cation channel. Heteromeric assembly of TRPC1-TRPC3. J Biol Chem 280: 21600-21606. https://doi:10.1074/jbc.C400492200
|
| [40] |
Santulli G, Lewis D, des Georges A, et al. (2018) Ryanodine receptor structure and function in health and disease. Subcell Biochem 87: 329-352. https://doi:10.1007/978-981-10-7757-9_11
|
| [41] |
Lu L (2021) Mobilizing ER IP3 receptors as a mechanism to enhance calcium signaling. Cell Mol Immunol 18: 2284-2285. https://doi:10.1038/s41423-021-00725-5
|
| [42] |
Prakriya M (2009) The molecular physiology of CRAC channels. Immunol Rev 231: 88-98. https://doi:10.1111/j.1600-065X.2009.00820.x
|
| [43] |
Berridge MJ (2016) The Inositol Trisphosphate/Calcium signaling pathway in health and disease. Physiol Rev 96: 1261-1296. https://doi:10.1152/physrev.00006.2016
|
| [44] |
Parekh AB (2010) Store-operated CRAC channels: function in health and disease. Nat Rev Drug Discov 9: 399-410. https://doi:10.1038/nrd3136
|
| [45] |
Meissner G (2017) The structural basis of ryanodine receptor ion channel function. J Gen Physiol 149: 1065-1089. https://doi:10.1085/jgp.201711878
|
| [46] |
Wu HH, Brennan C, Ashworth R (2011) Ryanodine receptors, a family of intracellular calcium ion channels, are expressed throughout early vertebrate development. BMC Res Notes 4: 541. https://doi:10.1186/1756-0500-4-541
|
| [47] |
Woll KA, Van Petegem F (2022) Calcium-release channels: structure and function of IP(3) receptors and ryanodine receptors. Physiol Rev 102: 209-268. https://doi:10.1152/physrev.00033.2020
|
| [48] | Pulli I, Asghar MY, Kemppainen K, et al. (2018) Sphingolipid-mediated calcium signaling and its pathological effects. BBA Mol Cell Res 1865: 1668-1677. https://doi:10.1016/j.bbamcr.2018.04.012 |
| [49] |
Berridge MJ, Lipp P, Bootman MD (2000) The versatility and universality of calcium signalling. Nat Rev Mol Cell Biol 1: 11-21. https://doi:10.1038/35036035
|
| [50] |
Rapizzi E, Donati C, Cencetti F, et al. (2007) Sphingosine 1-phosphate receptors modulate intracellular Ca2+ homeostasis. Biochem Biophys Res Commun 353: 268-274. https://doi:10.1016/j.bbrc.2006.12.010
|
| [51] |
Uhlen P, Fritz N, Smedler E, et al. (2015) Calcium signaling in neocortical development. Dev Neurobiol 75: 360-368. https://doi:10.1002/dneu.22273
|
| [52] | Lewis RS (2020) Store-operated calcium channels: from function to structure and back again. CSH Perspect Biol 12: a035055. https://doi:10.1101/cshperspect.a035055 |
| [53] |
Dolmetsch RE, Pajvani U, Fife K, et al. (2001) Signaling to the nucleus by an L-type calcium channel-calmodulin complex through the MAP kinase pathway. Science 294: 333-339. https://doi:10.1126/science.1063395
|
| [54] |
Yanez M, Gil-Longo J, Campos-Toimil M (2012) Calcium binding proteins. Adv Exp Med Biol 740: 461-482. https://doi:10.1007/978-94-007-2888-2_19
|
| [55] | Schwaller B (2010) Cytosolic Ca2+ buffers. CSH Perspect Biol 2: a004051. https://doi:10.1101/cshperspect.a004051 |
| [56] |
Gilabert JA (2020) Cytoplasmic calcium buffering: an integrative crosstalk. Adv Exp Med Biol 1131: 163-182. https://doi:10.1007/978-3-030-12457-1_7
|
| [57] |
Park YJ, Yoo SA, Kim M, et al. (2020) The role of calcium-calcineurin-NFAT signaling pathway in health and autoimmune diseases. Front Immunol 11: 195. https://doi:10.3389/fimmu.2020.00195
|
| [58] |
Hogan PG, Chen L, Nardone J, et al. (2003) Transcriptional regulation by calcium, calcineurin, and NFAT. Genes Dev 17: 2205-2232. https://doi:10.1101/gad.1102703
|
| [59] |
Dolmetsch RE, Xu K, Lewis RS (1998) Calcium oscillations increase the efficiency and specificity of gene expression. Nature 392: 933-936. https://doi:10.1038/31960
|
| [60] |
Lilienbaum A, Israel A (2003) From calcium to NF-kappa B signaling pathways in neurons. Mol Cell Biol 23: 2680-2698. https://doi:10.1128/MCB.23.8.2680-2698.2003
|
| [61] |
Groth RD, Coicou LG, Mermelstein PG, et al. (2007) Neurotrophin activation of NFAT-dependent transcription contributes to the regulation of pro-nociceptive genes. J Neurochem 102: 1162-1174. https://doi:10.1111/j.1471-4159.2007.04632.x
|
| [62] |
Groth RD, Mermelstein PG (2003) Brain-derived neurotrophic factor activation of NFAT (nuclear factor of activated T-cells)-dependent transcription: a role for the transcription factor NFATc4 in neurotrophin-mediated gene expression. J Neurosci 23: 8125-8134. https://doi:10.1523/JNEUROSCI.23-22-08125.2003
|
| [63] |
Vashishta A, Habas A, Pruunsild P, et al. (2009) Nuclear factor of activated T-cells isoform c4 (NFATc4/NFAT3) as a mediator of antiapoptotic transcription in NMDA receptor-stimulated cortical neurons. J Neurosci 29: 15331-15340. https://doi:10.1523/JNEUROSCI.4873-09.2009
|
| [64] |
Oliveria SF, Dell'Acqua ML, Sather WA (2007) AKAP79/150 anchoring of calcineurin controls neuronal L-type Ca2+ channel activity and nuclear signaling. Neuron 55: 261-275. https://doi:10.1016/j.neuron.2007.06.032
|
| [65] |
Kar P, Samanta K, Kramer H, et al. (2014) Dynamic assembly of a membrane signaling complex enables selective activation of NFAT by Orai1. Curr Biol 24: 1361-1368. https://doi:10.1016/j.cub.2014.04.046
|
| [66] |
Lewis RS (2003) Calcium oscillations in T-cells: mechanisms and consequences for gene expression. Biochem Soc Trans 31: 925-929. https://doi:10.1042/bst0310925
|
| [67] |
Jairaman A, Yamashita M, Schleimer RP, et al. (2015) Store-operated Ca2+ release-activated Ca2+ channels regulate PAR2-activated Ca2+ signaling and cytokine production in airway epithelial cells. J Immunol 195: 2122-2133. https://doi:10.4049/jimmunol.1500396
|
| [68] |
Gorlach A, Bertram K, Hudecova S, et al. (2015) Calcium and ROS: a mutual interplay. Redox Biol 6: 260-271. https://doi:10.1016/j.redox.2015.08.010
|
| [69] |
Trebak M, Kinet JP (2019) Calcium signalling in T cells. Nat Rev Immunol 19: 154-169. https://doi:10.1038/s41577-018-0110-7
|
| [70] |
Carvalho EJ, Stathopulos PB, Madesh M (2020) Regulation of Ca2+ exchanges and signaling in mitochondria. Curr Opin Physiol 17: 197-206. https://doi:10.1016/j.cophys.2020.08.010
|
| [71] |
Wacquier B, Combettes L, Van Nhieu GT, et al. (2016) Interplay between intracellular Ca2+ oscillations and Ca2+-stimulated mitochondrial metabolism. Sci Rep 6: 19316. https://doi:10.1038/srep19316
|
| [72] |
Demarque M, Represa A, Becq H, et al. (2002) Paracrine intercellular communication by a Ca2+- and SNARE-independent release of GABA and glutamate prior to synapse formation. Neuron 36: 1051-1061. https://doi:10.1016/s0896-6273(02)01053-x
|
| [73] |
Manent JB, Demarque M, Jorquera I, et al. (2005) A noncanonical release of GABA and glutamate modulates neuronal migration. J Neurosci 25: 4755-4765. https://doi:10.1523/JNEUROSCI.0553-05.2005
|
| [74] | Catterall WA (2011) Voltage-gated calcium channels. CSH Perspect Biol 3: a003947. https://doi:10.1101/cshperspect.a003947 |
| [75] |
Prevarskaya N, Skryma R, Shuba Y (2018) Ion channels in cancer: Are cancer hallmarks oncochannelopathies?. Physiol Rev 98: 559-621. https://doi:10.1152/physrev.00044.2016
|
| [76] |
Pitt GS, Matsui M, Cao C (2021) Voltage-Gated Calcium Channels in Nonexcitable Tissues. Annu Rev Physiol 83: 183-203. https://doi:10.1146/annurev-physiol-031620-091043
|
| [77] |
Pedersen SF, Nilius B (2007) Transient receptor potential channels in mechanosensing and cell volume regulation. Method Enzymol 428: 183-207. https://doi:10.1016/S0076-6879(07)28010-3
|
| [78] |
Liberati S, Morelli MB, Amantini C, et al. (2014) Advances in transient receptor potential vanilloid-2 channel expression and function in tumor growth and progression. Curr Protein Pept Sci 15: 732-737. https://doi:10.2174/1389203715666140704115913
|
| [79] | Alexander SP, Peters JA, Kelly E, et al. (2017) The concise guide to pharmacology 2017/18: Ligand–gated ion channels. Brit J Pharmacol 174: S130-S159. https://doi:10.1111/bph.13879 |
| [80] |
Flint AC, Dammerman RS, Kriegstein AR (1999) Endogenous activation of metabotropic glutamate receptors in neocortical development causes neuronal calcium oscillations. P Natl Acad Sci USA 96: 12144-12149. https://doi:10.1073/pnas.96.21.12144
|
| [81] |
Pathak MM, Nourse JL, Tran T, et al. (2014) Stretch-activated ion channel Piezo1 directs lineage choice in human neural stem cells. P Natl Acad Sci USA 111: 16148-16153. https://doi:10.1073/pnas.1409802111
|
| [82] |
Beckervordersandforth R, Tripathi P, Ninkovic J, et al. (2010) In vivo fate mapping and expression analysis reveals molecular hallmarks of prospectively isolated adult neural stem cells. Cell Stem Cell 7: 744-758. https://doi:10.1016/j.stem.2010.11.017
|
| [83] |
Lacar B, Young SZ, Platel JC, et al. (2011) Gap junction-mediated calcium waves define communication networks among murine postnatal neural progenitor cells. Eur J Neurosci 34: 1895-1905. https://doi:10.1111/j.1460-9568.2011.07901.x
|
| [84] |
Kraft A, Jubal ER, von Laer R, et al. (2017) Astrocytic calcium waves signal brain injury to neural stem and progenitor cells. Stem Cell Rep 8: 701-714. https://doi:10.1016/j.stemcr.2017.01.009
|
| [85] |
Domenichini F, Terrie E, Arnault P, et al. (2018) Store-operated calcium entries control neural stem cell self-renewal in the adult brain subventricular zone. Stem Cells 36: 761-774. https://doi:10.1002/stem.2786
|
| [86] |
Machaca K (2010) Ca2+ signaling, genes and the cell cycle. Cell Calcium 48: 243-250. https://doi:10.1016/j.ceca.2010.10.003
|
| [87] |
Llorente V, Velarde P, Desco M, et al. (2022) Current understanding of the neural stem cell niches. Cells 11: 3002. https://doi:10.3390/cells11193002
|
| [88] |
MacDougall MS, Clarke R, Merrill BJ (2019) Intracellular Ca2+ homeostasis and nuclear export mediate exit from naive pluripotency. Cell Stem Cell 25: 210-224. https://doi:10.1016/j.stem.2019.04.015
|
| [89] |
Broxmeyer HE (2019) Hematopoietic stem cell intracellular levels of Ca2+ to the rescue! What next?. Cell Stem Cell 25: 171-173. https://doi:10.1016/j.stem.2019.07.003
|
| [90] |
Umemoto T, Hashimoto M, Matsumura T, et al. (2018) Ca2+-mitochondria axis drives cell division in hematopoietic stem cells. J Exp Med 215: 2097-2113. https://doi:10.1084/jem.20180421
|
| [91] |
Shi J, Parada LF, Kernie SG (2005) Bax limits adult neural stem cell persistence through caspase and IP3 receptor activation. Cell Death Differ 12: 1601-1612. https://doi:10.1038/sj.cdd.4401676
|
| [92] |
Mikoshiba K (2015) Role of IP3 receptor signaling in cell functions and diseases. Adv Biol Regul 57: 217-227. https://doi:10.1016/j.jbior.2014.10.001
|
| [93] |
Maric D, Maric I, Barker JL (2000) Developmental changes in cell calcium homeostasis during neurogenesis of the embryonic rat cerebral cortex. Cereb Cortex 10: 561-573. https://doi:10.1093/cercor/10.6.561
|
| [94] |
Serrano-Perez MC, Fernandez M, Neria F, et al. (2015) NFAT transcription factors regulate survival, proliferation, migration, and differentiation of neural precursor cells. Glia 63: 987-1004. https://doi:10.1002/glia.22797
|
| [95] |
Zhao D, Najbauer J, Garcia E, et al. (2008) Neural stem cell tropism to glioma: critical role of tumor hypoxia. Mol Cancer Res 6: 1819-1829. https://doi:10.1158/1541-7786.MCR-08-0146
|
| [96] |
Yuan JP, Zeng W, Huang GN, et al. (2007) STIM1 heteromultimerizes TRPC channels to determine their function as store-operated channels. Nat Cell Biol 9: 636-645. https://doi:10.1038/ncb1590
|
| [97] |
Di Giorgi-Gerevini V, Melchiorri D, Battaglia G, et al. (2005) Endogenous activation of metabotropic glutamate receptors supports the proliferation and survival of neural progenitor cells. Cell Death Differ 12: 1124-1133. https://doi:10.1038/sj.cdd.4401639
|
| [98] |
Chan CM, Aw JT, Webb SE, et al. (2016) SOCE proteins, STIM1 and Orai1, are localized to the cleavage furrow during cytokinesis of the first and second cell division cycles in zebrafish embryos. Zygote 24: 880-889. https://doi:10.1017/S0967199416000216
|
| [99] |
Petrik D, Myoga MH, Grade S, et al. (2018) Epithelial sodium channel regulates adult neural stem cell proliferation in a flow-dependent manner. Cell Stem Cell 22: 865-878. https://doi:10.1016/j.stem.2018.04.016
|
| [100] |
Harraz OF, Altier C (2014) STIM1-mediated bidirectional regulation of Ca2+ entry through voltage-gated calcium channels (VGCC) and calcium-release activated channels (CRAC). Front Cell Neurosci 8: 43. https://doi:10.3389/fncel.2014.00043
|
| [101] |
Naffaa MM (2024) Significance of the anterior cingulate cortex in neurogenesis plasticity: Connections, functions, and disorders across postnatal and adult stages. Bioessays 46: e2300160. https://doi:10.1002/bies.202300160
|
| [102] |
Naffaa MM, Khan RR, Kuo CT, et al. (2023) Cortical regulation of neurogenesis and cell proliferation in the ventral subventricular zone. Cell Rep 42: 112783. https://doi:10.1016/j.celrep.2023.112783
|
| [103] |
Naffaa MM (2025) Neurogenesis dynamics in the olfactory bulb: deciphering circuitry organization, function, and adaptive plasticity. Neural Regen Res 20: 1565-1581. https://doi:10.4103/NRR.NRR-D-24-00312
|
| [104] | Naffaa MM, Yin HH (2023) A cholinergic signaling pathway underlying cortical circuit regulation of lateral ventricle quiescent neural stem cells. bioRxiv . https://doi:10.1101/2023.09.02.556037 |
| [105] |
Lecca D, Fumagalli M, Ceruti S, et al. (2016) Intertwining extracellular nucleotides and their receptors with Ca2+ in determining adult neural stem cell survival, proliferation and final fate. Philos Trans R Soc Lond B Biol Sci 371: 20150433. https://doi:10.1098/rstb.2015.0433
|
| [106] |
Braun N, Sevigny J, Mishra SK, et al. (2003) Expression of the ecto-ATPase NTPDase2 in the germinal zones of the developing and adult rat brain. Eur J Neurosci 17: 1355-1364. https://doi:10.1046/j.1460-9568.2003.02567.x
|
| [107] |
Messemer N, Kunert C, Grohmann M, et al. (2013) P2X7 receptors at adult neural progenitor cells of the mouse subventricular zone. Neuropharmacology 73: 122-137. https://doi:10.1016/j.neuropharm.2013.05.017
|
| [108] |
Stafford MR, Bartlett PF, Adams DJ (2007) Purinergic receptor activation inhibits mitogen-stimulated proliferation in primary neurospheres from the adult mouse subventricular zone. Mol Cell Neurosci 35: 535-548. https://doi:10.1016/j.mcn.2007.04.013
|
| [109] |
Genzen JR, Platel JC, Rubio ME, et al. (2009) Ependymal cells along the lateral ventricle express functional P2X(7) receptors. Purinergic Signal 5: 299-307. https://doi:10.1007/s11302-009-9143-5
|
| [110] |
Leeson HC, Kasherman MA, Chan-Ling T, et al. (2018) P2X7 receptors regulate phagocytosis and proliferation in adult hippocampal and SVZ neural progenitor cells: implications for inflammation in neurogenesis. Stem Cells 36: 1764-1777. https://doi:10.1002/stem.2894
|
| [111] |
Yasuda T, Bartlett PF, Adams DJ (2008) K(ir) and K(v) channels regulate electrical properties and proliferation of adult neural precursor cells. Mol Cell Neurosci 37: 284-297. https://doi:10.1016/j.mcn.2007.10.003
|
| [112] |
Fiorio Pla A, Maric D, Brazer SC, et al. (2005) Canonical transient receptor potential 1 plays a role in basic fibroblast growth factor (bFGF)/FGF receptor-1-induced Ca2+ entry and embryonic rat neural stem cell proliferation. J Neurosci 25: 2687-2701. https://doi:10.1523/JNEUROSCI.0951-04.2005
|
| [113] |
Young SZ, Taylor MM, Wu S, et al. (2012) NKCC1 knockdown decreases neuron production through GABA(A)-regulated neural progenitor proliferation and delays dendrite development. J Neurosci 32: 13630-13638. https://doi:10.1523/JNEUROSCI.2864-12.2012
|
| [114] |
Stock K, Garthe A, de Almeida Sassi F, et al. (2014) The capsaicin receptor TRPV1 as a novel modulator of neural precursor cell proliferation. Stem Cells 32: 3183-3195. https://doi:10.1002/stem.1805
|
| [115] |
Roberts JC, Davis JB, Benham CD (2004) [3H]Resiniferatoxin autoradiography in the CNS of wild-type and TRPV1 null mice defines TRPV1 (VR-1) protein distribution. Brain Res 995: 176-183. https://doi:10.1016/j.brainres.2003.10.001
|
| [116] |
Khatri P, Obernier K, Simeonova IK, et al. (2014) Proliferation and cilia dynamics in neural stem cells prospectively isolated from the SEZ. Sci Rep 4: 3803. https://doi:10.1038/srep03803
|
| [117] |
Platel JC, Dave KA, Bordey A (2008) Control of neuroblast production and migration by converging GABA and glutamate signals in the postnatal forebrain. J Physiol 586: 3739-3743. https://doi:10.1113/jphysiol.2008.155325
|
| [118] |
Song M, Yu SP, Mohamad O, et al. (2017) Optogenetic stimulation of glutamatergic neuronal activity in the striatum enhances neurogenesis in the subventricular zone of normal and stroke mice. Neurobiol Dis 98: 9-24. https://doi:10.1016/j.nbd.2016.11.005
|
| [119] |
Nochi R, Kato T, Kaneko J, et al. (2012) Involvement of metabotropic glutamate receptor 5 signaling in activity-related proliferation of adult hippocampal neural stem cells. Eur J Neurosci 36: 2273-2283. https://doi:10.1111/j.1460-9568.2012.08128.x
|
| [120] |
Deisseroth K, Singla S, Toda H, et al. (2004) Excitation-neurogenesis coupling in adult neural stem/progenitor cells. Neuron 42: 535-552. https://doi:10.1016/s0896-6273(04)00266-1
|
| [121] |
Platel JC, Dave KA, Gordon V, et al. (2010) NMDA receptors activated by subventricular zone astrocytic glutamate are critical for neuroblast survival prior to entering a synaptic network. Neuron 65: 859-872. https://doi:10.1016/j.neuron.2010.03.009
|
| [122] |
Cavaliere F, Urra O, Alberdi E, et al. (2012) Oligodendrocyte differentiation from adult multipotent stem cells is modulated by glutamate. Cell Death Dis 3: e268. https://doi:10.1038/cddis.2011.144
|
| [123] |
Etxeberria A, Mangin JM, Aguirre A, et al. (2010) Adult-born SVZ progenitors receive transient synapses during remyelination in corpus callosum. Nat Neurosci 13: 287-289. https://doi:10.1038/nn.2500
|
| [124] |
Hughes EG, Orthmann-Murphy JL, Langseth AJ, et al. (2018) Myelin remodeling through experience-dependent oligodendrogenesis in the adult somatosensory cortex. Nat Neurosci 21: 696-706. https://doi:10.1038/s41593-018-0121-5
|
| [125] |
Xiao L, Ohayon D, McKenzie IA, et al. (2016) Rapid production of new oligodendrocytes is required in the earliest stages of motor-skill learning. Nat Neurosci 19: 1210-1217. https://doi:10.1038/nn.4351
|
| [126] |
Larson VA, Zhang Y, Bergles DE (2016) Electrophysiological properties of NG2+ cells: Matching physiological studies with gene expression profiles. Brain Res 1638: 138-160. https://doi:10.1016/j.brainres.2015.09.010
|
| [127] |
Buchanan J, Elabbady L, Collman F, et al. (2022) Oligodendrocyte precursor cells ingest axons in the mouse neocortex. Proc Natl Acad Sci USA 119: e2202580119. https://doi:10.1073/pnas.2202580119
|
| [128] |
Chen TJ, Kula B, Nagy B, et al. (2018) In vivo regulation of oligodendrocyte precursor cell proliferation and differentiation by the AMPA-receptor subunit GluA2. Cell Rep 25: 852-861 e857. https://doi:10.1016/j.celrep.2018.09.066
|
| [129] |
De Biase LM, Nishiyama A, Bergles DE (2010) Excitability and synaptic communication within the oligodendrocyte lineage. J Neurosci 30: 3600-3611. https://doi:10.1523/JNEUROSCI.6000-09.2010
|
| [130] |
Khawaja RR, Agarwal A, Fukaya M, et al. (2021) GluA2 overexpression in oligodendrocyte progenitors promotes postinjury oligodendrocyte regeneration. Cell Rep 35: 109147. https://doi:10.1016/j.celrep.2021.109147
|
| [131] |
Kougioumtzidou E, Shimizu T, Hamilton NB, et al. (2017) Signalling through AMPA receptors on oligodendrocyte precursors promotes myelination by enhancing oligodendrocyte survival. Elife 6: e28080. https://doi:10.7554/eLife.28080
|
| [132] |
Buchanan J, da Costa NM, Cheadle L (2023) Emerging roles of oligodendrocyte precursor cells in neural circuit development and remodeling. Trends Neurosci 46: 628-639. https://doi:10.1016/j.tins.2023.05.007
|
| [133] |
Marisca R, Hoche T, Agirre E, et al. (2020) Functionally distinct subgroups of oligodendrocyte precursor cells integrate neural activity and execute myelin formation. Nat Neurosci 23: 363-374. https://doi:10.1038/s41593-019-0581-2
|
| [134] |
Rungta RL, Chaigneau E, Osmanski BF, et al. (2018) Vascular compartmentalization of functional hyperemia from the synapse to the pia. Neuron 99: 362-375 e364. https://doi:10.1016/j.neuron.2018.06.012
|
| [135] |
Lu TY, Hanumaihgari P, Hsu ET, et al. (2023) Norepinephrine modulates calcium dynamics in cortical oligodendrocyte precursor cells promoting proliferation during arousal in mice. Nat Neurosci 26: 1739-1750. https://doi:10.1038/s41593-023-01426-0
|
| [136] |
McKenzie IA, Ohayon D, Li H, et al. (2014) Motor skill learning requires active central myelination. Science 346: 318-322. https://doi:10.1126/science.1254960
|
| [137] |
Kong H, Fan Y, Xie J, et al. (2008) AQP4 knockout impairs proliferation, migration and neuronal differentiation of adult neural stem cells. J Cell Sci 121: 4029-4036. https://doi:10.1242/jcs.035758
|
| [138] | Young SZ, Platel JC, Nielsen JV, et al. (2010) GABA(A) Increases calcium in subventricular zone astrocyte-like cells through L- and T-type voltage-gated calcium channels. Front Cell Neurosci 4: 8. https://doi:10.3389/fncel.2010.00008 |
| [139] |
Liu X, Wang Q, Haydar TF, et al. (2005) Nonsynaptic GABA signaling in postnatal subventricular zone controls proliferation of GFAP-expressing progenitors. Nat Neurosci 8: 1179-1187. https://doi:10.1038/nn1522
|
| [140] |
Daynac M, Chicheportiche A, Pineda JR, et al. (2013) Quiescent neural stem cells exit dormancy upon alteration of GABAAR signaling following radiation damage. Stem Cell Res 11: 516-528. https://doi:10.1016/j.scr.2013.02.008
|
| [141] |
Resende RR, Adhikari A (2009) Cholinergic receptor pathways involved in apoptosis, cell proliferation and neuronal differentiation. Cell Commun Signal 7: 20. https://doi:10.1186/1478-811X-7-20
|
| [142] |
Atluri P, Fleck MW, Shen Q, et al. (2001) Functional nicotinic acetylcholine receptor expression in stem and progenitor cells of the early embryonic mouse cerebral cortex. Dev Biol 240: 143-156. https://doi:10.1006/dbio.2001.0453
|
| [143] |
Williams BP, Milligan CJ, Street M, et al. (2004) Transcription of the M1 muscarinic receptor gene in neurons and neuronal progenitors of the embryonic rat forebrain. J Neurochem 88: 70-77. https://doi:10.1111/j.1471-4159.2004.02117.x
|
| [144] |
Zhou C, Wen ZX, Shi DM, et al. (2004) Muscarinic acetylcholine receptors involved in the regulation of neural stem cell proliferation and differentiation in vitro. Cell Biol Int 28: 63-67. https://doi:10.1016/j.cellbi.2003.10.005
|
| [145] |
Paez-Gonzalez P, Asrican B, Rodriguez E, et al. (2014) Identification of distinct ChAT+ neurons and activity-dependent control of postnatal SVZ neurogenesis. Nat Neurosci 17: 934-942. https://doi:10.1038/nn.3734
|
| [146] |
Narla ST, Klejbor I, Birkaya B, et al. (2013) Activation of developmental nuclear fibroblast growth factor receptor 1 signaling and neurogenesis in adult brain by alpha7 nicotinic receptor agonist. Stem Cells Transl Med 2: 776-788. https://doi:10.5966/sctm.2012-0103
|
| [147] |
Sharma G (2013) The dominant functional nicotinic receptor in progenitor cells in the rostral migratory stream is the alpha3beta4 subtype. J Neurophysiol 109: 867-872. https://doi:10.1152/jn.00886.2012
|
| [148] |
Mudo G, Belluardo N, Mauro A, et al. (2007) Acute intermittent nicotine treatment induces fibroblast growth factor-2 in the subventricular zone of the adult rat brain and enhances neuronal precursor cell proliferation. Neuroscience 145: 470-483. https://doi:10.1016/j.neuroscience.2006.12.012
|
| [149] |
Wang J, Lu Z, Fu X, et al. (2017) Alpha-7 nicotinic receptor signaling pathway participates in the neurogenesis induced by ChAT-Positive neurons in the subventricular zone. Transl Stroke Res 8: 484-493. https://doi:10.1007/s12975-017-0541-7
|
| [150] |
Jimenez E, Montiel M (2005) Activation of MAP kinase by muscarinic cholinergic receptors induces cell proliferation and protein synthesis in human breast cancer cells. J Cell Physiol 204: 678-686. https://doi:10.1002/jcp.20326
|
| [151] |
Zhao WQ, Alkon DL, Ma W (2003) c-Src protein tyrosine kinase activity is required for muscarinic receptor-mediated DNA synthesis and neurogenesis via ERK1/2 and c-AMP-responsive element-binding protein signaling in neural precursor cells. J Neurosci Res 72: 334-342. https://doi:10.1002/jnr.10591
|
| [152] |
Rosenblum K, Futter M, Jones M, et al. (2000) ERKI/II regulation by the muscarinic acetylcholine receptors in neurons. J Neurosci 20: 977-985. https://doi:10.1523/JNEUROSCI.20-03-00977.2000
|
| [153] |
Goffart N, Kroonen J, Rogister B (2013) Glioblastoma-initiating cells: relationship with neural stem cells and the micro-environment. Cancers (Basel) 5: 1049-1071. https://doi:10.3390/cancers5031049
|
| [154] |
Yuan X, Curtin J, Xiong Y, et al. (2004) Isolation of cancer stem cells from adult glioblastoma multiforme. Oncogene 23: 9392-9400. https://doi:10.1038/sj.onc.1208311
|
| [155] |
Leclerc C, Haeich J, Aulestia FJ, et al. (2016) Calcium signaling orchestrates glioblastoma development: Facts and conjunctures. Biochim Biophys Acta 1863: 1447-1459. https://doi:10.1016/j.bbamcr.2016.01.018
|
| [156] |
dePadua M, Kulothungan P, Lath R, et al. (2022) Establishment and characterization of brain cancer primary cell cultures from patients to enable phenotypic screening for new drugs. Front Pharmacol 13: 778193. https://doi:10.3389/fphar.2022.778193
|
| [157] |
Zeniou M, Feve M, Mameri S, et al. (2015) Chemical library screening and structure-function relationship studies identify bisacodyl as a potent and selective cytotoxic agent towards quiescent human glioblastoma tumor stem-like cells. PLoS One 10: e0134793. https://doi:10.1371/journal.pone.0134793
|
| [158] |
Dong J, Aulestia FJ, Assad Kahn S, et al. (2017) Bisacodyl and its cytotoxic activity on human glioblastoma stem-like cells. Implication of inositol 1,4,5-triphosphate receptor dependent calcium signaling. Biochim Biophys Acta Mol Cell Res 1864: 1018-1027. https://doi:10.1016/j.bbamcr.2017.01.010
|
| [159] |
Robil N, Petel F, Kilhoffer MC, et al. (2015) Glioblastoma and calcium signaling--analysis of calcium toolbox expression. Int J Dev Biol 59: 407-415. https://doi:10.1387/ijdb.150200jh
|
| [160] |
Aulestia FJ, Neant I, Dong J, et al. (2018) Quiescence status of glioblastoma stem-like cells involves remodelling of Ca2+ signalling and mitochondrial shape. Sci Rep 8: 9731. https://doi:10.1038/s41598-018-28157-8
|
| [161] |
Terrie E, Deliot N, Benzidane Y, et al. (2021) Store-operated calcium channels control proliferation and self-renewal of cancer stem cells from glioblastoma. Cancers (Basel) 13: 3428. https://doi:10.3390/cancers13143428
|
| [162] |
Powell AE, Shung CY, Saylor KW, et al. (2010) Lessons from development: a role for asymmetric stem cell division in cancer. Stem Cell Res 4: 3-9. https://doi:10.1016/j.scr.2009.09.005
|
| [163] | Koguchi M, Nakahara Y, Ito H, et al. (2020) BMP4 induces asymmetric cell division in human glioma stem-like cells. Oncol Lett 19: 1247-1254. https://doi:10.3892/ol.2019.11231 |
| [164] |
Wee S, Niklasson M, Marinescu VD, et al. (2014) Selective calcium sensitivity in immature glioma cancer stem cells. PLoS One 9: e115698. https://doi:10.1371/journal.pone.0115698
|
| [165] |
Wang F, Wang AY, Chesnelong C, et al. (2018) ING5 activity in self-renewal of glioblastoma stem cells via calcium and follicle stimulating hormone pathways. Oncogene 37: 286-301. https://doi:10.1038/onc.2017.324
|
| [166] |
Motiani RK, Hyzinski-Garcia MC, Zhang X, et al. (2013) STIM1 and Orai1 mediate CRAC channel activity and are essential for human glioblastoma invasion. Pflugers Arch 465: 1249-1260. https://doi:10.1007/s00424-013-1254-8
|
| [167] |
Lee SH, Rigas NK, Lee CR, et al. (2016) Orai1 promotes tumor progression by enhancing cancer stemness via NFAT signaling in oral/oropharyngeal squamous cell carcinoma. Oncotarget 7: 43239-43255. https://doi:10.18632/oncotarget.9755
|
| [168] |
Wang J, Zhao H, Zheng L, et al. (2021) FGF19/SOCE/NFATc2 signaling circuit facilitates the self-renewal of liver cancer stem cells. Theranostics 11: 5045-5060. https://doi:10.7150/thno.56369
|
| [169] |
Gengatharan A, Malvaut S, Marymonchyk A, et al. (2021) Adult neural stem cell activation in mice is regulated by the day/night cycle and intracellular calcium dynamics. Cell 184: 709-722 e713. https://doi:10.1016/j.cell.2020.12.026
|
| [170] |
Cabanas H, Harnois T, Magaud C, et al. (2018) Deregulation of calcium homeostasis in Bcr-Abl-dependent chronic myeloid leukemia. Oncotarget 9: 26309-26327. https://doi:10.18632/oncotarget.25241
|
| [171] |
Li Y, Guo B, Xie Q, et al. (2015) STIM1 mediates hypoxia-driven hepatocarcinogenesis via interaction with HIF-1. Cell Rep 12: 388-395. https://doi:10.1016/j.celrep.2015.06.033
|
| [172] |
Umemura M, Baljinnyam E, Feske S, et al. (2014) Store-operated Ca2+ entry (SOCE) regulates melanoma proliferation and cell migration. PLoS One 9: e89292. https://doi:10.1371/journal.pone.0089292
|
| [173] |
Jiang Y, Song Y, Wang R, et al. (2019) NFAT1-mediated regulation of NDEL1 promotes growth and invasion of glioma stem-like cells. Cancer Res 79: 2593-2603. https://doi:10.1158/0008-5472.CAN-18-3297
|
| [174] |
Shin HJ, Lee S, Jung HJ (2019) A curcumin derivative hydrazinobenzoylcurcumin suppresses stem-like features of glioblastoma cells by targeting Ca2+ /calmodulin-dependent protein kinase II. J Cell Biochem 120: 6741-6752. https://doi:10.1002/jcb.27972
|
| [175] |
Song Y, Jiang Y, Tao D, et al. (2020) NFAT2-HDAC1 signaling contributes to the malignant phenotype of glioblastoma. Neuro Oncol 22: 46-57. https://doi:10.1093/neuonc/noz136
|
| [176] |
O'Reilly D, Buchanan P (2019) Calcium channels and cancer stem cells. Cell Calcium 81: 21-28. https://doi:10.1016/j.ceca.2019.05.006
|
| [177] |
Terrie E, Coronas V, Constantin B (2019) Role of the calcium toolkit in cancer stem cells. Cell Calcium 80: 141-151. https://doi:10.1016/j.ceca.2019.05.001
|
| [178] |
Gross S, Mallu P, Joshi H, et al. (2020) Ca2+ as a therapeutic target in cancer. Adv Cancer Res 148: 233-317. https://doi:10.1016/bs.acr.2020.05.003
|
| [179] |
Tajada S, Villalobos C (2020) Calcium permeable channels in cancer hallmarks. Front Pharmacol 11: 968. https://doi:10.3389/fphar.2020.00968
|
| [180] |
Alptekin M, Eroglu S, Tutar E, et al. (2015) Gene expressions of TRP channels in glioblastoma multiforme and relation with survival. Tumour Biol 36: 9209-9213. https://doi:10.1007/s13277-015-3577-x
|
| [181] |
Scrideli CA, Carlotti CG, Okamoto OK, et al. (2008) Gene expression profile analysis of primary glioblastomas and non-neoplastic brain tissue: identification of potential target genes by oligonucleotide microarray and real-time quantitative PCR. J Neurooncol 88: 281-291. https://doi:10.1007/s11060-008-9579-4
|
| [182] |
Bomben VC, Turner KL, Barclay TT, et al. (2011) Transient receptor potential canonical channels are essential for chemotactic migration of human malignant gliomas. J Cell Physiol 226: 1879-1888. https://doi:10.1002/jcp.22518
|
| [183] |
Liu H, Hughes JD, Rollins S, et al. (2011) Calcium entry via ORAI1 regulates glioblastoma cell proliferation and apoptosis. Exp Mol Pathol 91: 753-760. https://doi:10.1016/j.yexmp.2011.09.005
|
| [184] |
Liu Z, Wei Y, Zhang L, et al. (2019) Induction of store-operated calcium entry (SOCE) suppresses glioblastoma growth by inhibiting the Hippo pathway transcriptional coactivators YAP/TAZ. Oncogene 38: 120-139. https://doi:10.1038/s41388-018-0425-7
|
| [185] |
Coronas V, Terrie E, Deliot N, et al. (2020) Calcium channels in adult brain neural stem cells and in glioblastoma stem cells. Front Cell Neurosci 14: 600018. https://doi:10.3389/fncel.2020.600018
|
| [186] |
Lepannetier S, Zanou N, Yerna X, et al. (2016) Sphingosine-1-phosphate-activated TRPC1 channel controls chemotaxis of glioblastoma cells. Cell Calcium 60: 373-383. https://doi:10.1016/j.ceca.2016.09.002
|
| [187] |
Marfia G, Campanella R, Navone SE, et al. (2014) Autocrine/paracrine sphingosine-1-phosphate fuels proliferative and stemness qualities of glioblastoma stem cells. Glia 62: 1968-1981. https://doi:10.1002/glia.22718
|
| [188] |
De Bacco F, Casanova E, Medico E, et al. (2012) The MET oncogene is a functional marker of a glioblastoma stem cell subtype. Cancer Res 72: 4537-4550. https://doi:10.1158/0008-5472.CAN-11-3490
|
| [189] | Joo KM, Jin J, Kim E, et al. (2012) MET signaling regulates glioblastoma stem cells. Cancer Res 72: 3828-3838. https://doi:10.1158/0008-5472.CAN-11-3760 |
| [190] |
Jacques TS, Swales A, Brzozowski MJ, et al. (2010) Combinations of genetic mutations in the adult neural stem cell compartment determine brain tumour phenotypes. EMBO J 29: 222-235. https://doi:10.1038/emboj.2009.327
|
| [191] |
Matarredona ER, Pastor AM (2019) Neural stem cells of the subventricular zone as the origin of human glioblastoma stem cells. Therapeutic implications. Front Oncol 9: 779. https://doi:10.3389/fonc.2019.00779
|
| [192] |
Zhang Y, Cruickshanks N, Yuan F, et al. (2017) Targetable T-type calcium channels drive glioblastoma. Cancer Res 77: 3479-3490. https://doi:10.1158/0008-5472.CAN-16-2347
|
| [193] |
Niklasson M, Maddalo G, Sramkova Z, et al. (2017) Membrane-depolarizing channel blockers induce selective glioma cell death by impairing nutrient transport and unfolded protein/amino acid responses. Cancer Res 77: 1741-1752. https://doi:10.1158/0008-5472.CAN-16-2274
|
| [194] |
Oh MC, Kim JM, Safaee M, et al. (2012) Overexpression of calcium-permeable glutamate receptors in glioblastoma derived brain tumor initiating cells. PLoS One 7: e47846. https://doi:10.1371/journal.pone.0047846
|
| [195] |
Venkataramani V, Tanev DI, Strahle C, et al. (2019) Glutamatergic synaptic input to glioma cells drives brain tumour progression. Nature 573: 532-538. https://doi:10.1038/s41586-019-1564-x
|
| [196] |
Venkatesh HS, Morishita W, Geraghty AC, et al. (2019) Electrical and synaptic integration of glioma into neural circuits. Nature 573: 539-545. https://doi:10.1038/s41586-019-1563-y
|
| [197] |
Spina R, Voss DM, Asnaghi L, et al. (2016) Atracurium besylate and other neuromuscular blocking agents promote astroglial differentiation and deplete glioblastoma stem cells. Oncotarget 7: 459-472. https://doi:10.18632/oncotarget.6314
|
| [198] |
Torres A, Erices JI, Sanchez F, et al. (2019) Extracellular adenosine promotes cell migration/invasion of glioblastoma stem-like cells through A(3) adenosine receptor activation under hypoxia. Cancer Lett 446: 112-122. https://doi:10.1016/j.canlet.2019.01.004
|
| [199] |
D'Alimonte I, Nargi E, Zuccarini M, et al. (2015) Potentiation of temozolomide antitumor effect by purine receptor ligands able to restrain the in vitro growth of human glioblastoma stem cells. Purinergic Signal 11: 331-346. https://doi:10.1007/s11302-015-9454-7
|
| [200] |
Morelli MB, Nabissi M, Amantini C, et al. (2012) The transient receptor potential vanilloid-2 cation channel impairs glioblastoma stem-like cell proliferation and promotes differentiation. Int J Cancer 131: E1067-1077. https://doi:10.1002/ijc.27588
|
| [201] |
Chow KH, Park HJ, George J, et al. (2017) S100A4 is a biomarker and regulator of glioma stem cells that is critical for mesenchymal transition in glioblastoma. Cancer Res 77: 5360-5373. https://doi:10.1158/0008-5472.CAN-17-1294
|
| [202] |
Calinescu AA, Kauss MC, Sultan Z, et al. (2021) Stem cells for the treatment of glioblastoma: a 20-year perspective. CNS Oncol 10: CNS73. https://doi:10.2217/cns-2020-0026
|
| [203] |
Ahmed AS, Sheng MH, Wasnik S, et al. (2017) Effect of aging on stem cells. World J Exp Med 7: 1-10. https://doi:10.5493/wjem.v7.i1.1
|
| [204] |
Ullah M, Sun Z (2018) Stem cells and anti-aging genes: double-edged sword-do the same job of life extension. Stem Cell Res Ther 9: 3. https://doi:10.1186/s13287-017-0746-4
|
| [205] |
Bigarella CL, Liang R, Ghaffari S (2014) Stem cells and the impact of ROS signaling. Development 141: 4206-4218. https://doi:10.1242/dev.107086
|
| [206] |
Ryall JG, Cliff T, Dalton S, et al. (2015) Metabolic reprogramming of stem cell epigenetics. Cell Stem Cell 17: 651-662. https://doi:10.1016/j.stem.2015.11.012
|
| [207] |
Tenchov R, Sasso JM, Wang X, et al. (2024) Aging hallmarks and progression and age-related diseases: a landscape view of research advancement. ACS Chem Neurosci 15: 1-30. https://doi:10.1021/acschemneuro.3c00531
|
| [208] |
Behringer EJ, Segal SS (2017) Impact of aging on calcium signaling and membrane potential in endothelium of resistance arteries: a role for mitochondria. J Gerontol A Biol Sci Med Sci 72: 1627-1637. https://doi:10.1093/gerona/glx079
|
| [209] |
Sukumaran P, Nascimento Da Conceicao V, Sun Y, et al. (2021) Calcium signaling regulates autophagy and apoptosis. Cells 10: 2125. https://doi:10.3390/cells10082125
|
| [210] |
Sharpless NE, DePinho RA (2007) How stem cells age and why this makes us grow old. Nat Rev Mol Cell Biol 8: 703-713. https://doi:10.1038/nrm2241
|
| [211] | Newton AC, Bootman MD, Scott JD (2016) Second messengers. CSH Perspect Biol 8: a005926. https://doi:10.1101/cshperspect.a005926 |
| [212] |
Iino M (2010) Spatiotemporal dynamics of Ca2+ signaling and its physiological roles. Proc Jpn Acad Ser B Phys Biol Sci 86: 244-256. https://doi:10.2183/pjab.86.244
|
| [213] |
Dupont G, Combettes L (2016) Fine tuning of cytosolic Ca2+ oscillations. F1000Res 5: 2036. https://doi:10.12688/f1000research.8438.1
|
| [214] |
Smedler E, Uhlen P (2014) Frequency decoding of calcium oscillations. Biochim Biophys Acta 1840: 964-969. https://doi:10.1016/j.bbagen.2013.11.015
|
| [215] | Ong HL, Ambudkar IS (2020) The endoplasmic reticulum-plasma membrane junction: a hub for agonist regulation of Ca2+ entry. CSH Perspect Biol 12: a035253. https://doi:10.1101/cshperspect.a035253 |
| [216] |
Yoast RE, Emrich SM, Zhang X, et al. (2021) The Mitochondrial Ca2+ uniporter is a central regulator of interorganellar Ca2+ transfer and NFAT activation. J Biol Chem 297: 101174. https://doi:10.1016/j.jbc.2021.101174
|
| [217] |
De Stefani D, Raffaello A, Teardo E, et al. (2011) A forty-kilodalton protein of the inner membrane is the mitochondrial calcium uniporter. Nature 476: 336-340. https://doi:10.1038/nature10230
|
| [218] | Oliveira AG, Guimaraes ES, Andrade LM, et al. (2014) Decoding calcium signaling across the nucleus. Physiology (Bethesda) 29: 361-368. https://doi:10.1152/physiol.00056.2013 |
| [219] |
Kar P, Parekh AB (2015) Distinct spatial Ca2+ signatures selectively activate different NFAT transcription factor isoforms. Mol Cell 58: 232-243. https://doi:10.1016/j.molcel.2015.02.027
|
| [220] |
Bakhshinyan D, Savage N, Salim SK, et al. (2020) The strange case of Jekyll and Hyde: parallels between neural stem cells and glioblastoma-initiating cells. Front Oncol 10: 603738. https://doi:10.3389/fonc.2020.603738
|
| [221] |
Karlstad J, Sun Y, Singh BB (2012) Ca2+ signaling: an outlook on the characterization of Ca2+ channels and their importance in cellular functions. Adv Exp Med Biol 740: 143-157. https://doi:10.1007/978-94-007-2888-2_6
|
| [222] |
Ong HL, Subedi KP, Son GY, et al. (2019) Tuning store-operated calcium entry to modulate Ca2+-dependent physiological processes. Biochim Biophys Acta Mol Cell Res 1866: 1037-1045. https://doi:10.1016/j.bbamcr.2018.11.018
|


Figures(3)

Ola A Al-Ewaidat, Sopiko Gogia, Valiko Begiashvili, Moawiah M Naffaa. The multifaceted role of calcium signaling dynamics in neural cell proliferation and gliomagenesis[J]. AIMS Biophysics, 2024, 11(3): 296-328. doi: 10.3934/biophy.2024017


 DownLoad: