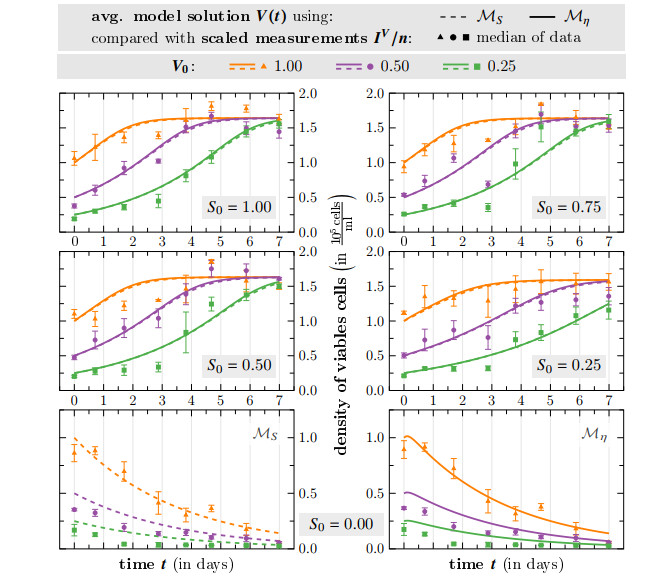
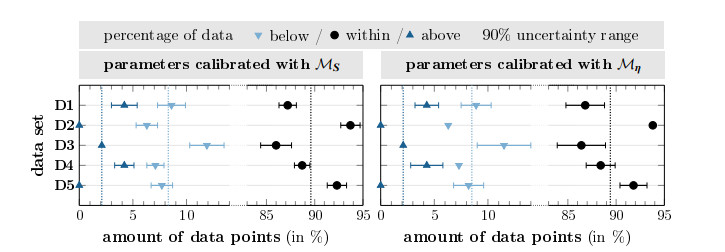
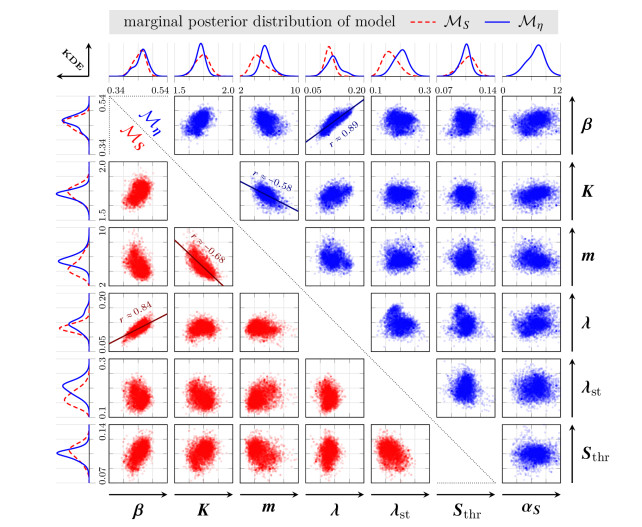
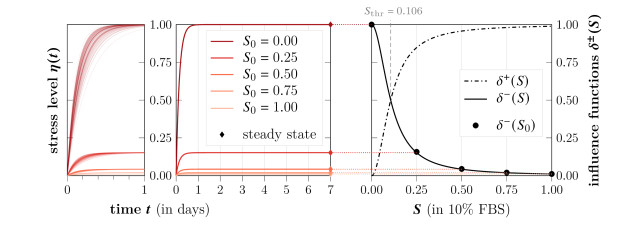
Survival of living tumor cells underlies many influences such as nutrient saturation, oxygen level, drug concentrations or mechanical forces. Data-supported mathematical modeling can be a powerful tool to get a better understanding of cell behavior in different settings. However, under consideration of numerous environmental factors mathematical modeling can get challenging. We present an approach to model the separate influences of each environmental quantity on the cells in a collective manner by introducing the "environmental stress level". It is an immeasurable auxiliary variable, which quantifies to what extent viable cells would get in a stressed state, if exposed to certain conditions. A high stress level can inhibit cell growth, promote cell death and influence cell movement. As a proof of concept, we compare two systems of ordinary differential equations, which model tumor cell dynamics under various nutrient saturations respectively with and without considering an environmental stress level. Particle-based Bayesian inversion methods are used to quantify uncertainties and calibrate unknown model parameters with time resolved measurements of in vitro populations of liver cancer cells. The calibration results of both models are compared and the quality of fit is quantified. While predictions of both models show good agreement with the data, there is indication that the model considering the stress level yields a better fitting. The proposed modeling approach offers a flexible and extendable framework for considering systems with additional environmental factors affecting the cell dynamics.
Citation: Sabrina Schönfeld, Alican Ozkan, Laura Scarabosio, Marissa Nichole Rylander, Christina Kuttler. Environmental stress level to model tumor cell growth and survival[J]. Mathematical Biosciences and Engineering, 2022, 19(6): 5509-5545. doi: 10.3934/mbe.2022258
Survival of living tumor cells underlies many influences such as nutrient saturation, oxygen level, drug concentrations or mechanical forces. Data-supported mathematical modeling can be a powerful tool to get a better understanding of cell behavior in different settings. However, under consideration of numerous environmental factors mathematical modeling can get challenging. We present an approach to model the separate influences of each environmental quantity on the cells in a collective manner by introducing the "environmental stress level". It is an immeasurable auxiliary variable, which quantifies to what extent viable cells would get in a stressed state, if exposed to certain conditions. A high stress level can inhibit cell growth, promote cell death and influence cell movement. As a proof of concept, we compare two systems of ordinary differential equations, which model tumor cell dynamics under various nutrient saturations respectively with and without considering an environmental stress level. Particle-based Bayesian inversion methods are used to quantify uncertainties and calibrate unknown model parameters with time resolved measurements of in vitro populations of liver cancer cells. The calibration results of both models are compared and the quality of fit is quantified. While predictions of both models show good agreement with the data, there is indication that the model considering the stress level yields a better fitting. The proposed modeling approach offers a flexible and extendable framework for considering systems with additional environmental factors affecting the cell dynamics.

| [1] | L. Preziosi (ed.), Cancer Modelling and Simulation, 1$^{st}$ edition, CRC Press, 2003. |
| [2] |
H. Byrne, T. Alarcon, M. Owen, S. Webb, P. Maini, Modelling aspects of cancer dynamics: A review, Philosoph. Transact. Ser. A Math. Phys. Eng. Sci., 364 (2006), 1563–1578. https://doi.org/10.1098/rsta.2006.1786 doi: 10.1098/rsta.2006.1786

|
| [3] |
K. Brindle, New approaches for imaging tumour responses to treatment, Nat. Rev. Cancer, 8 (2008), 94–104. https://doi.org/10.1038/nrc2289 doi: 10.1038/nrc2289
|
| [4] |
D. A. Hormuth, A. M. Jarrett, E. A. B. F. Lima, M. T. McKenna, D. T. Fuentes, T. E. Yankeelov Mechanism-based modeling of tumor growth and treatment response constrained by multiparametric imaging data, JCO Clin. Cancer Inform., 3 (2019), 1–10. https://doi.org/10.1200/CCI.18.00055 doi: 10.1200/CCI.18.00055
|
| [5] |
T. E. Yankeelov, R. G. Abramson, C. C. Quarles, Quantitative multimodality imaging in cancer research and therapy, Nat. Rev. Clin. Oncol., 11 (2014), 670–680. https://doi.org/10.1038/nrclinonc.2014.134 doi: 10.1038/nrclinonc.2014.134
|
| [6] |
C. S. Szot, C. F. Buchanan, J. W. Freeman, M. N. Rylander, 3D in vitro bioengineered tumors based on collagen I hydrogels, Biomaterials, 32 (2011), 7905–7912. https://doi.org/10.1016/j.biomaterials.2011.04.001 doi: 10.1016/j.biomaterials.2011.04.001
|
| [7] |
E. A. B. F. Lima, N. Ghousifam, A. Ozkan, J. T. Oden, A. Shahmoradi, M. N. Rylander, et al., Calibration of multi-parameter models of avascular tumor growth using time resolved microscopy data, Sci. Rep., 8 (2018), 1–14. https://doi.org/10.1038/s41598-018-32347-9 doi: 10.1038/s41598-018-32347-9
|
| [8] | C. P. Robert, G. Casella, G. Casella, Monte Carlo statistical methods, 2$^{nd}$ edition, Springer-Verlag, New York, 2004. https://doi.org/10.1007/978-1-4757-4145-2 |
| [9] |
A. Beskos, A. Jasra, E. A. Muzaffer, A. M. Stuart, Sequential Monte Carlo methods for Bayesian elliptic inverse problems, Stat. Comput., 25 (2015), 727–734. https://doi.org/10.1007/s11222-015-9556-7 doi: 10.1007/s11222-015-9556-7
|
| [10] |
Y. Zhou, A. M. Johansen, J. A. Aston, Toward automatic model comparison: An adaptive sequential Monte Carlo approach, J. Comput. Graph. Statist., 25 (2016), 701–726. https://doi.org/10.1080/10618600.2015.1060885 doi: 10.1080/10618600.2015.1060885
|
| [11] |
R. M. Neal, Annealed importance sampling, Stat. Comput., 11 (2001), 125–139. https://doi.org/10.1023/A:1008923215028 doi: 10.1023/A:1008923215028
|
| [12] |
N. Chopin, A sequential particle filter method for static models, Biometrika, 89 (2002), 539–552. https://doi.org/10.1093/biomet/89.3.539 doi: 10.1093/biomet/89.3.539
|
| [13] |
P. Del Moral, A. Doucet, A.Jasra, Sequential monte carlo samplers, J. Royal Stat. Soc. Ser. B Stat. Methodol., 68 (2006), 411–436. https://doi.org/10.1111/j.1467-9868.2006.00553.x doi: 10.1111/j.1467-9868.2006.00553.x
|
| [14] |
F. Liang, W. H. Wong, Real-parameter evolutionary Monte Carlo with applications to Bayesian mixture models, J. Am. Stat. Assoc., 96 (2001), 653–666. https://doi.org/10.1198/016214501753168325 doi: 10.1198/016214501753168325
|
| [15] |
A. Jasra, D. A. Stephens, C. C. Holmes, On population-based simulation for static inference, Stat. Comput., 17 (2007), 263–279. https://doi.org/10.1007/s11222-007-9028-9 doi: 10.1007/s11222-007-9028-9
|
| [16] |
G. Evensen, The ensemble Kalman filter: Theoretical formulation and practical implementation, Ocean Dynam., 53 (2003), 343–364. https://doi.org/10.1007/s10236-003-0036-9 doi: 10.1007/s10236-003-0036-9
|
| [17] |
C. Schillings, A. M. Stuart, Analysis of the ensemble Kalman filter for inverse problems, SIAM J. Numer. Analys., 55 (2017), 1264–1290. https://doi.org/10.1137/16M105959X doi: 10.1137/16M105959X
|
| [18] |
D. Blömker, C. Schillings, P. Wacker, S. Weissmann, Well posedness and convergence analysis of the ensemble Kalman inversion, Inverse Probl., 35 (2019), 085004. https://doi.org/10.1088/1361-6420/ab149c doi: 10.1088/1361-6420/ab149c
|
| [19] |
F. J. Richards, A flexible growth function for empirical use, J. Exp. Bot., 10 (1959), 290–301. https://doi.org/10.1093/jxb/10.2.290 doi: 10.1093/jxb/10.2.290
|
| [20] |
M. Stoker, H. Rubin, Density dependent inhibition of cell growth in culture, Nature, 215 (1967), 171-–172. https://doi.org/10.1038/215171a0 doi: 10.1038/215171a0
|
| [21] |
G. Aubert, J. F. Aujol, A variational approach to removing multiplicative noise, SIAM J. Appl. Math., 68 (2008), 925–946. https://doi.org/10.1137/060671814 doi: 10.1137/060671814
|
| [22] |
Y. M. Huang, Yu-Mei, M. K. Ng, and Y. W. Wen, A new total variation method for multiplicative noise removal, SIAM J. Imag. Sci., 2 (2009), 20–40. https://doi.org/10.1137/080712593 doi: 10.1137/080712593
|
| [23] |
G. Steidl, T. Teuber, Removing multiplicative noise by Douglas-Rachford splitting methods, J. Math. Imag. Vis., 36 (2010), 168–184. https://doi.org/10.1007/s10851-009-0179-5 doi: 10.1007/s10851-009-0179-5
|
| [24] |
R. Šášik, E. Calvo, J. Corbeil, Statistical analysis of high-density oligonucleotide arrays: a multiplicative noise model, Bioinformatics, 18 (2002), 1633–1640. https://doi.org/10.1093/bioinformatics/18.12.1633 doi: 10.1093/bioinformatics/18.12.1633
|
| [25] |
A. M. Stuart, Inverse problems: A Bayesian perspective, Acta Numer., 19 (2010), 451–559. https://doi.org/10.1017/S0962492910000061 doi: 10.1017/S0962492910000061
|
| [26] |
N. Kantas, A. Beskos, A. Jasra, Sequential Monte Carlo methods for high-dimensional inverse problems: A case study for the Navier–Stokes equations, SIAM/ASA J. Uncertain. Quan., 2 (2014), 464–489. https://doi.org/10.1137/130930364 doi: 10.1137/130930364
|
| [27] | P. Del Moral, Feynman-Kac Formulae, Springer-Verlag, New York, 2004. https://doi.org/10.1007/978-1-4684-9393-1 |
| [28] | M. Bulté, J. Latz, E. Ullmann, A practical example for the non-linear Bayesian filtering of model parameters, in Quantification of Uncertainty: Improving Efficiency and Technology, Springer, Cham, (2020), 241–272. https://doi.org/10.1007/978-3-030-48721-8_11 |
| [29] | H. Haario, E. Saksman, J. Tamminen, An adaptive Metropolis algorithm, Bernoulli, 7 (2001), 223–242. |
| [30] | Build models that drive breakthroughs, Technology Networks, 2018. Available from: https://www.technologynetworks.com/cancer-research/ebooks/build-models-that-drive-breakthroughs-311843. |
| [31] |
K. Wrzesinski, A. Rogowska-Wrzesinska, R. Kanlaya, K. Borkowski, V. Schwämmle, J. Dai, et. al., The cultural divide: Exponential growth in classical 2D and metabolic equilibrium in 3D environments, PloS One, 9 (2014), e106973. https://doi.org/10.1371/journal.pone.0118050 doi: 10.1371/journal.pone.0118050
|
| [32] |
S. Ferson, W. L. Oberkampf, L. Ginzburg, Model validation and predictive capability for the thermal challenge problem, Computer Methods in Applied Mechanics and Engineering, 197 (2008), 2408–2430. https://doi.org/10.1016/j.cma.2004.04.030 doi: 10.1016/j.cma.2004.04.030
|
| [33] | R. E. Kass, A. E. Raftery, Bayes factors, J. Am. Statist. Assoc., 90 (1995), 773–795. https://doi.org/10.1080/01621459.1995.10476572 |
| [34] | O. J. Schmitz, Ecology and ecosystem conservation. Island Press, 2013. |
| [35] | A. Özkan, D. L. Stolley, E. N. Cressman, M. McMillin, S. DeMorrow, T. E. Yankeelov, et. al., Tumor microenvironment alters chemoresistance of hepatocellular carcinoma through CYP3A4 metabolic activity, Front. Oncol., 11 (2021). https://doi.org/10.3389/fonc.2021.662135 |
| [36] |
A. Ozkan, N. Ghousifam, P. J. Hoopes, T. E. Yankeelov, M. N. Rylander, In vitro vascularized liver and tumor tissue microenvironments on a chip for dynamic determination of nanoparticle transport and toxicity, Biotechnol. Bioeng., 116 (2019), 1201–1219. https://doi.org/10.1002/bit.26919 doi: 10.1002/bit.26919
|
| [37] | A. Özkan, D. L. Stolley, E. N. Cressman, M. McMillin, T. E. Yankeelov, M. N. Rylander, CYP3A4 mediates chemoresistance controlled by cirrhosis and inflammation captured in vascularized hepatocellular carcinoma-on-a-chip, Submitted to Small, (2022). |
| [38] |
P. Hartman, A lemma in the theory of structural stability of differential equations, Proceed. Am. Math. Soc., 11 (1960), 610–620. https://doi.org/10.2307/2034720 doi: 10.2307/2034720
|
| [39] | D. M. Grobman, Homeomorphism of systems of differential equations (in Russian), Doklady Akademii Nauk SSSR, 128 (1959), 880–881. |

Figures(10) / Tables(10)

Sabrina Schönfeld, Alican Ozkan, Laura Scarabosio, Marissa Nichole Rylander, Christina Kuttler. Environmental stress level to model tumor cell growth and survival[J]. Mathematical Biosciences and Engineering, 2022, 19(6): 5509-5545. doi: 10.3934/mbe.2022258


 DownLoad: