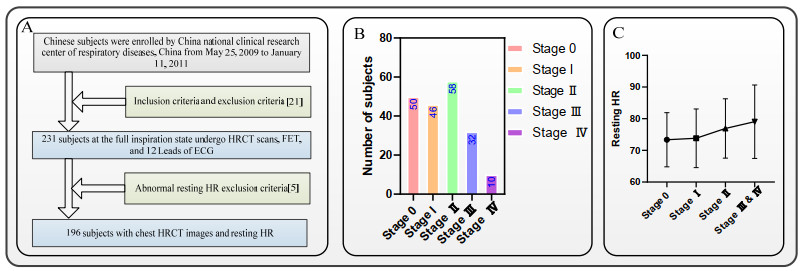
The resting HR is an upward trend with the development of chronic obstructive pulmonary disease (COPD) severity. Chest computed tomography (CT) has been regarded as the most effective modality for characterizing and quantifying COPD. Therefore, CT images should provide more information to analyze the lung and heart relationship. The relationship between HR variability and PFT or/and COPD has been fully revealed, but the relationship between resting HR variability and COPD radiomics features remains unclear. 231 sets of chest high-resolution CT (HRCT) images from "COPD patients" (at risk of COPD and stage I to IV) are segmented by the trained lung region segmentation model (ResU-Net). Based on the chest HRCT images and lung segmentation images, 231 sets of the original lung parenchyma images are obtained. 1316 COPD radiomics features of each subject are calculated by the original lung parenchyma images and its derived lung parenchyma images. The 13 selected COPD radiomics features related to the resting HR are generated from the Lasso model. A COPD radiomics features combination strategy is proposed to satisfy the significant change of the lung radiomics feature among the different COPD stages. Results show no significance between COPD stage Ⅰ and COPD stage Ⅱ of the 13 selected COPD radiomics features, and the lung radiomics feature Y1-Y4 (P > 0.05). The lung radiomics feature F2 with the dominant selected COPD radiomics features based on the proposed COPD radiomics features combination significantly increases with the development of COPD stages (P < 0.05). It is concluded that the lung radiomics feature F2 with the dominant selected COPD radiomics features not only can characterize the resting HR but also can characterize the COPD stage evolution.
Citation: Yingjian Yang, Wei Li, Yan Kang, Yingwei Guo, Kai Yang, Qiang Li, Yang Liu, Chaoran Yang, Rongchang Chen, Huai Chen, Xian Li, Lei Cheng. A novel lung radiomics feature for characterizing resting heart rate and COPD stage evolution based on radiomics feature combination strategy[J]. Mathematical Biosciences and Engineering, 2022, 19(4): 4145-4165. doi: 10.3934/mbe.2022191
The resting HR is an upward trend with the development of chronic obstructive pulmonary disease (COPD) severity. Chest computed tomography (CT) has been regarded as the most effective modality for characterizing and quantifying COPD. Therefore, CT images should provide more information to analyze the lung and heart relationship. The relationship between HR variability and PFT or/and COPD has been fully revealed, but the relationship between resting HR variability and COPD radiomics features remains unclear. 231 sets of chest high-resolution CT (HRCT) images from "COPD patients" (at risk of COPD and stage I to IV) are segmented by the trained lung region segmentation model (ResU-Net). Based on the chest HRCT images and lung segmentation images, 231 sets of the original lung parenchyma images are obtained. 1316 COPD radiomics features of each subject are calculated by the original lung parenchyma images and its derived lung parenchyma images. The 13 selected COPD radiomics features related to the resting HR are generated from the Lasso model. A COPD radiomics features combination strategy is proposed to satisfy the significant change of the lung radiomics feature among the different COPD stages. Results show no significance between COPD stage Ⅰ and COPD stage Ⅱ of the 13 selected COPD radiomics features, and the lung radiomics feature Y1-Y4 (P > 0.05). The lung radiomics feature F2 with the dominant selected COPD radiomics features based on the proposed COPD radiomics features combination significantly increases with the development of COPD stages (P < 0.05). It is concluded that the lung radiomics feature F2 with the dominant selected COPD radiomics features not only can characterize the resting HR but also can characterize the COPD stage evolution.

| [1] |
C. A. Camillo, F. Pitta, H. V. Possani, M. V. R. A. Barbosa, D. S. O. Marques, V. Cavalheri, et al., Heart rate variability and disease characteristics in patients with COPD, Lung, 186 (2008), 393-401. https://doi.org/10.1007/s00408-008-9105-7 doi: 10.1007/s00408-008-9105-7

|
| [2] |
D. Singh, A. Agusti, A. Anzueto, P. J. Barnes, J. Bourbeau, B. R. Celli, et al., Global strategy for the diagnosis, management, and prevention of chronic obstructive lung disease: the GOLD science committee report 2019, Eur. Respir. J., (2019), 1900164. https://doi.org/10.1183/13993003.00164-2019 doi: 10.1183/13993003.00164-2019
|
| [3] |
M. C. Matheson, G. Bowatte, J. L. Perret, A. J. Lowe, C. V. Senaratna, G. L. Hall, et al., Prediction models for the development of COPD: a systematic review, Int. J. Chronic Obstr. Pulm. Dis., 13 (2018), 1927-1935. https://doi.org/10.2147/COPD.S155675 doi: 10.2147/COPD.S155675
|
| [4] |
M. J. Lewis, J. Annandale, K. E. Lewis, Influence of long-term oxygen therapy on heart rate and QT time-series in hypoxic patients with chronic obstructive pulmonary disease, Clin. Physiol. Funct. Imaging, 31 (2010), 431-439. https://doi.org/10.1111/j.1475-097X.2009.00891.x doi: 10.1111/j.1475-097X.2009.00891.x
|
| [5] |
M. T. Jensen, J. L. Marott, P. Lange, J. Vestbo, P. Schnohr, O. W. Nielsen, et al., Resting heart rate is a predictor of mortality in chronic obstructive pulmonary disease, Eur. Respir. J., 42 (2013), 341-349. https://doi.org/10.1183/09031936.00072212 doi: 10.1183/09031936.00072212
|
| [6] | GOLD 2021: Global initiative for chronic obstructive lung disease, 2021. |
| [7] |
A. A. de Camargo, T. Justino, C. H. S. de Andrade, C. Malaguti, S. D. Corso, Chester step test in patients with copd: reliability and correlation with pulmonary function test results, Resp. Care, 56 (2011), 995-1001. https://doi.org/10.4187/respcare.01047 doi: 10.4187/respcare.01047
|
| [8] |
S. T. Cheng, Y. K. Wu, M. C. Yang, C. Y. Huang, H. C. Huang, W. H. Chu, et al., Pulmonary rehabilitation improves heart rate variability at peak exercise, exercise capacity and health-related quality of life in chronic obstructive pulmonary disease, Heart Lung, 43 (2014), 249-255. https://doi.org/10.1016/j.hrtlng.2014.03.002 doi: 10.1016/j.hrtlng.2014.03.002
|
| [9] |
N. F. Serrão, A. Porta, V. Minatel, A. A. M. Castro, A. Borghi-Silva, Complexity analysis of heart rate variability in chronic obstructive pulmonary disease: relationship with severity and symptoms, Clin. Auton. Res., 30 (2020), 1-8. https://doi.org/10.1007/s10286-019-00659-z doi: 10.1007/s10286-019-00656-2
|
| [10] |
P. F. Camargo, L. Ditomaso-Luporini, L. C. S. de Carvalho Jr, C. da Luz Goulart, R. Sebold, P. B. Dos Santos, et al., Association between the predictors of functional capacity and heart rate off-kinetics in patients with chronic obstructive pulmonary disease, Int. J. Chronic Obstr. Pulm. Dis., 15 (2020), 1977-1986. https://doi.org/10.2147/COPD.S260284 doi: 10.2147/COPD.S260284
|
| [11] |
P. K. Stein, P. Nelson, J. N. Rottman, D. Howard, S. M. Ward, R. E. Kleiger, et al., Heart rate variability reflects severity of COPD in PiZ α1-Antitrypsin deficiency, Chest, 113 (1998), 327-333. https://doi.org/10.1378/chest.113.2.327 doi: 10.1378/chest.113.2.327
|
| [12] |
L. Josephs, D. Culliford, M. Johnson, M. Thomas, COPD overdiagnosis in primary care: a UK observational study of consistency of airflow obstruction, NPJ Prim. Care Resp. Med., 29 (1998), 1-9. https://doi.org/10.1038/s41533-019-0145-7 doi: 10.1038/s41533-019-0145-7
|
| [13] |
R. Onoe, T. Yamashiro, H. Hiroshi, S. Azagami, S. Matsuoka, T. Inoue, et al., 3D-measurement of tracheobronchial angles on inspiratory and expiratory chest CT in COPD: respiratory changes and correlation with airflow limitation, Int. J. Chronic Obstr. Pulm. Dis, 13 (2018), 2399-2407. https://doi.org/10.2147/COPD.S165824 doi: 10.2147/COPD.S165824
|
| [14] |
Q. Li, L. Chen, X. Li, X. Lv, S. Xia, Y. Kang, PRF-RW: a progressive random forest-based random walk approach for interactive semi-automated pulmonary lobes segmentation, Int. J. Mach. Learn. Cyb., 11 (2020), 2221-2235. https://doi.org/10.1007/s13042-020-01111-9 doi: 10.1007/s13042-020-01111-9
|
| [15] |
Y. Ohno, K. Aoyagi, D. Takenaka, T. Yoshikawa, A. Ikezaki, Y. Fujisawa, et al., Machine learning for lung CT texture analysis: improvement of inter-observer agreement for radiological finding classification in patients with pulmonary diseases, Eur. J. Radiol., 134, (2021), 109410. https://doi.org/10.1016/j.ejrad.2020.109410 doi: 10.1016/j.ejrad.2020.109410
|
| [16] |
D. A. Lynch, Progress in imaging COPD, 2004-2014, Chronic Obstr. Pulm. Dis. J. COPD Found., 1 (2014), 73-82. https://doi.org/10.15326/jcopdf.1.1.2014.0125 doi: 10.15326/jcopdf.1.1.2014.0125
|
| [17] |
M. Occhipinti, M. Paoletti, B. J. Bartholmai, S. Rajagopalan, R. A. Karwoski, C. Nardi, et al., Spirometric assessment of emphysema presence and severity as measured by quantitative CT and CT-based radiomics in COPD, Respir. Res., 20 (2019), 1-11. https://doi.org/10.1186/s12931-019-1049-3 doi: 10.1186/s12931-018-0967-9
|
| [18] |
G, Wu, A. Ibrahim, I. Halilaj, R. T. Leijenaar, W. Rogers, H. A. Gietema, et al., The emerging role of radiomics in COPD and lung cancer, Respiration, 99 (2020), 99-107. https://doi.org/10.1159/000505429 doi: 10.1159/000505429
|
| [19] |
A. Wheeler, A. Zanobetti, D. R. Gold, J. Schwartz, P. Stone, H. H. Suh, The relationship between ambient air pollution and heart rate variability differs for individuals with heart and pulmonary disease, Environ. Health Persp., 114 (2006), 560-566. https://doi.org/10.1289/ehp.8337 doi: 10.1289/ehp.8337
|
| [20] |
M. S. Bianchim, E. F. Sperandio, G. S. Martinhao, A. C. Matheus, V. T. Lauria, R. P. Da Silva, et al., Correlation between heart rate variability and pulmonary function adjusted by confounding factors in healthy adults, Braz. J. Med. Biol. Res., 49 (2016), 1-7. https://doi.org/10.1590/1414-431X20154435 doi: 10.1590/1414-431X20154435
|
| [21] |
Y. Zhou, P. L. Bruijnzeel, C. Mccrae, J. Zheng, U. Nihlen, R. Zhou, et al., Study on risk factors and phenotypes of acute exacerbations of chronic obstructive pulmonary disease in Guangzhou, China-design and baseline characteristics, J. Thorac. Dis. 7 (2015), 720-733. https://doi.org/10.3978/j.issn.2072-1439.2015.04.14 doi: 10.3978/j.issn.2072-1439.2015.04.14
|
| [22] | O. Ronneberger, P. Fischer, T. Brox, U-Net: Convolutional Networks for Biomedical Image Segmentation, in International Conference on Medical Image Computing and Computer-Assisted Intervention, (2015), 234-241. https://doi.org/10.1007/978-3-319-24574-4_28 |
| [23] |
C. Cho, Y. H. Lee, J. Park, S. Lee, A self-spatial adaptive weighting based u-net for image segmentation, Electronics, 10 (2021), 348-359. https://doi.org/10.3390/electronics10030348 doi: 10.3390/electronics10030348
|
| [24] | P. J. R. Prasad, O. J. Elle, F. Lindseth, F. Albregtsen, R. P. Kumar, Modifying u-net for small dataset: a simplified u-net version for liver parenchyma segmentation, in Medical Imaging 2021: Computer-Aided Diagnosis, International Society for Optics and Photonics, 2021, 11579 (2021). https://doi.org/10.1117/12.2582179 |
| [25] |
M. Ullah, A. Mohammed, F. Alaya Cheikh, PedNet: A spatio-temporal deep convolutional neural network for pedestrian segmentation, J. Imag., 4 (2018), 107-125. https://doi.org/10.3390/jimaging4090107 doi: 10.3390/jimaging4090107
|
| [26] |
Z. A. Khan, A. Beghdadi, M. Kaaniche, F. A. Cheikh, Residual networks based distortion classification and ranking for laparoscopic image quality assessment, in 2020 IEEE International Conference on Image Processing (ICIP), (2021), 176-180. https://doi.org/10.1109/ICIP40778.2020.9191111 doi: 10.1109/ICIP40778.2020.9191111
|
| [27] |
J. Hofmanninger, F. Prayer, J. Pan, S. Rohrich, H. Prosch, G. Langs, Automatic lung segmentation in routine imaging is a data diversity problem, not a methodology problem, Eur. Rad. Exp., 4 (2020), 1-13. https://doi.org/10.1186/s41747-020-00173-2 doi: 10.1186/s41747-019-0127-0
|
| [28] |
Y. Yang, Q. Li, Y. Guo, Y. Liu, X. Li, J. Guo, et al., Lung parenchyma parameters measure of rats from pulmonary window computed tomography images based on ResU-Net model for medical respiratory researches, Math. Biosci. Eng., 18 (2021), 4193-4211. https://doi.org/10.3934/mbe.2021210 doi: 10.3934/mbe.2021210
|
| [29] | Y. Yang, Y. Guo, J. Guo, Y. Gao, Y. Kang, A method of abstracting single pulmonary lobe from computed tomography pulmonary images for locating COPD, in Proceedings of the Fourth International Conference on Biological Information and Biomedical Engineering, (2020), 1-6. https://doi.org/10.1145/3403782.3403805 |
| [30] |
G. Z. Yang, D. M. Hansell, CT image enhancement with wavelet analysis for the detection of small airways disease, IEEE Trans. Med. Imaging, 16 (1997), 953-961. https://doi.org/10.1109/42.650893 doi: 10.1109/42.650893
|
| [31] |
S. S. Birring, M. D. Peake, Symptoms and the early diagnosis of lung cancer, Thorax, 60 (2005), 268-269. https://doi.org/10.1136/thx.2004.032698 doi: 10.1136/thx.2004.032698
|
| [32] |
F. Neycenssac, Contrast enhancement using the laplacian-of-a-gaussian filter, CVGIP: Graph. Models Image Process., 55 (1993), 447-463. https://doi.org/10.1006/cgip.1993.1034 doi: 10.1006/cgip.1993.1034
|
| [33] | Z. Shi, J. Bai, L. He, T. Nakamura, Q. Yao, H. Itoh, et al., A method for enhancing lung nodules in chest radiographs by use of LoG Filter, in 2009 2nd International Congress on Image and Signal Processing, (2009), 1-4. https://doi.org/10.1109/CISP.2009.5301319 |
| [34] |
J. J. van Griethuysen, A. Fedorov, C. Parmar, A. Hosny, N. Aucoin, V. Narayan, et al., Computational radiomics system to decode the radiographic phenotype, Cancer Res., 77 (2017), 104-107. https://doi.org/10.1158/0008-5472.CAN-17-0339 doi: 10.1158/0008-5472.CAN-17-0339
|
| [35] |
R. Tibshirani, Regression shrinkage and selection via the Lasso Robert Tibshirani, J. Roy. Stat. Soc. Series B (Stat. Methodol.), 58 (2007), 267-288. https://doi.org/10.1111/j.2517-6161.1996.tb02080.x doi: 10.1111/j.2517-6161.1996.tb02080.x
|
| [36] |
N. Simon, J. Friedman, T. Hastie, R. Tibshirani, Regularization paths for Cox's proportional hazards model via coordinate descent, J. Stat. Softw., 39 (2011), 1-13. https://doi.org/10.18637/jss.v039.i05 doi: 10.18637/jss.v039.i05
|


Figures(9) / Tables(5)

Yingjian Yang, Wei Li, Yan Kang, Yingwei Guo, Kai Yang, Qiang Li, Yang Liu, Chaoran Yang, Rongchang Chen, Huai Chen, Xian Li, Lei Cheng. A novel lung radiomics feature for characterizing resting heart rate and COPD stage evolution based on radiomics feature combination strategy[J]. Mathematical Biosciences and Engineering, 2022, 19(4): 4145-4165. doi: 10.3934/mbe.2022191


 DownLoad: