


Citation: Bashar Ibrahim. Mathematical analysis and modeling of DNA segregation mechanisms[J]. Mathematical Biosciences and Engineering, 2018, 15(2): 429-440. doi: 10.3934/mbe.2018019
| [1] | Maria Vittoria Barbarossa, Christina Kuttler, Jonathan Zinsl . Delay equations modeling the effects of phase-specific drugs and immunotherapy on proliferating tumor cells. Mathematical Biosciences and Engineering, 2012, 9(2): 241-257. doi: 10.3934/mbe.2012.9.241 |
| [2] | Jin Liu, Fan Zhang, Aleksey Kudreyko, Wenjia Ren, Haima Yang . Novel laser tracking measurement system based on the position sensitive detector. Mathematical Biosciences and Engineering, 2023, 20(1): 572-586. doi: 10.3934/mbe.2023026 |
| [3] | Hal L. Smith . Tribute to Horst R. Thieme on the occasion of his 60th birthday. Mathematical Biosciences and Engineering, 2010, 7(1): i-iii. doi: 10.3934/mbe.2010.7.1i |
| [4] | Zhangli Peng, Andrew Resnick, Y.-N. Young . Primary cilium: a paradigm for integrating mathematical modeling with experiments and numerical simulations in mechanobiology. Mathematical Biosciences and Engineering, 2021, 18(2): 1215-1237. doi: 10.3934/mbe.2021066 |
| [5] | Benjamin Steinberg, Yuqing Wang, Huaxiong Huang, Robert M. Miura . Spatial Buffering Mechanism: Mathematical Model and Computer Simulations. Mathematical Biosciences and Engineering, 2005, 2(4): 675-702. doi: 10.3934/mbe.2005.2.675 |
| [6] | Yuewu Liu, Yan Peng . Mathematical analysis of synthesis chemical reactions for virus building block polymers in vivo. Mathematical Biosciences and Engineering, 2024, 21(6): 6393-6406. doi: 10.3934/mbe.2024279 |
| [7] | Bin Ma, Lianqun Cao, Yongmin Li . A novel 10-gene immune-related lncRNA signature model for the prognosis of colorectal cancer. Mathematical Biosciences and Engineering, 2021, 18(6): 9743-9760. doi: 10.3934/mbe.2021477 |
| [8] | Ana I. Muñoz, José Ignacio Tello . Mathematical analysis and numerical simulation of a model of morphogenesis. Mathematical Biosciences and Engineering, 2011, 8(4): 1035-1059. doi: 10.3934/mbe.2011.8.1035 |
| [9] | Janine Egert, Clemens Kreutz . Realistic simulation of time-course measurements in systems biology. Mathematical Biosciences and Engineering, 2023, 20(6): 10570-10589. doi: 10.3934/mbe.2023467 |
| [10] | Qian Li, Yanni Xiao . Analysis of a mathematical model with nonlinear susceptibles-guided interventions. Mathematical Biosciences and Engineering, 2019, 16(5): 5551-5583. doi: 10.3934/mbe.2019276 |
DNA segregation is a complicated process that is critical for cell proliferation and survival [16,30]. Failures during segregation can result in aberrant DNA contents (aneuploidy), a phenomenon which is prevalent in human cancers [24,28]. The fidelity of chromosome segregation during cell division is monitored by control mechanisms called checkpoints, which ensure that particular criteria are met before moving on irreversibly to the next phase [30].
In mitosis, the Spindle Assembly Checkpoint (SAC; [33]) ensures that all chromosomes are properly attached to spindle microtubules via their kinetochores. Even a single unattached or misattached chromosome is sufficient to keep the checkpoint active and engaged [32,31]. (A human mitotic cell has 46 chromosomes and 92 kinetochores.) In budding yeast (Saccharomyces cerevisiae and Drosophila male), an additional control checkpoint exists to place the correct DNA into the right cell during asymmetric cell division. This regulation is known as the Spindle Position Checkpoint (SPOC), and delays mitotic progression until the spindle is correctly aligned along with the polarity axis [2].
Both SAC and SPOC have prominent similarities, although they constitute different mitotic checkpoints. They broadcast a 'wait' signal to the environment, and rely on turnover of the inhibitor and activator at an organelle (kinetochore for SAC and spindle pole body in SPOC). The SAC integrates signaling information about attachment of the individual kinetochores, which broadcast a 'wait'-signal unless a correct attachment is established. Many core SAC components like Mad2 are recruited to unattached kinetochores, and broadcast a nucleoplasm 'wait'-signal and inhibit Cdc20, the APC/C activator. Upon kinetochore-microtubule attachment, these components are rapidly removed from the kinetochores and APC/C:Cdc20 formation (SAC silencing) is turned on (see Fig. 1A). Similarly, central SPOC components Bf1:Bub2 are localized and regulated at the spindle pole bodies (SPBs), which are broadcasted through out the cytosol and inhibit the downstream pathway, Tem1. Signaling from the SPBs is shut down after correct spindle alignment with the polarity axis is achieved (see Fig. 1B).
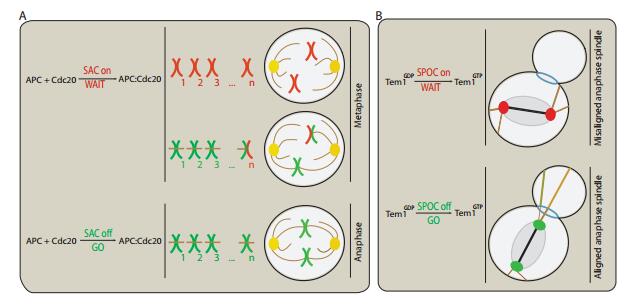 Figure 1. Schematics illustrating the intracellular signaling of mitotic transition control mechanisms. (A) Dependency of spindle assembly checkpoint signaling on microtubule attachment. Kinetochores which are not attached to the spindle apparatus generate a 'wait'-signal. Chemically SAC precludes the mitotic progression by inhibiting the activation of APC/C, presumably through sequestration of the APC/C-activator Cdc20. Even a single unattached or misattached kinetochore can maintain the spindle checkpoint. If all kinetochores are correctly attached from opposite poles to the mitotic spindle, SAC is turned off and APC/C:Cdc20 formation is turned on. Paired chromosomes are held together by protein complexes called cohesin, which is depredated by active APC/C:Cdc20 complexes.
 The checkpoint mechanisms, SAC and SPOC, are hard to observe experimentally in living cells, due to a number of technical challenges. For example, even a low number of components can have various localizations and states upon which the interactions depend. Another issue is that the average diameter of many proteins at the kinetochore is about 40Å, making connections between them invisible to current microscopy techniques. Likewise, the SPOC protein Tem1 activity, whether it is GTP-or GDP-bound, and Bfa1 protein phosphorylation by various kinases (or lack thereof), are not observable in the wet lab. These limitations can be addressed by employing mathematical models and numerical simulations, which can improve our understanding of the mechanics of cell division. However, mathematical methods can be hindered by combinatorial explosion in the amount of intermediate components (complexes) and explicit representations. Also, the different components often interact nonlinearly in time and space; in the presence of various feedback loops, these interactions lead to phenomena that are difficult to predict [10,0,25,11,38]. A combination of experimental work and rigorous mathematical models was central to exclude some hypothesized SAC checkpoint architectures and to elucidate how the SPOC's elaborate system functions (e.g. [4]). All mathematical models extant in the literature studied either human SAC or yeast SPOC activation at a detailed molecular level or in abstract models to distinguish between different pathways [7,34,14,13,15,21,26,19,9,0,18,23,27,29]. However, none of these models addressed SAC or SPOC silencing. Moreover, no rigorous mathematical analysis of properties such as bifurcation, stability, or the existence of feedback loops has been performed for either SAC or SPOC to date. The research groups of Novak and Tyson work intensively on cell cycle-related modeling for yeast. Their recent small model consists of five reactions, five species, and two ODEs based on Michaelis-Menten kinetics with double-negative and two double-positive feedback loops[39]. Also, the smallest chemical reaction system with bistability in the literature contains four reactions, and two ODEs based on mass-action kinetics [41]. It has double positive and a single negative feedback loops. Unfortunately, no regeneration for the reactants is possible in this model.
The purpose of this paper is fourfold. First, a minimal bistable SAC model for activation and silencing was constructed. The model is based on mass-action kinetics and comprises four reactions, double-negative and two double-positive feedback loops, and two ODEs. It is structurally fully distinct to the known smallest biochemical model [41] and structurally comparable to the yeast mitotic model [39,17]. Second, the same model structure was applied to the SPOC, with both SPBs included. Subsequently, a one-parameter bifurcation was computed for these models, in order to demonstrate the realistic biochemical switches. Eventually, numerical simulations were carried out for the system as a system of ordinary differential equations (ODEs), and also as partial differential equations (PDEs; reaction-diffusion systems) with various parameters.
The reaction rules governing the Spindle Assembly Checkpoint (SAC) system are (cf. Fig. 2A):
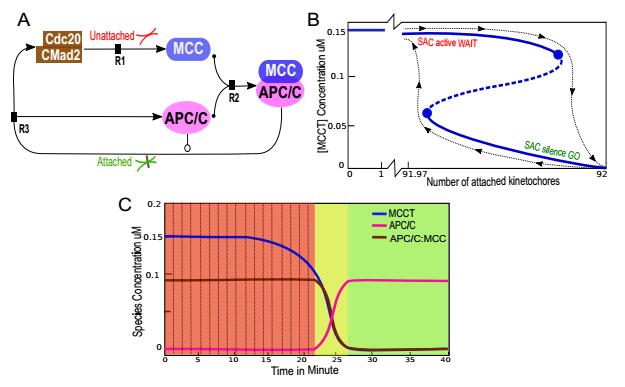 Figure 2. Spindle Assembly Checkpoint (SAC) model set-up and analysis of all 92 kinetochores. (A) Schematic representation of the biochemical reaction network of the SAC mechanism. SAC proteins/complexes are shown as nodes, and the interactions between them as edges. Abbreviations are APC/C, anaphase promoting complex/cyclosome; Cdc20, cell division cycle 20 homolog and MCC, Mitotic Checkpoint Complex. Unattached kinetochores enhance the production of the mitotic checkpoint complex (MCC) consisting of BubR1, Bub3, Mad2, and Cdc20. Eventually, MCC binds tightly to and inhibits the APC/C in a manner preventing Cdc20 from interacting with mitotic APC/C. Immediately after the last kinetochore attachment to microtubules, the inhibitors dissolve, eventually resulting in active APC/C. This reactivation process is known as SAC silencing, where APC/C plays a role in its feedback loop. (B) Single parameter bifurcation curve. Shown is the number of attached kinetochores versus the total concentration of the MCC inhibitor. Stable node points and stable steady states are indicated by solid lines, while unstable saddle points are shown by dashed lines. Stable and unstable steady states meet at saddle-node bifurcation points, indicated by solid circles. When the number of attached kinetochore raises above approximately 91.98, the SAC checkpoint disengages and APC/C is activated. As the cell enters anaphase, MCC lowers back to zero. The black dashed line explains how the switch flips from the SAC-active state to the SAC-inactive state as the number of attached kinetochores increase. The number of attached kinetochores in the cell determines whether MCC activity is high (SAC active state) or low (SAC silence state). The bifurcation curve can be shifted to left or right depending on the values of
 | |
|
|
||
| Initial amount | ||||
| APC/C | 0.09 |
[37] | ||
| MCC | 0.15 |
[15] | ||
| Tem1 | 0.06 |
[4] | ||
| Bfa1 | 0.04 |
[4] | ||
| Bub2 | 0.04 |
[4] | ||
| Diffusion constants | ||||
| MCC | 1-20 |
This study | ||
| APC/C | 1.8 |
[40] | ||
| Cdc20 | 19.5 |
[40] | ||
| Mad2 | 5 |
[13] | ||
| Environment | ||||
| Radius of the kinetochore | 0.1 |
0.01 |
[5] | |
| Radius of the cell | 10 |
4 |
[21] | |
| Rate constants | ||||
| kinetochores or SPBs | 0-92 | 0-2 | [16] | |
| |
|
This study | ||
| |
|
This study | ||
| |
|
This study | ||
| |
|
This study |
 DownLoad: CSV
| Cdc20:C-Mad2k1,Unattached Kin →MCC | (1) |
| MCC+APC/Ck2⇌k−2MCC:APC/C | (2) |
| MCC:APC/C k3,Attached Kin,APC/C→Cdc20:C-Mad2+APC/C | (3) |
The Spindle Position Checkpoint mechanism (SPOC) has very similar reaction rules (see below), but differs significantly in the initial concentrations, rate contacts, and signals of exactly two SPBs (cf. Fig. 4A):
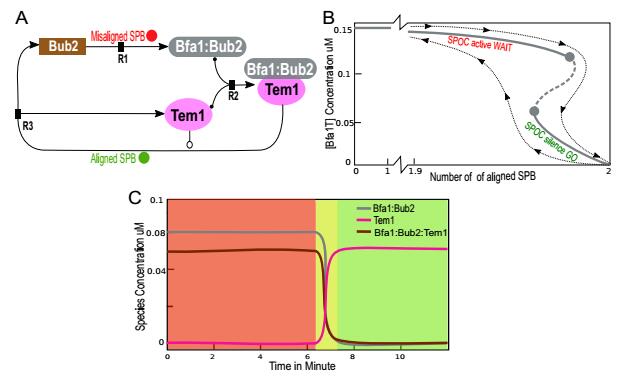 Figure 4. Spindle Position Checkpoint model with both SPBs signals. (A) The biochemical reactions governing the SPOC mechanism. Shown are SPOC proteins/complexes and the interactions between them. Abbreviations are (see for details [2,3]): BUB2, budding uninhibited by benomyl; BFA1, byrfour-alike-1; SPB, spindle pole body; and Tem1, Ras-like GTPase. (B) SPOC bifurcation curve, parameterized as the number of aligned SPBs versus the total concentration of the Bfa1:Bub2:Tem1. Unstable saddle points are shown by dashed lines, and stable node point steady states are indicated by solid lines. As the number of aligned SPBs increases above approximately 1.99 (about to be both correctly aligned), the SPOC checkpoint switches off. As the cell finalizes anaphase with both SPBs aligned, Tem1 activity becomes high and Bfa1:Bub2 becomes inactive. The black dashed line represents how the switch flips from the SPOC-active state to the SPOC-inactive state as the number of aligned SPBs increase. The bifurcation curve is sensitive to some parameters, and it can be very slightly shifted to left or right. (C) Numerical simulations of SPOC model. Dynamical behavior is very similar qualitatively but not quantitatively to that of the SAC model. The concentrations are drawn versus time. Tem1 concentration is kept low, as long as the SPBs are not aligned. After about 7 minutes, SPOC switches off and Tem1 is rapidly activated. Meanwhile, Bfa1 curve displays a steep downwards trend. All parameter settings are according to Table 1.
| Bub2k1,misaligned SPB →Bfa1:Bub2 | (4) |
| Bfa1:bub2+Tem1k2⇌k−2Bfa1:Bub2:Tem1 | (5) |
| Bfa1:Bub2:Tem1 k3,aligned SPB,Tem1→Bub2+Tem1 | (6) |
By applying the law of mass-action kinetics, the reaction rules (Eqs.(1-3) and Eqs.4-6) can be translated into sets of time-dependent nonlinear ordinary differential equations (ODEs). The translation is done by computing
Adding a diffusion term as a second spatial derivative transforms the system into one of coupled partial differential equations (PDEs), which is known as a reaction-diffusion system and has the following general form:
| ∂[Ci]∂t=Di∇2[Ci]⏟Diffusion+Rj({[Ci]};P)⏟Reaction, | (7) |
where
| ∂[Ci]∂t=Dir2∂∂r(r2∂[Ci]∂r)⏟Diffusion+Rj({[Ci]};P)⏟Reaction. | (8) |
The systems of ODEs were implemented in the freely-available software package XPPAUT[8], and integrated using the Rosenbrock method (stiff solver). The bifurcation analyzes and the related numerical integrations were conducted with AUTO [6] via an XPPAUT interface.
For the spatial simulations, the mitotic cell is considered as a 3-sphere with radius
The reaction-diffusion system of PDEs were solved numerically using MATLAB (MathWorks), and integrated using its predefined function called pdepe-solver, which solves systems of parabolic and elliptic PDEs in one space variable
The pdepe-solver converts the PDEs to ODEs using a second-order accurate spatial discretization based on a fixed set of user-specified nodes [36]. This is done using piecewise non-linear Galerkin (regular case) and implicit Petrov-Galerkin (singular case, second-order accurate). The ordinary differential equations resulting from discretization in space are integrated via the multistep solver ode15s which is a variable order solver based on the numerical differentiation formulas (NDFs)using the numerical Gear method [35]. To check that our results were not influenced by the spatial discretization method used in pdepe, we repeated all simulations for 50,100 and 1000 grid cells.
The wiring diagram of the SAC mechanism (Fig. 2A) was translated into a set of reaction equations (see Methods), which were then translated into a set of coupled ordinary differential equations (ODEs) under the assumption of mass action kinetics for all reactions. It is clear biochemically that the total concentration of Cdc20:Mad2 is constant in the system and can be expressed as [Cdc0:CMad2T] = [Cdc20:CMad2] + [MCC] + [MCC:APC/C]. The same is true for total APC/C, thus [APC/CT] = [APC/C] + [MCC:APC/C]. Also, for simplicity, the total amount of MCC was defined as: [MCCT]=[MCC]+[MCC: APC/C]. Under these assumptions, the reduced system can be easily written as the following nonlinear ODEs:
| d[MCCT]dt=k1.U([MadT]−[MCCT])−k3.A[APC][MCC:APC/C]) | (9) |
| d[APC/C]dt=−k2[MCC][APC/C]+(k−2+A[APC])[MCC:APC/C] | (10) |
The parameter
| d[MCCT]dt=k1.U([MadT]−[MCCT])−k3.A([APC/CT]-[MCC:APC/C])[MCC:APC/C]) | (11) |
| a.[MCC:APC/C]2+b.[MCC:APC/C]+c=0 | (12) |
where the parameters
First, one-parameter bifurcation analysis was performed for the nonlinear system (Eq. 11 and 16). The aim is to demonstrate the bistable switch states influencing total MCC, while kinetochores are gradually attached. The simulations were conducted using AUTO software (see Methods). The results in Fig. 2B display a typical S-shape, representing the number of attached kinetochores versus the total concentration of the MCC inhibitor. The stable node points for steady states are shown in solid lines and the unstable saddle points are depicted with dashed lines. Stable and unstable steady states meet at saddle-node bifurcation points, which are indicated by solid circles. At the attached kinetochore number (91.98, i.e. nearly all), the SAC checkpoint switched off and APC/C activated rapidly. The total MCC lowers back to zero as the cell enters anaphase. The switch flipping from the SAC-active state to the SAC-inactive state as the number of attached kinetochores raises is indicated by a black dashed line. Slight movements of the bifurcation curve to the left or right are possible, depending on the values of the parameters
Additionally, the dynamics as the change of concentrations over time were simulated and plotted (Fig. 2C) using XPPAUT (see Methods). The concentration of the APC/C component (Fig. 2C pink line) remains very low, as long as no kinetochores are attached. After approximately 25 minutes, the APC/C activity increases quickly to reach its maximum. This result is consistent with the experimental findings reported in the literature [1,27]. The inhibitor complexes MCC:APC/C that sequester APC/C display exactly the opposite behaviors compared to APC/C (Fig. 2C, brown line). MCC concentration behaves similarly to MCC:APC/C with respect to the difference in the initial amount (Fig. 2C, blue line).
Also interesting is the effect of the diffusion coefficient on the SAC system, particularly since the MCC diffusion constant is unknown. To investigate this, a second-derivative diffusion term was added to the original system (Eq.10-Eq.9). The resulting system of coupled PDEs is known as a reaction-diffusion system:
| d[MCCT]dt=Dr2∂∂r(r2∂[MCCT]∂r)+k1.U([MadT]−[MCCT])−k3.A[APC][MCC:APC/C]) | (13) |
| d[APC/C]dt=Dr2∂∂r(r2∂[APC/C]∂r)−k2[MCC][APC/C]+(k−2+A[APC])[MCC:APC/C] | (14) |
This system was subjected to the initial conditions given in Table 1, with reflective (Neumann) boundary conditions and equivalent geometry details for the cell and kinetochore as specified in Methods. The reaction-diffusion system (Eq.13-Eq.14) was implemented in MATLAB and simulated with various diffusion constant values (Table 1). No qualitative changes were recorded using a wide range of diffusion coefficients for MCC from the literature and higher; all behave similarly as shown in the typical curves in Fig. 3A. To ensure that the assumptions used to reduce the model had no influence of this result, a full system including three PDEs was re-simulated using various diffusion values for MCC. Again, no effects were observed (Fig. 3B). We conclude that diffusion has no major influence on the SAC model, and that the use of ODEs is in principle sufficient. This is certainly not applicable to other model structures, and cannot be generalized, particularly to high-dimensional systems or using low diffusion constants.
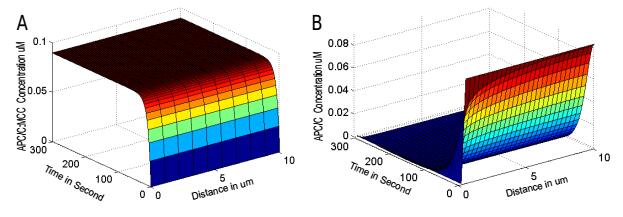 Figure 3. Numerical simulation of SAC Reaction-Diffusion system with spherical symmetry. (A) Simulation of two PDEs, one per components (i.e. MCC and APC/C). (B) Simulation of three PDEs, one per component (MCC, APC/C, and MCC:APC/C). Both panels were generated for various diffusion constants and showed no qualitative changes; therefore, shown are typical curves for MCC:APC/C (to the left) and APC/C (to the right).
Following the same steps as for SAC analysis as in the previous section, the SPOC wiring diagram (Fig. 4A) can be translated into a set of coupled ODEs. Accordingly, the total concentrations of Bub2, Tem1 and Bfa1:Bub2 can be expressed as: [Bub2T] = [Bub2] + [Tem1] + [Bfa1:Bub2:Tem1], [Tem1T] = [Tem1] + [Bfa1:Bub2:Tem1], and [Bfa1:Bub2T] = [Bfa1:Bub2]+[Bfa1:Bub2:Tem1]. The SPOC system is governed by the following equations, under the aforementioned assumptions (see also Methods):
| d[Bfa1:Bub2T]dt=k1.X([Bub2T]−[Bfa1:Bub2])−k3.Y([Tem1T]-[Bfa1:Bub2:Tem1])[Bfa1:Bub2:Tem1T] | (15) |
| a.[Bfa1:Bub2:Tem1T]2+b.[Bfa1:Bub2:Tem1T]+c=0 | (16) |
where the parameters
Again, AUTO software was used to find the bifurcation curve (see Methods for details). The bifurcation curve (Fig. 4B) is shown for the number of misaligned SPBs versus the total concentration of the Bfa1:Bub2:Tem1 inhibitor. The system switches its bistable state at the value 1.99; subsequently, SPOC is turned off, and eventually Tem1 is rapidly activated.
The numerical simulations of the ODEs is depicted in Fig. 4C, using a stiff solver in XPPAUT. Tem1 (Fig. 2C pink line) is inactive until both SPBs are correctly aligned, which takes place after about 7 minutes. The inhibitor complexes Bfa1:Bub2 and also Bfa1:Bub2:Tem1 have asymmetric behavior compared to Tem1 (Fig. 4C, gray and brown lines).
In eukaryotic cells, the mitotic control prevents DNA missegregation and aneuploidy. The evolutionarily conserved SAC mechanism guarantees that each chromosome has established its attachment to the spindle apparatus before commencing sister-chromatid separation, while the SPOC mechanism assures correct spindle alignment in some asymmetric cell divisions. The complexity of the mitotic control system arises from its fundamental spatial feature. In SAC, a single unattached or incorrectly attached kinetochore (out of 92) has to inhibit all APC/Cs of the cell and solely after last proper attachment the inhibitor has to be switched off rapidly. This behavior likely implies of a feedback loop contribution. The same is applied for SPOC mechanism with the distinguish in the signal that represents two SPBs.
Mathematical modeling can help to improve our molecular-level understanding of the interplay of SAC as well as SPOC components, allowing an understanding of the requirements that the system has to meet. To that end, a mathematical framework containing all signals in SAC (or SPOC) was studied. The network models were constructed based on biochemical reaction rules, and spatial characteristics, such as diffusion coefficients or cell size. Kinetochores and SPBs act as sensory-driven signals in SAC, and SPOC regulations, respectively. The simulation results (as ODEs or PDEs) were able to capture the desired behavior of both SAC and SPOC. Additionally to the simulations, a crucial feedback loop was built around the core components APC/C and MCC (or Tem1 and Bfa1 in SPOC) and their interplay. A one-parameter bifurcation diagram clearly depicts the bistability of the system and the realistic switch from active to inactive control states.
The presented mathematical models can be extended in future work to include various cell cycle checkpoints. Additionally, this approach will serve as a basis for designing experiments and evaluating novel hypotheses related to mitosis and cell cycle. The results provide systems-level details into the DNA segregation control mechanism and demonstrate that the combination of mathematical analysis with experimental data constitutes a powerful tool for investigation of complex biomedical systems.
The author gratefully acknowledges the visiting fund of the Institute for Numerical Simulation (INS) at Bonn University.
| [1] | [ S. F. Bakhoum,G. Genovese,D. A. Compton, Deviant kinetochore microtubule dynamics underlie chromosomal instability, Curr Biol, 19 (2009): 1937-1942. |
| [2] | [ A. K. Caydasi, B. Ibrahim and G. Pereira, Monitoring spindle orientation: Spindle position checkpoint in charge Cell Div 5 (2010), p28. |
| [3] | [ A. K. Caydasi,B. Kurtulmus,M. I. L. Orrico,A. Hofmann,B. Ibrahim,G. Pereira, Elm1 kinase activates the spindle position checkpoint kinase Kin4, J Cell Biol, 190 (2010): 975-989. |
| [4] | [ A. K. Caydasi, M. Lohel, G. Grünert, P. Dittrich, G. Pereira and B. Ibrahim, A dynamical model of the spindle position checkpoint Mol Syst Biol 8 (2012), p582. |
| [5] | [ L. M. Cherry,A. J. Faulkner,L. A. Grossberg,R. Balczon, Kinetochore size variation in mammalian chromosomes: An image analysis study with evolutionary implications, J Cell Sci, 92 (1989): 281-289. |
| [6] | [ E. J. Doedel, AUTO: A program for the automatic bifurcation analysis of autonomous systems, Congr Numer, 30 (1981): 265-284. |
| [7] | [ A. Doncic,E. Ben-Jacob,N. Barkai, Evaluating putative mechanisms of the mitotic spindle checkpoint, Proc Natl Acad Sci U S A, 102 (2005): 6332-6337. |
| [8] | [ B. Ermentrout, Simulating, Analyzing, and Animating Dynamical Systems: A Guide to Xppaut for Researchers and Students (society for industrial and applied mathematics, philadelphia), 2002. |
| [9] | [ D. Görlich, G. Escuela, G. Gruenert, P. Dittrich and B. Ibrahim, Molecular codes through complex formation in a model of the human inner kinetochore Biosemiotics 7 (2014), p223. |
| [10] | [ G. Gruenert, B. Ibrahim, T. Lenser, M. Lohel, T. Hinze and P. Dittrich, Rule-based spatial modeling with diffusing, geometrically constrained molecules BMC Bioinf 11 (2010), p307. |
| [11] | [ G. Gruenert,J. Szymanski,J. Holley,G. Escuela,A. Diem,B. Ibrahim,A. Adamatzky,J. Gorecki,P. Dittrich, Multi-scale modelling of computers made from excitable chemical droplets, IJUC, 9 (2013): 237-266. |
| [12] | [ R. Henze,J. Huwald,N. Mostajo,P. Dittrich,B. Ibrahim, Structural analysis of in silico mutant experiments of human inner-kinetochore structure, Bio Systems, 127 (2015): 47-59. |
| [13] | [ B. Ibrahim, In silico spatial simulations reveal that MCC formation and excess BubR1 are required for tight inhibition of the anaphase-promoting complex, Mol Biosyst, 11 (2015): 2867-2877. |
| [14] | [ B. Ibrahim, Spindle assembly checkpoint is sufficient for complete Cdc20 sequestering in mitotic control, Comput Struct Biotechnol J, 13 (2015): 320-328. |
| [15] | [ B. Ibrahim, Systems biology modeling of five pathways for regulation and potent inhibition of the anaphase-promoting complex (APC/C): Pivotal roles for MCC and BubR1, Omics, 19 (2015): 294-305. |
| [16] | [ B. Ibrahim, Toward a systems-level view of mitotic checkpoints, Prog Biophys Mol Biol, 117 (2015): 217-224. |
| [17] | [ B. Ibrahim, A mathematical framework for kinetochore-driven activation feedback in the mitotic checkpoint, Bull Math Biol, 79 (2017): 1183-1200. |
| [18] | [ B. Ibrahim, S. Diekmann, E. Schmitt and P. Dittrich, In-silico modeling of the mitotic spindle assembly checkpoint PLoS One 3 (2008), e1555. |
| [19] | [ B. Ibrahim,P. Dittrich,S. Diekmann,E. Schmitt, Stochastic effects in a compartmental model for mitotic checkpoint regulation, J Integr Bioinform, 4 (2007): 77-88. |
| [20] | [ B. Ibrahim,P. Dittrich,S. Diekmann,E. Schmitt, Mad2 binding is not sufficient for complete Cdc20 sequestering in mitotic transition control (an in silico study), Biophys Chem, 134 (2008): 93-100. |
| [21] | [ B. Ibrahim,R. Henze, Active transport can greatly enhance Cdc20:Mad2 formation, Int J Mol Sci, 15 (2014): 19074-19091. |
| [22] | [ B. Ibrahim,R. Henze,G. Gruenert,M. Egbert,J. Huwald,P. Dittrich, Spatial rule-based modeling: A method and its application to the human mitotic kinetochore, Cells, 2 (2013): 506-544. |
| [23] | [ B. Ibrahim,E. Schmitt,P. Dittrich,S. Diekmann, In silico study of kinetochore control, amplification, and inhibition effects in MCC assembly, Bio Systems, 95 (2009): 35-50. |
| [24] | [ G. J. Kops,B. A. Weaver,D. W. Cleveland, On the road to cancer: Aneuploidy and the mitotic checkpoint, Nat Rev Cancer, 5 (2005): 773-785. |
| [25] | [ P. Kreyssig, G. Escuela, B. Reynaert, T. Veloz, B. Ibrahim and P. Dittrich, Cycles and the qualitative evolution of chemical systems PLoS One 7 (2012), e45772. |
| [26] | [ P. Kreyssig,C. Wozar,S. Peter,T. Veloz,B. Ibrahim,P. Dittrich, Effects of small particle numbers on long-term behaviour in discrete biochemical systems, Bioinformatics, 30 (2014): i475-i481. |
| [27] | [ M. Lohel,B. Ibrahim,S. Diekmann,P. Dittrich, The role of localization in the operation of the mitotic spindle assembly checkpoint, Cell Cycle, 8 (2009): 2650-2660. |
| [28] | [ S. Marques,J. Fonseca,P. MA Silva,H. Bousbaa, Targeting the spindle assembly checkpoint for breast cancer treatment, Curr Cancer Drug Targets, 15 (2015): 272-281. |
| [29] | [ H. B. Mistry,D. E. MacCallum,R. C. Jackson,M. A. J. Chaplain,F. A. Davidson, Modeling the temporal evolution of the spindle assembly checkpoint and role of Aurora B kinase, Proc Natl Acad Sci U S A, 105 (2008): 20215-20220. |
| [30] | [ A. Musacchio,E. D. Salmon, The spindle-assembly checkpoint in space and time, Nat Rev Mol Cell Biol, 8 (2007): 379-393. |
| [31] | [ C. L. Rieder,R. W. Cole,A. Khodjakov,G. Sluder, The checkpoint delaying anaphase in response to chromosome monoorientation is mediated by an inhibitory signal produced by unattached kinetochores, J Cell Biol, 130 (1995): 941-948. |
| [32] | [ C. L. Rieder,A. Schultz,R. Cole,G. Sluder, Anaphase onset in vertebrate somatic cells is controlled by a checkpoint that monitors sister kinetochore attachment to the spindle, J Cell Biol, 127 (1994): 1301-1310. |
| [33] | [ A. D. Rudner,A. W. Murray, The spindle assembly checkpoint, Curr Opin Cell Biol, 8 (1996): 773-780. |
| [34] | [ R. P. Sear,M. Howard, Modeling dual pathways for the metazoan spindle assembly checkpoint, Proc Natl Acad Sci U S A, 103 (2006): 16758-16763. |
| [35] | [ L. F. Shampine,M. W. Reichelt, The matlab ode suite, SIAM J Sci Comput, 18 (1997): 1-22. |
| [36] | [ R. D. Skeel,M. Berzins, A method for the spatial discretization of parabolic equations in one space variable, SIAM J Sci Comput, 11 (1990): 1-32. |
| [37] | [ F. Stegmeier,M. Rape,V. M. Draviam,G. Nalepa,M. E. Sowa,X. L. Ang,E. R. McDonald,M. Z. Li,G. J. Hannon,P. K. Sorger,M. W. Kirschner,J. W. Harper,S. J. Elledge, Anaphase initiation is regulated by antagonistic ubiquitination and deubiquitination activities, Nature, 446 (2007): 876-881. |
| [38] | [ S. Tschernyschkow,S. Herda,G. Gruenert,V. Döring,D. Görlich,A. Hofmeister,C. Hoischen,P. Dittrich,S. Diekmann,B. Ibrahim, Rule-based modeling and simulations of the inner kinetochore structure, Prog Biophys Mol Biol, 113 (2013): 33-45. |
| [39] | [ A. Verdugo, P. K. Vinod, J. J. Tyson and B. Novak, Molecular mechanisms creating bistable switches at cell cycle transitions Open Biol 3 (2013), 120179. |
| [40] | [ Z. Wang,J. V. Shah,M. W. Berns,D. W. Cleveland, In vivo quantitative studies of dynamic intracellular processes using fluorescence correlation spectroscopy, Biophys J, 91 (2006): 343-351. |
| [41] | [ T. Wilhelm, The smallest chemical reaction system with bistability BMC Syst Biol 3 (2009), p90. |
| 1. | Stephan Peter, Fanar Ghanim, Peter Dittrich, Bashar Ibrahim, Organizations in reaction-diffusion systems: Effects of diffusion and boundary conditions, 2020, 43, 1476945X, 100855, 10.1016/j.ecocom.2020.100855 | |
| 2. | Richard Henze, Chunyan Mu, Mate Puljiz, Nishanthan Kamaleson, Jan Huwald, John Haslegrave, Pietro Speroni di Fenizio, David Parker, Christopher Good, Jonathan E. Rowe, Bashar Ibrahim, Peter Dittrich, Multi-scale stochastic organization-oriented coarse-graining exemplified on the human mitotic checkpoint, 2019, 9, 2045-2322, 10.1038/s41598-019-40648-w | |
| 3. | Stephan Peter, Bashar Ibrahim, Peter Dittrich, Linking Network Structure and Dynamics to Describe the Set of Persistent Species in Reaction Diffusion Systems, 2021, 20, 1536-0040, 2037, 10.1137/21M1396708 | |
| 4. | Faiza Hanif Waghu, Karishma Desai, Sumana Srinivasan, Kaushiki S. Prabhudesai, Vikas Dighe, Kareenhalli V. Venkatesh, Susan Idicula-Thomas, FSHR antagonists can trigger a PCOS-like state, 2022, 68, 1939-6368, 129, 10.1080/19396368.2021.2010837 |


Figures(4) / Tables(1)

Bashar Ibrahim. Mathematical analysis and modeling of DNA segregation mechanisms[J]. Mathematical Biosciences and Engineering, 2018, 15(2): 429-440. doi: 10.3934/mbe.2018019

| |
|
|
||
| Initial amount | ||||
| APC/C | 0.09 |
[37] | ||
| MCC | 0.15 |
[15] | ||
| Tem1 | 0.06 |
[4] | ||
| Bfa1 | 0.04 |
[4] | ||
| Bub2 | 0.04 |
[4] | ||
| Diffusion constants | ||||
| MCC | 1-20 |
This study | ||
| APC/C | 1.8 |
[40] | ||
| Cdc20 | 19.5 |
[40] | ||
| Mad2 | 5 |
[13] | ||
| Environment | ||||
| Radius of the kinetochore | 0.1 |
0.01 |
[5] | |
| Radius of the cell | 10 |
4 |
[21] | |
| Rate constants | ||||
| kinetochores or SPBs | 0-92 | 0-2 | [16] | |
| |
|
This study | ||
| |
|
This study | ||
| |
|
This study | ||
| |
|
This study |
DownLoad: CSV| |
|
|
||
| Initial amount | ||||
| APC/C | 0.09 |
[37] | ||
| MCC | 0.15 |
[15] | ||
| Tem1 | 0.06 |
[4] | ||
| Bfa1 | 0.04 |
[4] | ||
| Bub2 | 0.04 |
[4] | ||
| Diffusion constants | ||||
| MCC | 1-20 |
This study | ||
| APC/C | 1.8 |
[40] | ||
| Cdc20 | 19.5 |
[40] | ||
| Mad2 | 5 |
[13] | ||
| Environment | ||||
| Radius of the kinetochore | 0.1 |
0.01 |
[5] | |
| Radius of the cell | 10 |
4 |
[21] | |
| Rate constants | ||||
| kinetochores or SPBs | 0-92 | 0-2 | [16] | |
| |
|
This study | ||
| |
|
This study | ||
| |
|
This study | ||
| |
|
This study |
