The contextual nature of adaptation demands insights into the effects of actors' actions, decisions, and negotiations at different levels in the adaptation process to facilitate harmonizing and targeting actions. However, researchers who examine these activities at the micro level of communities and macro level of authorities in Sub-Saharan Africa are sparse. Consequently, using a qualitative approach and the Asset Adaptation Framework, we explored the everyday adaptations to flooding at the micro-levels of households/communities and the macro levels of governments before, during, and after flooding events in two low-income communities in Lagos, Nigeria. At the macro levels of governments, adaptation strategies centered on social reorganization and welfare, i.e., disaster reduction/management, in the temporal dimensions, situating adaptation in the adjustment/transitional flux. At the micro level, the strategies before flooding problematized the categorization of autonomous adaptation as unplanned. During flooding events, there was a difference in assets mobilized at the two levels, while macro-level actors mobilized financial assets for welfare, micro-level actors focused on social assets. After flooding, the positive psychology of self-conscientiousness in human assets aided the emergence of shadow networks that challenged the status quo and shaped each community's adaptation pathway/outcome. Furthermore, the human assets of faith/fate, place attachment, and autochthony used for building long-term resilience and entitlement claims aided a reposition of responsibility on the people's lifestyle by the authorities and supported a stance on adaptation as persistence/transitional. The stance on persistence/transitional pattern at the macro level notwithstanding, the shadow network in one of the communities utilized invited spaces of negotiation for entitlement claims that shifted the status quo and aided a transformational pattern. The highlighted shift in adaptation underlines the need to understand adaptation activities in the different spheres to guide policies, align actions, and facilitate a harmonized and sustainable adaptation.
Citation: Olasimbo Fayombo. Everyday adaptations to flooding at the micro-levels of low-income communities and macro levels of authorities in the megacity of Lagos, Nigeria[J]. Urban Resilience and Sustainability, 2024, 2(2): 151-184. doi: 10.3934/urs.2024008
Related Papers:
[1]
I. H. K. Premarathna, H. M. Srivastava, Z. A. M. S. Juman, Ali AlArjani, Md Sharif Uddin, Shib Sankar Sana .
Mathematical modeling approach to predict COVID-19 infected people in Sri Lanka. AIMS Mathematics, 2022, 7(3): 4672-4699.
doi: 10.3934/math.2022260
[2]
Deniz UÇAR, Elçin ÇELİK .
Analysis of Covid 19 disease with SIR model and Taylor matrix method. AIMS Mathematics, 2022, 7(6): 11188-11200.
doi: 10.3934/math.2022626
[3]
Rahat Zarin, Amir Khan, Aurangzeb, Ali Akgül, Esra Karatas Akgül, Usa Wannasingha Humphries .
Fractional modeling of COVID-19 pandemic model with real data from Pakistan under the ABC operator. AIMS Mathematics, 2022, 7(9): 15939-15964.
doi: 10.3934/math.2022872
[4]
C. W. Chukwu, Fatmawati .
Modelling fractional-order dynamics of COVID-19 with environmental transmission and vaccination: A case study of Indonesia. AIMS Mathematics, 2022, 7(3): 4416-4438.
doi: 10.3934/math.2022246
[5]
Xiaoying Pan, Longkun Tang .
A new model for COVID-19 in the post-pandemic era. AIMS Mathematics, 2024, 9(8): 21255-21272.
doi: 10.3934/math.20241032
[6]
Shuyun Jiao, Mingzhan Huang .
An SIHR epidemic model of the COVID-19 with general population-size dependent contact rate. AIMS Mathematics, 2020, 5(6): 6714-6725.
doi: 10.3934/math.2020431
[7]
Moh. Mashum Mujur Ihsanjaya, Nanang Susyanto .
A mathematical model for policy of vaccinating recovered people in controlling the spread of COVID-19 outbreak. AIMS Mathematics, 2023, 8(6): 14508-14521.
doi: 10.3934/math.2023741
[8]
Ishtiaq Ali, Sami Ullah Khan .
Dynamics and simulations of stochastic COVID-19 epidemic model using Legendre spectral collocation method. AIMS Mathematics, 2023, 8(2): 4220-4236.
doi: 10.3934/math.2023210
[9]
Khalaf M. Alanazi .
The asymptotic spreading speeds of COVID-19 with the effect of delay and quarantine. AIMS Mathematics, 2024, 9(7): 19397-19413.
doi: 10.3934/math.2024945
[10]
Oluwaseun F. Egbelowo, Justin B. Munyakazi, Manh Tuan Hoang .
Mathematical study of transmission dynamics of SARS-CoV-2 with waning immunity. AIMS Mathematics, 2022, 7(9): 15917-15938.
doi: 10.3934/math.2022871
Abstract
The contextual nature of adaptation demands insights into the effects of actors' actions, decisions, and negotiations at different levels in the adaptation process to facilitate harmonizing and targeting actions. However, researchers who examine these activities at the micro level of communities and macro level of authorities in Sub-Saharan Africa are sparse. Consequently, using a qualitative approach and the Asset Adaptation Framework, we explored the everyday adaptations to flooding at the micro-levels of households/communities and the macro levels of governments before, during, and after flooding events in two low-income communities in Lagos, Nigeria. At the macro levels of governments, adaptation strategies centered on social reorganization and welfare, i.e., disaster reduction/management, in the temporal dimensions, situating adaptation in the adjustment/transitional flux. At the micro level, the strategies before flooding problematized the categorization of autonomous adaptation as unplanned. During flooding events, there was a difference in assets mobilized at the two levels, while macro-level actors mobilized financial assets for welfare, micro-level actors focused on social assets. After flooding, the positive psychology of self-conscientiousness in human assets aided the emergence of shadow networks that challenged the status quo and shaped each community's adaptation pathway/outcome. Furthermore, the human assets of faith/fate, place attachment, and autochthony used for building long-term resilience and entitlement claims aided a reposition of responsibility on the people's lifestyle by the authorities and supported a stance on adaptation as persistence/transitional. The stance on persistence/transitional pattern at the macro level notwithstanding, the shadow network in one of the communities utilized invited spaces of negotiation for entitlement claims that shifted the status quo and aided a transformational pattern. The highlighted shift in adaptation underlines the need to understand adaptation activities in the different spheres to guide policies, align actions, and facilitate a harmonized and sustainable adaptation.
1.
Introduction
There exists a wide class of mathematical models that analyse the spread of epidemic diseases, either deterministic or stochastic, and may involve many factors such as infectious agents, mode of transmission, incubation periods, infectious periods, quarantine periods, etcetera ([1,2,3,4,5]).
A basic model of infectious disease population dynamics, consisting of susceptible (S), infective (I) and recovered (R) individuals were first considered in a deterministic model by Kermack and McKendric [6]. Since then, various epidemic deterministic models have been developed, with or without a time delay (see e.g McCluskey [7] and Huang et al. [8]). At the same time, many stochastic models have been considered: discrete time models (see e.g Tuckwell and Williams [9]; Oli et al. [10]), continuous time Markov chain models and diffusion models (see e.g. Mode and Sleeman [11]). The models obtained in these three categories are of increasing mathematical complexity and allow to study several aspects of the epidemics. However even if the discrete-time models are the simplest ones, they may help to better define the basic principles of the contagion and to avoid the constraints due to the own definitions of the more sophisticated models.
The COVID-19 is an infectious disease due to the severe acute respiratory syndrome coronavirus 2 (SARS-CoV-2). First identified at the end of 2019 in the Hubei province in China (Hui et al. [12]) it has resulted in an ongoing pandemic with several million cases and more than 800, 000 deaths (by August 2020). Many factors increase the complexities of COVID-19 infection and make very difficult the disease management. For example the origin of the infection is still unknown, and the incubation period of the virus and other basic characteristic are still not completely determinate. Since there is yet no direct treatment for this virus, or an available vaccine, the only way to control the disease still depends on timely diagnosis and isolation. Thus the possibility to describe the evolution of the contagion via sound and sufficiently simple mathematical models is very important in order to define effective and economically sustainable isolation rules.
A huge amount of research papers has been written on this new disease and its spread (see e.g. Wu et al. [13] and Lavezzo et al. [14]) and many data bases of research papers are now available (see e.g. the WHO COVID-19 Global literature on coronavirus disease Data Base https://www.who.int/emergencies/diseases/novel-coronavirus-2019/global-research-on-novel-coronavirus-2019-ncov). In the present paper we will adapt a simple stochastic SIR-type model proposed by Ferrante et al. [15], dividing the population into several classes to better describe the evolution of a COVID type epidemic. Instead of considering more classical deterministic SEIR models (see e.g. He et al. [16]), we concentrate here in a simple stochastic discrete-time model of infectious diseases that allows us to better describe the real evolution of the pandemic, including latency periods, the presence of asymptomatic patients and different levels of isolation. To model the evolution of the epidemic, we will describe the evolution of every single individual in the population, modelling the probability on every day to be infected and, once infected, the exact evolution of its disease until the possible recovery or the death. The construction of the theoretical model is carried out in Section 2, where we are able to compute the probability of contagion and an estimate of the basic reproduction number R0. Then, in Section 3 we answer to five research questions by using a simulation of the evolution of the disease. The use of the simulation is justified by the complexity of the model, that prevents to carry out any further exact computation. We are able to see that to stop the epidemic is fundamental to start early with a severe quarantine and that a late starting date or a more soft quarantine make this procedure almost useless. Moreover, to determine the quarantine it is very important to know the level of infectivity of the asymptomatic individuals, since the more infectious they are, the more important is the quarantine. Finally, as expected, the group immunity plays a very important role to prevent the development of the disease.
2.
A SIR type discrete-time stochastic epidemic model
To model the evolution of epidemics, Tuckwell and Williams [9] proposed a simple stochastic SIR-type model based on a discrete-time Markovian approach, later generalized by Ferrante et al. [15] with a SEIHR model. These models, despite their simplicity, are very unrealistic to catch the characteristic of the COVID-19 disease and for this reason in this paper we introduce a more complex system, that we call SEIAHCRD, that better describes this new disease.
Assume that the population size is fixed and equal to n, and that the time is discrete, with the unit for the duration of an epoch one day. Every individual, marked by an integer between 1 and n, belongs to one of the following 8 classes:
● the class S includes the individuals susceptible to the disease and never infected before;
● the class E includes the individuals in a latency period, i.e. individuals that have been infected but that are still not infectious or sick;
● the class I includes the infectious individuals, that are not yet sick, but that will develop later the disease;
● the class A includes the infectious individuals, that are not yet sick, but that will NOT develop later the disease, usually referred as Asymptomatic;
● the class H includes the infectious individuals, that are sick, but with light symptoms and therefore at home quarantine;
● the class C includes the infectious individuals, that are sick and with severe symptoms, and most of the time are hospitalized;
● the class D includes the deceased individuals;
● the class R includes the recovered individuals.
Assuming that we start at time 0, we will define for any individual i∈{1,…,n} the family of stochastic processes YiΞ={YiΞ(t),t=0,1,2,…}, such that YiΞ(t)=1 if the individual i at time t belongs to the class Ξ, where Ξ is equal to S,E,I,A,H,C,D or R, and 0 otherwise. In this way, the total number of individuals in the class Ξ at time t≥0 will be denote by YΞ(t) and will be equal to ∑ni=1YiΞ(t).
Let us now fix the main assumption on the evolution of the epidemic. At time 0 all the individuals are in S, but one in class I or A and that the evolution of the contagion follows these rules:
1. Daily encounters: each individual i, over (t,t+1], will encounter a number of other individuals equal to Ni(t) which we will assume to be a deterministic value;
2. Contagion probability: if an individual who has never been diseased up to and including time t, encounters an individual in (t,t+1] who belongs to the class I or A, then, independently of the results of other encounters, the encounter results in transmission of the disease with probability qI and qA, respectively.
3. Permanence in the classes: any individual, but one, starts from class S. Once infected he/she moves to class E and so on according to the graph below. The time spent in the classes E, I and A are of rE, rI and rA consecutive days, respectively. These values can be considered deterministic or stochastic. Any individual who enters the class H remains in this class for rHC consecutive days with probability α or for rHR consecutive days with probability 1−α. Any individual who enters the class C remains in this class for rCD consecutive days with probability λ or for rCR consecutive days with probability 1−λ. As before, the values of these four numbers of consecutive days can be considered deterministic or stochastic. To conclude, we assume that the individuals once in class R remain there forever, the same as for the class D.
4. Transitions between the classes: we assume that any individual can move between the classes according to the following graph
Here β,μ,α and λ denotes the transition probabilities and the transitions occur at the end of the permanence time spent by the individual in the previous class. Note that μ,α,λ are parameters that depends only on the specific nature of the disease, while β depends on this and the number of individuals in the classes I and A.
Any individual, once infected with probability β, follows one of the four paths described here:
(a) he/she transits through the states E,I,H,C,D, where he/she remains, respectively, for rE, rI, rHC and rCD days, after which he/she dies and moves to class D.
(b) he/she transits through the states E,I,H,C,R, where he/she remains, respectively, for rE, rI, rHC and rCR days, after which he/she becomes immune and moves to class R.
(c) he/she transits through the states E,I,H,R, where he/she remains, respectively, for rE, rI and rHR days, after which he/she becomes immune and moves to class R.
(d) he/she transits through the states E,A,R, where he/she remains, respectively, for rE and rA days, after which he/she becomes immune and moves to class R.
It is immediate to see that the probability to follow any of these four paths are equal to, respectively,
μαλ,μα(1−λ),μ(1−α),(1−μ).
In order to evaluate the probability β of contagion at time t of an individual in class S, we will start defining the probabilities of meeting an individual in the classes S,E,I,A and R as equal. Note that the individuals in classes H and C are in total quarantine and that it is not possible to meet them and that the individuals in class D are removed from the system. So, we will deal with three possibly different encounter probabilities:
● pI the probability of meeting an individual belonging to the class I;
● pA the probability of meeting an individual belonging to class A;
● pS the probability of meeting an individual that is not infectious, that is he/she belongs to the classes S,E or R.
Assuming that the probability of meeting any individual is uniform and independent from the above defined classes, we define these probabilities as
pI=yIn−yH−yC−yD−1,pA=yAn−yH−yC−yD−1,pS=1−pI−pA
(2.1)
when yH+yC+yD<n−1, while pI=pA=0,pS=1 when yH+yC+yD=n−1. In the above formulas, yI,yA,yH,yC and yD denote the number of individuals in classes I,A,H,C and D, respectively.
Denoting by jiI,jiA the number of meetings of the i-th individual at time t with individuals in the classes I and A, respectively, and by Ni(t) its total daily encounters, using a multinomial distribution, the probability that the i-th individual meets exactly this proportion of individuals is
On the other hand, given the same number of contacts we can easily derive the probability of contagion pjiI+jiA of the i-th individual at time t by computing the probability of its complement, i.e. that no encounter results in transmission of the disease. Thus, by the independence assumption, we get
pjiI+jiA=1−(1−qI)jiI(1−qA)jiA
where qI and qA denote the probability of transmission of the specific disease for individuals in classes I and A, respectively, which are usually different.
Then the probability of contagion at time t+1 of a single individual is equal to
when yH+yC+yD<n−1, while βi=0 when yH+yC+yD=n−1. As done by Tuckwell and Williams [9], we can use these formulas to simulate the spread of an epidemic under these general assumptions. Some results, similar to those presented in [9], can be found in Ferrante et al. [15].
To conclude, let us now consider the basic reproduction number R0, i.e. the expected number of secondary cases produced by an infectious individual during its period of infectiousness (see Diekmann et al. [17]). In the present model, this refers to individuals that transits through the classes I or A. Let us recall the threshold value of R0, which establishes that an infection persists only if R0>1. As for the SIR-model proposed by Tuckwell and Williams we are not able to derive the exact explicit value of R0, but it is possible to extend their results, when Ni(t)≡N, for all i and t, obtaining that
R0=μrIqIN+(1−μ)rAqAN+O(1n−1).
Note that the value of R0 computed above is the basic reproduction number at the beginning of the disease, when there is one infectious individual that has N contacts in a population with n−1 susceptible inhabitants. When the disease is in an advanced development, keeping the total number of contacts N some of them won't be with susceptible individuals and the number of cases produced by an infectious individual will be smaller. At time t, let us call S(t) the number of susceptible individuals (class S) and X(t) the number of individuals removed from the population (members of the classes H, C and D). Then, given an individual in class I, set Zi(t) his number of contacts with susceptible individuals during the day t and Qi(t) the number of individuals infected by i at the end of day t. Clearly Zi(t) follows an hypergeometric distribution with parameters n−X(t)−1,S(t) and N and, given Zi(t)=z,z∈{0,…,N}, it can be seen that Qi(t)∼Bin(z,qI). Thus
Furthermore, using the same ideas in Ferrante et al. (2016), the number of secondary cases corresponding to this individual will be
rIqINS(t)n−1−X(t)+O(1n−1−X(t)).
Finally, the number of secondary cases produced by one arbitrary infectious individual (that can be in class I or A) at time t given S(t) and X(t) and that we will call R0(t), will be
The COVID19 is a highly contagious disease that has appeared at the end of 2019. From all the information that it is published every day, often contradictory, in the media, we can extract some properties of the disease. After the contagion, the virus remains in a latent state for 5-7 days before the individual became infectious. Then the individual can begin with symptoms in 3 days or he can continue asymptomatic, but probably infectious during two weeks. It is not known actually the number of asymptomatic people, but it will be probably bigger that the number of people with symptoms. About 75% of persons with symptoms have just light symptoms that last for two weeks and after that they became recovered. The other 25% get sever symptoms after a first period of 7-9 days with light symptoms. A 15% of these patients with severe symptoms die in 4-6 days, while the other 85% will recover after a period of 18-24 days.
This disease can be described by the SEIAHRCD model defined before. According to the data above described, we can choose the deterministic values for the permanence in the classes
rE=5,rI=3,rA=14,rHR=14,rHC=9,rCR=20,rCD=4
and for the probabilities
μ=0.5,α=0.25,andλ=0.15.
We also have to make an assumption on the ineffectiveness of the individuals when in the classes I and A. We assume that
qI=0.2,andqA=0.05.
That is, we are assuming that asymptomatic individuals are less infectious than individuals who have symptoms.
R0, the expected number of secondary cases produced by an infectious individual, is equal with these parameters to
R0=N(0.3+0.35)+O(1n−1).
We see that the threshold value R0=1 is obtained for N=1.54 and that R0=3.5 (one of the possible empirical values estimated on the basis of real data) for N=5.38.
We study the spread of the contagion in a closed population of 10000 inhabitants for a period of time of 180 days. We assume that an infectious individual (in class I) arrives to this healthy population and he/she remains there for 3 days. We also assume that Ni(t)≡N for any i and that therefore βi is constant for any individual. This assumption is strong in the case of a possible quarantine, but it is still reasonable.
In this paper, since the analytical approach to this model is really complicated, we focus on the evolution of the disease by implementing a simulation using environment Maple. All the values presented here are the mean computed over 30 repetitions of the simulation and we report also the confidence intervals.
We know very well that our model cannot explain exactly the COVID19 epidemic, since there are too many unknown aspects about this new disease, but we believe that the study of the behaviour of our model can help to understand the COVID19 epidemic. More precisely, we will answer five Research Questions regarding the dynamics of the disease depending on some of the parameters involved. Particularly, we deal with (1) the importance of the number of contacts, (2)-(3) the effectiveness of a quarantine depending on the moment it begins and on its duration, (4) the role of the asymptomatic depending of their level of infectiveness and (5) what happens with different levels of group immunization.
For each of these situations we study six quantities that we consider of major interest:
1. Class D: The number of deceased, therefore individuals in class D, after 180 days.
2. Max class C: The maximum number of individuals in class C, i.e. with severe symptoms, in one day.
3. Total class C: The sum of all the days spent by all the individuals in the class C.
4. Max new H: The maximum number of individuals that enter in class H (people with symptoms) in one day.
5. Day max new H: The day when it is reached the maximum number of individuals that enter in class H in one day.
6. Prop. infected: The proportion of the population that has been infected after 180 days.
For all these quantities we give a table with the mean and the 95% confidence interval for the mean in several situations. We also present a plot of one simulation of the number of deaths, the number of individuals in class C and the number of individuals that enter in class H each day for any of these situations along the 180 days. Note that the number of deceased is considered assuming that the health service is able to give the same level of assistance whatever the number of patients is, but probably in the situations where the health service is more stressed the assistance will be worse and the number of deceased may increase.
3.1. RQ1: How does the number of contacts N influence the spread of the disease?
We consider the dependence on the number of contacts on the evolution of the disease when N=10,5,4 and 3 (Table 1).
Let us point out that when N=5 in one of the 30 simulations the epidemic did not go forward when N=4 it happened in two cases. On the other hand, when N=3 and with our initial conditions, only in 1 of the 30 simulations the disease went on. For this reason, in the table we only give the values of such case.
The number of deceased and the proportion of infected population are not very different between N=4 and N=10. The main difference consists in the velocity in the dissemination of the illness and so, the maximum of individuals in class C that can require hospitalization (Figure 1).
Figure 1.
Evolution of the number of deceased, new individuals in H and the size of the class C when N=10,5,4 and 3.
3.2. RQ2: How does the beginning date of the quarantine influence the spread of the disease?
Let us check the effects of a quarantine on the evolution of the disease. We assume that N=10 at the beginning of the spread of the disease and we consider three levels of quarantine, defined by the number of contacts N=3, N=2 or N=0 (the total quarantine). We can also consider what happens depending on the moment that the quarantine starts:
● when there are 10 deceased (first 10 individuals in class D),
● when there is the first deceased (first individual in class D),
● when there is the first individual with severe symptoms (first time the class C in not empty).
3.2.1. Quarantine beginning after first 10 deceased.
Let us recall that we assume that before the quarantine N=10. We get (Table 2 and Figure 2)
Table 2.
Influence of a quarantine of N at 10 deaths.
Figure 2.
Evolution of the number of deceased, new individuals in H and the size of the class C without quarantine and when the quarantine with N=3,2 and 0 begins with 10 deaths.
It is clear that the efficacy of these quarantine, including the total quarantine, is almost null, since at this level of the disease the 99% of the population has been infected (case N=0).
3.2.2. Quarantine beginning after the first deceased
In this case we can note the efficacy of a quarantine if it is rigorous, with a significant difference between N=3 and N=2. Note that in the total quarantine, there will be more that 100 deceased since at this level of the disease more of the 50% of the population has been infected (case N=0) (Table 3 and Figure 3).
Table 3.
Influence of a quarantine of N after the first death.
Figure 3.
Evolution of the number of deceased, new individuals in H and the size of the class C without quarantine and when the quarantine with N=3,2 and 0 begins after the first death.
3.2.3. Quarantine beginning after the first individual enters in class C
In this case the quarantine is effective. For N=2 we reduce the mortality of about 50% and for N=0 the number of deceased is just 20. Note that when the first individual enters in C there are about 1000 individuals infected (Table 4 and Figure 4).
Table 4.
Influence of a quarantine of N after the first enter in C.
Figure 4.
Evolution of the number of deceased, new individuals in H and the size of the class C without quarantine and when the quarantine with N=3,2 and 0 begins after the first enter in C.
3.3. RQ3: How does the duration of the quarantine influence the spread of the disease?
Let us consider now the duration of the quarantine. We consider quarantines, beginning at first individual in C, of duration 20, 60 and 120 days. We also deal with two levels of quarantine, beginning from a number of contacts of N=10 we pass to a quarantine with N=3 or N=1.
3.3.1. The case with N=3
When the quarantine is done with N=3, its effects in the number of deceased are not very important although we do a long quarantine of 120 days. Nevertheless, we are able to reduce the maximum in class C. To value the importance of the quarantine we need a more restricted quarantine (Table 5 and Figure 5).
Table 5.
Influence of a quarantine (from N=10 to N=3) of duration k days after the first enter in C.
Figure 5.
Evolution of the number of deaths, new individuals in H and the size of the class C when there is a quarantine with N=3 of k=0,20,60 and 120 days after the first enter in C.
We can see here that with a strong quarantine (N=1) and with a long quarantine (k=120), the disease can be stopped. In the two other cases, k=20 or k=60 the final numbers of deceased are very similar, since after a short stop the disease returns to growth up arriving at the same levels of the initial outbreak and having two clear peaks (Table 6 and Figure 6).
Table 6.
Influence of a quarantine (from N=10 to N=1) of duration k days after the first enter in C.
Figure 6.
Evolution of the number of deaths, new individuals in H and the size of the class C when there is a quarantine with N=1 of k=0,20,60 and 120 days after the first enter in C.
3.4. RQ4: How does the infectivity of asymptomatic individuals influence the spread of the disease?
One of the main problems in the study of the COVID19 disease is the role of the asymptomatic. In our general framework we have supposed that the infectivity of an asymptomatic individual (class A) is one fourth of the infectivity of an infective individual that will have symptoms (class I), that is, qA=0.05 and qI=0.2. Here we consider two other cases: in the first both probabilities are equal (qA=qI=0.2) and in the second case the asymptomatic individuals are not infectious (qA=0). We also consider the case without quarantine and the case with quarantine (from N=10 to N=3) after the first individual in class C.
3.4.1. The role of the asymptomatic individuals without quarantine
We can see that the behaviour of the disease is very similar in the three cases and the main difference just consists in the velocity of its spread (Table 7 and Figure 7).
3.4.2. The role of the asymptomatic individuals with quarantine
We can see the importance of knowing the role of asymptomatic individuals in implementing quarantine. The more infectious the asymptomatic are, the more effective the quarantine is (Table 8 and Figure 8).
Figure 8.
Evolution of the number of deaths, new individuals in H and the size of the class C with qA=0,0.05 and 0.2 with quarantine N=3 after the first individual enters in class C.
3.5. RQ5: How does the group immunity influence the spread of the disease?
We consider finally the group immunity. We consider three cases, where the immunity group is of 50%, 70% and 90%, respectively. We can see that an immunity of the 50% is not enough to control the disease since almost all the individuals without immunity become infected after the 180 days (Table 9 and Figure 9).
On the other hand, with an immunity of the 70% the disease is well controlled. Moreover if the immunity regards the 70% of the population, in 11 over 30 trials there aren't any deaths and in one of the trials the disease does not infect any person.
If we consider an immunity of the 90% only in 8 of the 30 trials there have been infected people. In our simulations we get one trial with 12 infected individuals, 1 trial with four individuals infected, 2 trials with two infected and 4 trials with only one infected. In all these cases without any individual deceased.
4.
Conclusions
Like any mathematical model, the model presented in this paper does not exactly describe COVID19 disease, even if it shares with this most of its characteristic. Furthermore, for this new disease many aspects are still unknown, such as the level of infectivity of asymptomatic patients.
Our goal is to understand how a disease similar to the COVID19 spreads over in a closed population and to answer to some specific research questions. What we have obtained can be summarized as follows:
1. Reducing the number of contacts of each individual the spread of the disease slows down, the pressure on the health system reduces, but we end up with a similar number of deceased.
2. It is basic to start the quarantine at least when the first severe patient is detected. Waiting for the first deceased leads to many more additional deceased.
3. To raise the quarantine it is very important to know the level of infectivity of the asymptomatic. The more infectious they are, the more important is the quarantine.
4. To stop the disease you must perform a strict and long quarantine and you must start this as soon as possible.
5. Group immunity is very important to prevent the development of the disease.
Even if most of the answers are the expected ones, we have obtained these through a sound stochastic epidemic model, that despite of its simplicity probably is able to catch most of the peculiarity of this disease.
We believe that a more sophisticated version of this model and more elaborated simulations can allow us to answer to more complex questions, but probably it will be better to wait when a deeper knowledge on this disease will be available.
Acknowledgments
Xavier Bardina and Carles Rovira are supported by the grant PGC2018-097848-B-I00.
Conflict of interest
The authors declare no conflict of interest in this paper.
References
[1]
Satterthwaite D (2013) The political underpinnings of cities' accumulated resilience to climate change. Environ Urban 25: 381–391. https://doi.org/10.1177/0956247813500902 doi: 10.1177/0956247813500902
[2]
IPCC (Intergovernmental Panel on Climate Change) (2014) Fifth assessment report AR5—Urban areas, Chapter 8, IPCC WGII. Available from: https://www.ipcc.ch/assessment-report/ar5/.
[3]
Dow K, Berkhout F, Preston BL, et al. (2013) Limits to adaptation. Nat Clim Chang 3: 305–307. https://doi.org/10.1038/nclimate1847 doi: 10.1038/nclimate1847
[4]
Hardoy J, Pandiella G (2009) Urban poverty and vulnerability to climate change in Latin America. Environ Urban 21: 203–224. https://doi.org/10.1177/0956247809103019 doi: 10.1177/0956247809103019
Khan MR, Roberts JT (2013) Adaptation and international climate policy. Wiley Interdiscip Rev Clim Change 4: 171–189. https://doi.org/10.1002/wcc.212 doi: 10.1002/wcc.212
[7]
Tol RSJ, Downing TE, Kuik OJ, et al. (2004) Distributional aspects of climate change impacts. Global Environ Change 14: 259–272. https://doi.org/10.1016/j.gloenvcha.2004.04.007 doi: 10.1016/j.gloenvcha.2004.04.007
[8]
Satterthwaite D, Huq S, Reid H, et al. (2009) Adapting to climate change in urban areas: The possibilities and constraints in low and middle-income nations, In: Adapting Cities to Climate Change, Earthscan, UK: Routledge, 3–47.
[9]
Ajibade I, McBean G, Bezner-Kerr R (2013) Urban flooding in Lagos, Nigeria: Patterns of vulnerability and resilience among women. Global Environ Change 23: 1714–1725. https://doi.org/10.1016/j.gloenvcha.2013.08.009 doi: 10.1016/j.gloenvcha.2013.08.009
[10]
Manuel-Navarrete D, Pelling M, Redclift M (2011) Critical adaptation to hurricanes in the Mexican Caribbean: Development visions, governance structures, and coping strategies. Global Environ Change 21: 249–258. https://doi.org/10.1016/j.gloenvcha.2010.09.009 doi: 10.1016/j.gloenvcha.2010.09.009
[11]
Moser CON, Satterthwaite D (2008) Towards pro-poor adaptation to climate change in the urban centres of low-and middle-income countries, In: Human Settlement Development Series: Climate Change and Cities Discussion Paper 3, London: International Institute for Environment and Development (ⅡED).
[12]
Adelekan IO, Simpson NP, Totin E, et al. (2022) IPCC sixth assessment report (AR6)—Impacts, adaptation and vulnerability: Regional factsheet Africa. Available from: https://www.ipcc.ch/report/ar6/wg2/about/factsheets/.
[13]
Huq S, Kovats S, Reid H, et al. (2007) Reducing risks to cities from disasters and climate change. Environ Urban 19: 7–15. https://doi.org/10.1177/0956247807078058 doi: 10.1177/0956247807078058
Chen AS, Djordjević S, Leandro J, et al. (2010) An analysis of the combined consequences of pluvial and fluvial flooding. Water Sci Technol 62: 1491–1498. https://doi.org/10.2166/wst.2010.486 doi: 10.2166/wst.2010.486
[16]
UN-Habitat (2014) The State of African Cities, 2014: Re-imagining Sustainable Urban Transitions. Kenya: UN-Habitat.
[17]
De Sherbinin A, Schiller A, Pulsipher A (2007) The vulnerability of global cities to climate hazards. Environ Urban 19: 39–64. https://doi.org/10.1177/0956247807076725 doi: 10.1177/0956247807076725
Sunday OA, Ajewole AI (2006) Implications of the changing pattern of landcover of the Lagos Coastal Area of Nigeria. Am-Eurasian J Sci Res 1: 31–37.
[20]
Lagos State Government-Ministry of the Environment (LASG-MoE) (2012) Lagos State Climate Change Policy 2012–2014.
[21]
Ogunleye M, Alo B (2011) State of the environment report-Lagos, 2010. Ministry of the Environment, Lagos State/Beachland Resources Limited.
[22]
Elias P, Omojola A (2015) Case study: the challenges of climate change for Lagos, Nigeria. Curr Opin Environ Sustain 13: 74–78. https://doi.org/10.1016/j.cosust.2015.02.008 doi: 10.1016/j.cosust.2015.02.008
[23]
Komolafe AA, Adegboyega SAA, Anifowose AYB, et al. (2014) Air pollution and climate change in Lagos, Nigeria: needs for proactive approaches to risk management and adaptation. Am J Environ Sci 10: 412. https://doi.org/10.3844/ajessp.2014.412.423 doi: 10.3844/ajessp.2014.412.423
[24]
Oshaniwa T, Chikwendu C (2013) Climate change mapping in some constituencies in Lagos State. Policy Advocacy Project Partnership on Climate Change (PAPPCC).
[25]
UNIDO (United Nations Industrial Development Organization) (2010) Climate change scenario and coastal risk analysis study of Lagos State of Nigeria.
Douglas I, Alam K, Maghenda M, et al. (2008) Unjust waters: climate change, flooding, and the urban poor in Africa. Environ Urban 20: 187–205. https://doi.org/10.1177/0956247808089156 doi: 10.1177/0956247808089156
[28]
Reddy BS, Assenza GB (2009) The great climate debate. Energy Policy 37: 2997–3008. https://doi.org/10.1016/j.enpol.2009.03.064 doi: 10.1016/j.enpol.2009.03.064
[29]
Alam M, Rabbani MDG (2007) Vulnerabilities and responses to climate change for Dhaka. Environ Urban 19: 81–97. https://doi.org/10.1177/0956247807076911 doi: 10.1177/0956247807076911
[30]
Awuor CB, Orindi VA, Ochieng Adwera A (2008) Climate change and coastal cities: the case of Mombasa, Kenya. Environ Urban 20: 231–242. https://doi.org/10.1177/0956247808089158 doi: 10.1177/0956247808089158
[31]
Castán Broto V, Oballa B, Junior P (2013) Governing climate change for a just city: Challenges and lessons from Maputo, Mozambique. Local Environ 18: 678–704. https://doi.org/10.1080/13549839.2013.801573 doi: 10.1080/13549839.2013.801573
[32]
Abam TKS, Ofoegbu CO, Osadebe CC, et al. (2000) Impact of hydrology on the Port-Harcourt–Patani-Warri Road. Environ Geol 40: 153–162. https://doi.org/10.1007/s002540000106 doi: 10.1007/s002540000106
[33]
NEMA (National Emergency Management Agency) (2013) Flood: NEMA urges governments stakeholders collaboration.
Adelekan IO (2010) Vulnerability of poor urban coastal communities to flooding in Lagos, Nigeria. Environ Urban 22: 433–451. https://doi.org/10.1177/0956247810380141 doi: 10.1177/0956247810380141
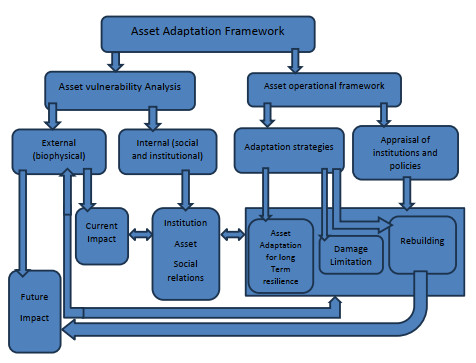
[36]
Moser C (2011) A conceptual and operational framework for pro-poor asset adaptation to urban climate change, In: Cities and Climate Change, 2011: 225–254.
[37]
Thomas DSG, Twyman C (2005) Equity and justice in climate change adaptation amongst natural-resource-dependent societies. Global Environ Change 15: 115–124. https://doi.org/10.1016/j.gloenvcha.2004.10.001 doi: 10.1016/j.gloenvcha.2004.10.001
[38]
Hoornweg D, Sugar L, Trejos Gomez CL (2011) Cities and greenhouse gas emissions: moving forward. Environ Urban 23: 207–227. https://doi.org/10.1177/0956247810392270 doi: 10.1177/0956247810392270
[39]
Kates RW, Travis WR, Wilbanks TJ (2012) Transformational adaptation when incremental adaptations to climate change are insufficient. Proc Natl Acad Sci 109: 7156–7161. https://doi.org/10.1073/pnas.1115521109 doi: 10.1073/pnas.1115521109
[40]
Kates RW (2000) Cautionary tales: adaptation and the global poor. Clim Change 45: 5–17. https://doi.org/10.1023/A:1005672413880 doi: 10.1023/A:1005672413880
[41]
Lemos MC, Agrawal A, Eakin H, et al. (2013) Building adaptive capacity to climate change in less developed countries, In: Asrar, G., Hurrell, J. Author, Climate Science for Serving Society, Dordrecht: Springer, 437–457. https://doi.org/10.1007/978-94-007-6692-1-16
[42]
While A, Whitehead M (2013) Cities, urbanisation, and climate change. Urban Stud 50: 1325–1331. https://doi.org/10.1177/0042098013480963 doi: 10.1177/0042098013480963
[43]
Barrett S (2012) The necessity of a multi-scalar analysis of climate justice. Prog Hum Geogr 37: 215–233. https://doi.org/10.1177/0309132512448270 doi: 10.1177/0309132512448270
[44]
Kelly PM, Adger WN (2000) Theory and practice in assessing vulnerability to climate change and facilitating adaptation. Clim Change 47: 325–352. https://doi.org/10.1023/A:1005627828199 doi: 10.1023/A:1005627828199
[45]
Adger WN, Huq S, Brown K, et al. (2003) Adaptation to climate change in the developing world. Prog Dev Stud 3: 179–195. https://doi.org/10.1191/1464993403ps060oa doi: 10.1191/1464993403ps060oa
Tanner T, Mitchell T (2008) Entrenchment or enhancement: could climate change adaptation help reduce chronic poverty?. Chron Poverty Res Cent Work Pap. doi: https://dx.doi.org/10.2139/ssrn.1629175. doi: 10.2139/ssrn.1629175
[50]
Moser CON (1998) The asset vulnerability framework: reassessing urban poverty reduction strategies. World Dev 26: 1–19. https://doi.org/10.1016/S0305-750X(97)10015-8 doi: 10.1016/S0305-750X(97)10015-8
[51]
Moser CON (2017) Gender transformation in a new global urban agenda: challenges for Habitat Ⅲ and beyond. Environ Urban 29: 221–236. https://doi.org/10.1177/0956247816662573 doi: 10.1177/0956247816662573
[52]
Ribot JC, Peluso NL (2003) A theory of access. Rural Sociol 68: 153–181. https://doi.org/10.1111/j.1549-0831.2003.tb00133.x doi: 10.1111/j.1549-0831.2003.tb00133.x
[53]
Mitlin D (2003) Addressing urban poverty through strengthening assets. Habitat Int 27: 393–406. https://doi.org/10.1016/S0197-3975(02)00066-8 doi: 10.1016/S0197-3975(02)00066-8
[54]
Rakodi C (2006) Relationships of power and place: the social construction of African cities. Geoforum 37: 312–317. https://doi.org/10.1016/j.geoforum.2005.10.001 doi: 10.1016/j.geoforum.2005.10.001
[55]
Bebbington A (1999) Capitals and capabilities: a framework for analysing peasant viability, rural livelihoods, and poverty. World Dev 27: 2021–2044. https://doi.org/10.1016/S0305-750X(99)00104-7 doi: 10.1016/S0305-750X(99)00104-7
[56]
Parnell S, Simon D, Vogel C (2007) Global Environmental Change: Conceptualising the growing challenge for cities in poor countries. Area 39: 357–369. https://doi.org/10.1111/j.1475-4762.2007.00760.x doi: 10.1111/j.1475-4762.2007.00760.x
Friend R, Moench M (2013) What is the purpose of urban climate resilience? Implications for addressing poverty and vulnerability. Urban Clim 6: 98–113. https://doi.org/10.1016/j.uclim.2013.09.002 doi: 10.1016/j.uclim.2013.09.002
[59]
Bulkeley H, Tuts R (2013) Understanding urban vulnerability, adaptation, and resilience in the context of climate change. Local Environ 18: 646–662. https://doi.org/10.1080/13549839.2013.788479 doi: 10.1080/13549839.2013.788479
[60]
Moser C, Stein A (2011) Implementing urban participatory climate change adaptation appraisals: a methodological guideline. Environ Urban 23: 463–485. https://doi.org/10.1177/0956247811418739 doi: 10.1177/0956247811418739
[61]
Füssel HM, Klein RJ (2006) Climate change vulnerability assessments: an evolution of conceptual thinking. Clim Change 75: 301–329. https://doi.org/10.1007/s10584-006-0329-3 doi: 10.1007/s10584-006-0329-3
[62]
Luers AL (2005) The surface of vulnerability: An analytical framework for examining environmental change. Global Environ Change 15: 214–223. https://doi.org/10.1016/j.gloenvcha.2005.04.003 doi: 10.1016/j.gloenvcha.2005.04.003
[63]
Yamin F, Rahman A, Huq S (2005) Vulnerability, adaptation and climate disasters: A conceptual overview. IDS Bull 36: 1–14.
[64]
Cannon T, Müller-Mahn D (2010) Vulnerability, resilience, and development discourses in context of climate change. Nat Hazard 55: 621–635. https://doi.org/10.1007/s11069-010-9499-4 doi: 10.1007/s11069-010-9499-4
[65]
Field CB, Barros V, Stocker T, et al. (2012) Managing the Risks of Extreme Events and Disasters to Advance Climate Change Adaptation: Special Report of the Intergovernmental Panel on Climate Change, Cambridge: Cambridge University Press, 30: 7575–7613. https://doi.org/10.1017/CBO9781139177245
[66]
Pelling M (2011) Adaptation to Climate Change from Resilience to Transformation. London: Taylor and Francis Books. https://doi.org/10.4324/9780203889046
[67]
Leichenko R (2011) Climate change and urban resilience. Curr Opin Environ Sustain 3: 164–168. https://doi.org/10.1016/j.cosust.2010.12.014 doi: 10.1016/j.cosust.2010.12.014
[68]
Mitchell T, Harris K (2012) Resilience: A risk management approach. ODI Backgr Note 2012: 1–7.
[69]
Nelson DR, Adger WN, Brown K (2007) Adaptation to environmental change: contributions of a resilience framework. Annu Rev Environ Resour 32: 395–419. https://doi.org/10.1146/annurev.energy.32.051807.090348 doi: 10.1146/annurev.energy.32.051807.090348
Béné C, Newsham A, Davies M, et al. (2014) Resilience, poverty, and development. J Int Dev 26: 598–623. https://doi.org/10.1002/jid.2992 doi: 10.1002/jid.2992
[72]
Pelling M, Dill K (2010) Disaster politics: tipping points for change in the adaptation of sociopolitical regimes. Prog Hum Geogr 34: 21–37. https://doi.org/10.1177/0309132509105004 doi: 10.1177/0309132509105004
[73]
Adger WN, Quinn T, Lorenzoni I, et al. (2013) Changing social contracts in climate-change adaptation. Nat Clim Chang 3: 330–333. https://doi.org/10.1038/nclimate1751 doi: 10.1038/nclimate1751
[74]
Eriksen SH, Nightingale AJ, Eakin H (2015) Reframing adaptation: the political nature of climate change adaptation. Glob Environ Change 35: 523–533. https://doi.org/10.1016/j.gloenvcha.2015.09.014 doi: 10.1016/j.gloenvcha.2015.09.014
[75]
Manuel‐Navarrete D (2010) Power, realism, and the ideal of human emancipation in a climate of change. Wiley Interdiscip Rev Clim Change 1: 781–785. https://doi.org/10.1002/wcc.87 doi: 10.1002/wcc.87
[76]
Revi A, Satterthwaite D, Aragón-Durand F, et al. (2014) Towards transformative adaptation in cities: the IPCC's Fifth Assessment. Environ Urban 26: 11–28. https://doi.org/10.1177/0956247814523539 doi: 10.1177/0956247814523539
[77]
Ribot J (2011) Vulnerability before adaptation: Toward transformative climate action. Glob Environ Change 21: 1160–1162. http://doi.org/10.1016/j.gloenvcha.2011.07.008 doi: 10.1016/j.gloenvcha.2011.07.008
[78]
Strengers Y (2010) Conceptualising everyday practices: composition, reproduction, and change. Carbon Neutral Communities Centre for Design, RMIT University.
[79]
Heinrichs D, Krellenberg K, Fragkias M (2013) Urban responses to climate change: theories and governance practice in cities of the global south. Int J Urban Reg Res 37: 1865–1878. https://doi.org/10.1111/1468-2427.12031 doi: 10.1111/1468-2427.12031
[80]
O'Brien K (2012) Global environmental change Ⅱ: from adaptation to deliberate transformation. Prog Hum Geogr 36: 667–676. https://doi.org/10.1177/0309132511425767 doi: 10.1177/0309132511425767
[81]
Woolcock M, Narayan D (2000) Social capital: Implications for development theory, research, and policy. World Bank Res Obs 15: 225–249. https://doi.org/10.1093/wbro/15.2.225 doi: 10.1093/wbro/15.2.225
[82]
Adger WN (2003) Social capital, collective action, and adaptation to climate change. Econ Geogr 79: 387–404. https://doi.org/10.1007/978-3-531-92258-4-19 doi: 10.1007/978-3-531-92258-4-19
[83]
Pelling M, High C (2005) Understanding adaptation: what can social capital offer assessments of adaptive capacity? Glob Environ Change 15: 308–319. https://doi.org/10.1016/j.gloenvcha.2005.02.001 doi: 10.1016/j.gloenvcha.2005.02.001
[84]
Bebbington A, Perreault T (1999) Social capital, development, and access to resources in highland Ecuador. Econ Geogr 75: 395–418. https://doi.org/10.1111/j.1944-8287.1999.tb00127.x doi: 10.1111/j.1944-8287.1999.tb00127.x
[85]
Luthans F, Luthans KW, Luthans BC (2004) Positive psychological capital: Beyond human and social capital. Bus Horiz 47: 45–50. https://doi.org/10.1016/j.bushor.2003.11.007 doi: 10.1016/j.bushor.2003.11.007
[86]
Becker GS (1994) Human capital revisited, In: Human Capital: A Theoretical and Empirical Analysis with Special Reference to Education, the University of Chicago Press.
[87]
Moser C (2008) Assets and livelihoods: a framework for asset-based social policy, In: Dani, A.A., Moser, C. Author, Assets, Livelihoods, and Social Policy, Washington DC: World Bank, 43–82.
[88]
Bassett TJ, Fogelman C (2013) Déjà vu or something new? The adaptation concept in the climate change literature. Geoforum 48: 42–53. https://doi.org/10.1016/j.geoforum.2013.04.010 doi: 10.1016/j.geoforum.2013.04.010
[89]
Creswell JW (2014) A Concise Introduction to Mixed Methods Research. Sage Publications.
[90]
Bryman A (2012) Social Research Methods. Oxford: Oxford University Press.
[91]
Desai V, Potter RB (2006) Doing Development Research. London: Sage. https://doi.org/10.4135/9781849208925
[92]
Olorunnimbe RO, Oni SI, Ege E, et al. (2022) Analysis of effects of prolonged travel delay on public bus operators' profit margin in metropolitan Lagos, Nigeria. J Sustain Dev Transp Logist 7: 112–126. https://doi.org/10.14254/jsdtl.2022.7-1.10 doi: 10.14254/jsdtl.2022.7-1.10
[93]
Lagos State Urban Renewal Authority (LASURA) (2013) Slum identification Handbook: A compendium of Nine (9) Major Slums in Lagos Metropolis. Lagos State Government Ministry of Physical Planning and Urban Development. Document obtained from LASURA office, Lagos Nigeria.
[94]
Sanchez-Rodriguez R (2009) Learning to adapt to climate change in urban areas. A review of recent contributions. Curr Opin Environ Sustain 1: 201–206. https://doi.org/10.1016/j.cosust.2009.10.005 doi: 10.1016/j.cosust.2009.10.005
[95]
Valentine G (2013) Tell me about … using interviews as a research methodology, In: Fowerdew, R., Martin, D. Author, Methods in Human Geograph, London: Routledge, 110–127.
[96]
Valentine G (1999) Being seen and heard? The ethical complexities of working with children and young people at home and at school. Ethics Place Environ 2: 141–155. https://doi.org/10.1080/1366879X.1999.11644243 doi: 10.1080/1366879X.1999.11644243
[97]
Berrang-Ford L, Ford JD, Paterson J (2011) Are we adapting to climate change? Glob Environ Change 21: 25–33. https://doi.org/10.1016/j.gloenvcha.2010.09.012 doi: 10.1016/j.gloenvcha.2010.09.012
[98]
Twum KO, Abubakari M (2019) Cities and floods: A pragmatic insight into the determinants of households' coping strategies to floods in informal Accra, Ghana. Jàmbá: J Disaster Risk Stud 11: 1–14. https://hdl.handle.net/10520/EJC-13b8ce4b99
[99]
Sakijege T, Lupala J, Sheuya S (2012) Flooding, flood risks and coping strategies in urban informal residential areas: The case of Keko Machungwa, Dar es Salaam, Tanzania. Jàmbá: J Disaster Risk Stud 4: 1–10. https://hdl.handle.net/10520/EJC125636
[100]
Chatterjee M (2010) Slum dwellers response to flooding events in the megacities of India. Mitigation Adapt Strategies Global Change 15: 337–353. https://doi.org/10.1007/s11027-010-9221-6 doi: 10.1007/s11027-010-9221-6
[101]
Wamsler C, Brink E (2014) Moving beyond short-term coping and adaptation. Environ Urban 26: 86–111. https://doi.org/10.1177/0956247813516061 doi: 10.1177/0956247813516061
[102]
Haque AN, Dodman D, Hossain MM (2014) Individual, communal, and institutional responses to climate change by low-income households in Khulna, Bangladesh. Environ Urban 26: 112–129. https://doi.org/10.1177/0956247813518681 doi: 10.1177/0956247813518681
[103]
Jooste BS, Dokken JV, Van Niekerk D, et al. (2018) Challenges to belief systems in the context of climate change adaptation. Jàmbá: J Disaster Risk Stud 10: 1–10. https://hdl.handle.net/10520/EJC-110b8aa4c0
[104]
Gaillard JC, Texier P (2010) Religions, natural hazards, and disasters: An introduction. Religion 40: 81–84. https://doi.org/10.1016/j.religion.2009.12.001 doi: 10.1016/j.religion.2009.12.001
[105]
Schuman S, Dokken JV, Van Niekerk D, et al. (2018) Religious beliefs and climate change adaptation: A study of three rural South African communities. Jàmbá: J Disaster Risk Stud 10: 1–12. https://hdl.handle.net/10520/EJC-122cafb0c5
[106]
Mitchell JT (2003) Prayer in disaster: Case study of Christian clergy. Nat Hazards Rev 4: 20–26. https://doi.org/10.1061/(ASCE)1527-6988(2003)4:1(20) doi: 10.1061/(ASCE)1527-6988(2003)4:1(20)
Billig M (2006) Is my home my castle? Place attachment, risk perception, and religious faith. Environ Behav 38: 248–265. https://doi.org/10.1177/0013916505277608 doi: 10.1177/0013916505277608
[109]
Scannell L, Gifford R (2013) Personally relevant climate change: The role of place attachment and local versus global message framing in engagement. Environ Behav 45: 60–85. https://doi.org/10.1177/0013916511421196 doi: 10.1177/0013916511421196
[110]
Ribot JC, Chhatre A, Lankina T (2008) Introduction: institutional choice and recognition in the formation and consolidation of local democracy. Conserv Soc 6: 1–11.
[111]
Omolara O (2022) An empirical analysis of the influence of values, worldview, and culture on the psychological processes in transformational adaptation. London J Res Humanit Soc Sci 22: 1–24.
[112]
O'Brien K, Hayward B, Berkes F (2009) Rethinking social contracts: building resilience in a changing climate. Ecol Soc 14: 12. https://www.jstor.org/stable/26268331
[113]
Shackleton S, Ziervogel G, Sallu S, et al. (2015) Why is socially‐just climate change adaptation in sub‐Saharan Africa so challenging? A review of barriers identified from empirical cases. Wiley Interdiscip Rev Clim Change 6: 321–344. https://doi.org/10.1002/wcc.335 doi: 10.1002/wcc.335
Lagos State Government Ministry of the Environment (2012) Ministerial press briefing. LASG-Ministry of the Environmnet (MoE).
[117]
Lagos State Government (2001) Environmental sanitation law 2000, supplement to the Lagos State of Nigeria official gazette extraordinary. Obtained from Agboyi Ketu Local Council Development Authority.
[118]
Oshodi L (2013) Flood management and governance structure in Lagos, Nigeria. Reg Mag 292: 22–24. https://doi.org/10.1080/13673882.2013.10815622 doi: 10.1080/13673882.2013.10815622
[119]
Soneye A (2014) An overview of humanitarian relief supply chains for victims of perennial flood disasters in Lagos, Nigeria (2010–2012). J Humanit Logist Supply Chain Manag 4: 179–197. https://doi.org/10.1108/JHLSCM-01-2014-0004 doi: 10.1108/JHLSCM-01-2014-0004
[120]
Nkwunonwo UC, Whiteworth M, Bailey B (2015) Review article: a review and critical analysis of the efforts towards urban flood reduction in the Lagos region of Nigeria. Nat Hazard Earth Syst Sci Discuss 3: 667–676. https://doi.org/10.5194/nhess-16-349-2016 doi: 10.5194/nhess-16-349-2016
[121]
Federal Ministry of Environment (2005) Technical guidelines on erosion and flood control and coastal zone management. Available from: https://environment.gov.ng/.
[122]
Fatti CE, Patel Z (2013) Perceptions and responses to urban flood risk: Implications for climate governance in the South. Appl Geogr 36: 13–22. https://doi.org/10.1016/j.apgeog.2012.06.011 doi: 10.1016/j.apgeog.2012.06.011
[123]
Adger WN, Dessai S, Goulden M, et al. (2009) Are there social limits to adaptation to climate change? Clim Change 93: 335–354. https://doi.org/10.1007/s10584-008-9520-z doi: 10.1007/s10584-008-9520-z
[124]
Harvatt J, Petts J, Chilvers J (2011) Understanding householder responses to natural hazards: flooding and sea‐level rise comparisons. J Risk Res 14: 63–83. https://doi.org/10.1080/13669877.2010.503935 doi: 10.1080/13669877.2010.503935
[125]
Graham S, Barnett J, Fincher R, et al. (2013) The social values at risk from sea-level rise. Environ Impact Assess Rev 41: 45–52. https://doi.org/10.1016/j.eiar.2013.02.002 doi: 10.1016/j.eiar.2013.02.002
[126]
Cheshire L (2015) 'Know your neighbours': disaster resilience and the normative practices of neighbouring in an urban context. Environ Plan A 47: 1081–1099. https://doi.org/10.1177/0308518X15592310 doi: 10.1177/0308518X15592310
[127]
Pelling M, O'Brien K, Matyas D (2015) Adaptation and transformation. Clim Change 133: 113–127. https://doi.org/10.1007/s10584-014-1303-0 doi: 10.1007/s10584-014-1303-0
[128]
Painter J, Jeffrey A (2012) Political Geography: An Introduction to Space and Power. London: Sage.
[129]
Carmen E, Fazey I, Ross H, et al. (2022) Building community resilience in a context of climate change: The role of social capital. Ambio 51: 1371–1387. https://doi.org/10.1007/s13280-021-01678-9 doi: 10.1007/s13280-021-01678-9
[130]
Fazey I, Carmen E, Ross H, et al. (2021) Social dynamics of community resilience building in the face of climate change: The case of three Scottish communities. Sustain Sci 16: 1731–1747. https://doi.org/10.1007/s11625-021-00950-x doi: 10.1007/s11625-021-00950-x
[131]
Olsson P, Gunderson LH, Carpenter SR, et al. (2006) Shooting the rapids: navigating transitions to adaptive governance of social-ecological systems. Ecol Soc 11. https://www.jstor.org/stable/26267806
[132]
Leck H, Roberts D (2015) What lies beneath: understanding the invisible aspects of municipal climate change governance. Curr Opin Environ Sustain 13: 61–67. https://doi.org/10.1016/j.cosust.2015.02.004 doi: 10.1016/j.cosust.2015.02.004
[133]
Ellis E (2006) Citizenship and property rights: A new look at social contract theory. J Polit 68: 544–555. https://doi.org/10.1111/j.1468-2508.2006.00444.x doi: 10.1111/j.1468-2508.2006.00444.x
[134]
Mishra S, Mazumdar S, Suar D (2010) Place attachment and flood preparedness. J Environ Psychol 30: 187–197. https://doi.org/10.1016/j.jenvp.2009.11.005 doi: 10.1016/j.jenvp.2009.11.005
[135]
Adger WN, Barnett J, Brown K, et al. (2013) Cultural dimensions of climate change impacts and adaptation. Nat Clim Change 3: 112–117. https://doi.org/10.1038/nclimate1666 doi: 10.1038/nclimate1666
[136]
Geschiere P, Jackson S (2006) Autochthony and the crisis of citizenship: democratization, decentralization, and the politics of belonging. Afr Stud Rev 49: 1–8. https://doi.10.1353/arw.2006.0104 doi: 10.1353/arw.2006.0104
[137]
Dunn KC (2009) 'Sons of the Soil' and Contemporary State Making: autochthony, uncertainty, and political violence in Africa, In: Third World Quarterly, London: Routledge, 30: 113–127.
[138]
Kraxberger B (2005) Strangers, indigenes, and settlers: contested geographies of citizenship in Nigeria. Space Polity 9: 9–27. https://doi.org/10.1080/13562570500078576 doi: 10.1080/13562570500078576
[139]
Adebanwi W (2009) Terror, territoriality and the struggle for indigeneity and citizenship in northern Nigeria. Citiz Stud 13: 349–363. https://doi.org/10.1080/13621020903011096 doi: 10.1080/13621020903011096
[140]
Cannon T (2008) Vulnerability, "innocent" disasters and the imperative of cultural understanding. Disaster Prev Manag 17: 350–357. https://doi.org/10.1108/09653560810887275 doi: 10.1108/09653560810887275
[141]
Shove E (2010) Beyond the ABC: Climate change policy and theories of social change. Environ Plan A 42: 1273–1285. https://doi.org/10.1068/a42282 doi: 10.1068/a42282
[142]
Kaika M (2017) 'Don't call me resilient again!' the New Urban Agenda as immunology… or… what happens when communities refuse to be vaccinated with 'smart cities' and indicators. Environ Urban 29: 89–102. https://doi.org/10.1177/0956247816684763 doi: 10.1177/0956247816684763
[143]
Pelling M (1998) Participation, social capital, and vulnerability to urban flooding in Guyana. J Int Dev 10: 469–486. https://doi.org/10.1002/(SICI)1099-1328(199806)10:4<469::AID-JID539>3.0.CO;2-4 doi: 10.1002/(SICI)1099-1328(199806)10:4<469::AID-JID539>3.0.CO;2-4
[144]
Fayombo OO (2021) Discursive constructions underlie and exacerbate the vulnerability of informal urban communities to the impacts of climate change. Clim Dev 13: 293–305. https://doi.org/10.1080/17565529.2020.1765133 doi: 10.1080/17565529.2020.1765133
[145]
Gasper R, Blohm A, Ruth M (2011) Social and economic impacts of climate change on the urban environment. Curr Opin Environ Sustain 3: 150–157. https://doi.org/10.1016/j.cosust.2010.12.009 doi: 10.1016/j.cosust.2010.12.009
Debadatta Adak, Abhijit Majumder, Nandadulal Bairagi,
Mathematical perspective of Covid-19 pandemic: Disease extinction criteria in deterministic and stochastic models,
2021,
142,
09600779,
110381,
10.1016/j.chaos.2020.110381
2.
Marouane Mahrouf, Adnane Boukhouima, Houssine Zine, El Mehdi Lotfi, Delfim F. M. Torres, Noura Yousfi,
Modeling and Forecasting of COVID-19 Spreading by Delayed Stochastic Differential Equations,
2021,
10,
2075-1680,
18,
10.3390/axioms10010018
3.
Rong Yuan, Yangjun Ma, Congcong Shen, Jinqing Zhao, Xiaofeng Luo, Maoxing Liu,
Global dynamics of COVID-19 epidemic model with recessive infection and isolation,
2021,
18,
1551-0018,
1833,
10.3934/mbe.2021095
4.
Michela Baccini, Giulia Cereda, Cecilia Viscardi, Simone Lolli,
The first wave of the SARS-CoV-2 epidemic in Tuscany (Italy): A SI2R2D compartmental model with uncertainty evaluation,
2021,
16,
1932-6203,
e0250029,
10.1371/journal.pone.0250029
5.
Eugene Furman, Alex Cressman, Saeha Shin, Alexey Kuznetsov, Fahad Razak, Amol Verma, Adam Diamant,
Prediction of personal protective equipment use in hospitals during COVID-19,
2021,
1386-9620,
10.1007/s10729-021-09561-5
6.
Xin Ai, Xinyu Liu, Yuting Ding, Han Li,
Dynamic Analysis of a COVID-19 Vaccination Model with a Positive Feedback Mechanism and Time-Delay,
2022,
10,
2227-7390,
1583,
10.3390/math10091583
7.
Christiana Tsiligianni, Aristeides Tsiligiannis, Christos Tsiliyannis,
A stochastic inventory model of COVID-19 and robust, real-time identification of carriers at large and infection rate via asymptotic laws,
2023,
304,
03772217,
42,
10.1016/j.ejor.2021.12.037
8.
N. Shamsi Gamchi, M. Esmaeili,
A novel mathematical model for prioritization of individuals to receive vaccine considering governmental health protocols,
2022,
1618-7598,
10.1007/s10198-022-01491-5
9.
Fractional order SIR epidemic model with Beddington–De Angelis incidence and Holling type II treatment rate for COVID-19,
2022,
68,
1598-5865,
3835,
10.1007/s12190-021-01658-y
10.
Kexin Chen, Chi Seng Pun, Hoi Ying Wong,
Efficient social distancing during the COVID-19 pandemic: Integrating economic and public health considerations,
2023,
304,
03772217,
84,
10.1016/j.ejor.2021.11.012
11.
Mateen Mahmood, Jorge Mateu, Enrique Hernández-Orallo,
Contextual contact tracing based on stochastic compartment modeling and spatial risk assessment,
2022,
36,
1436-3240,
893,
10.1007/s00477-021-02065-2
12.
Noureddine Ouerfelli, Narcisa Vrinceanu, Diana Coman, Adriana Lavinia Cioca,
Empirical Modeling of COVID-19 Evolution with High/Direct Impact on Public Health and Risk Assessment,
2022,
19,
1660-4601,
3707,
10.3390/ijerph19063707
13.
Shahriar Seddighi Chaharborj, Sarkhosh Seddighi Chaharborj, Jalal Hassanzadeh Asl, Pei See Phang,
Controlling of pandemic COVID-19 using optimal control theory,
2021,
26,
22113797,
104311,
10.1016/j.rinp.2021.104311
14.
Mireia Besalú, Giulia Binotto,
Time-dependent non-homogeneous stochastic epidemic model of SIR type,
2023,
8,
2473-6988,
23218,
10.3934/math.20231181
Olasimbo Fayombo. Everyday adaptations to flooding at the micro-levels of low-income communities and macro levels of authorities in the megacity of Lagos, Nigeria[J]. Urban Resilience and Sustainability, 2024, 2(2): 151-184. doi: 10.3934/urs.2024008