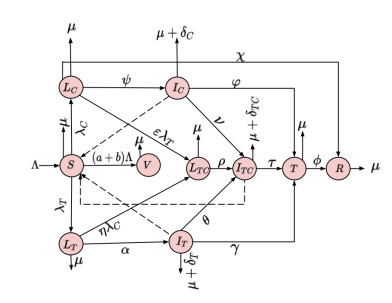
Both tuberculosis (TB) and COVID-19 are infectious diseases with similar clinical manifestations, which mainly affect the lungs. Clinical studies have revealed that the immunosuppressive drugs taken by COVID-19 patients can affect the immunological functions in the body, which can cause the patients to contract active TB via a new infection or reinfection, and the co-infection of the two diseases portends a clinical complexity in the management of the patients. Thus, this paper presents a mathematical model to study the dynamics and control of COVID-19-TB co-infection. The full model of the co-infection is split into two submodels, namely, the TB-only and the COVID-19-only models. The equilibria of the disease-free and endemic situations of the two sub-models are shown to be globally asymptotically stable when their control reproduction numbers $ R_{o}^{TV}, R_{o}^{CV} < 1 $ and $ \tilde {R}_{o}^{TV}, \tilde {R}_{o}^{CV} > 1 $, respectively. However, the disease-free equilibrium of the co-infection model was found to lose its global stability property when the reproduction number $ R_{o}^{F} < 1 $, therefore exhibiting a backward bifurcation. Uncertainty and sensitivity analysis of the associated reproduction number of the full model has been performed by using the Latin hypercube sampling/Pearson rank correlation coefficient (LHS/PRCC) method. The rate of transmission of COVID-19 and the proportions of individuals vaccinated with Bacillus Calmette-Guérin (BCG) and against COVID-19 were found to be highly significant in the spread and control of COVID-19-TB co-infection. Furthermore, the simulation results show that decreasing the COVID-19 transmission rate and increasing the proportion of people vaccinated with BCG and against COVID-19 can lower the number of cases of COVID-19-TB co-infection. Therefore, measures to reduce the transmission rate and the provision of adequate resources to increase the proportions of people vaccinated against TB and COVID-19 should be implemented to minimize the cases of co-infection.
Citation: J. O. Akanni, S. Ajao, S. F. Abimbade, Fatmawati. Dynamical analysis of COVID-19 and tuberculosis co-infection using mathematical modelling approach[J]. Mathematical Modelling and Control, 2024, 4(2): 208-229. doi: 10.3934/mmc.2024018
Both tuberculosis (TB) and COVID-19 are infectious diseases with similar clinical manifestations, which mainly affect the lungs. Clinical studies have revealed that the immunosuppressive drugs taken by COVID-19 patients can affect the immunological functions in the body, which can cause the patients to contract active TB via a new infection or reinfection, and the co-infection of the two diseases portends a clinical complexity in the management of the patients. Thus, this paper presents a mathematical model to study the dynamics and control of COVID-19-TB co-infection. The full model of the co-infection is split into two submodels, namely, the TB-only and the COVID-19-only models. The equilibria of the disease-free and endemic situations of the two sub-models are shown to be globally asymptotically stable when their control reproduction numbers $ R_{o}^{TV}, R_{o}^{CV} < 1 $ and $ \tilde {R}_{o}^{TV}, \tilde {R}_{o}^{CV} > 1 $, respectively. However, the disease-free equilibrium of the co-infection model was found to lose its global stability property when the reproduction number $ R_{o}^{F} < 1 $, therefore exhibiting a backward bifurcation. Uncertainty and sensitivity analysis of the associated reproduction number of the full model has been performed by using the Latin hypercube sampling/Pearson rank correlation coefficient (LHS/PRCC) method. The rate of transmission of COVID-19 and the proportions of individuals vaccinated with Bacillus Calmette-Guérin (BCG) and against COVID-19 were found to be highly significant in the spread and control of COVID-19-TB co-infection. Furthermore, the simulation results show that decreasing the COVID-19 transmission rate and increasing the proportion of people vaccinated with BCG and against COVID-19 can lower the number of cases of COVID-19-TB co-infection. Therefore, measures to reduce the transmission rate and the provision of adequate resources to increase the proportions of people vaccinated against TB and COVID-19 should be implemented to minimize the cases of co-infection.

| [1] | World Health Organization, Coronavirus disease (COVID-19), 2023. Available from: https://www.who.int/news-room/fact-sheets/detail/coronavirus-disease-(covid-19). |
| [2] | COVID-19, 2020. Available from: https://www.cdc.gov/coronavirus/2019-ncov/your-health/about-covid-19.html. |
| [3] | Tuberculosis (TB)-basic TB facts, 2019. Available from: https://www.cdc.gov/tb/topic/basics/default.html. |
| [4] | World Health Organization, Tuberculosis and COVID- 19, 2020. Available from: https://www.who.int/teams/global-tuberculosis-programme/covid-19. |
| [5] | H. Yang, S. Lu, COVID-19 and tuberculosis, J. Transl. Int. Med., 8 (2020), 59–65. https://doi.org/10.2478/jtim-2020-0010 |
| [6] |
G. T. Mousquer, A. Peres, M. Fiegenbaum, Pathology of TB/COVID-19 co-infection: the phantom menace, Tuberculosis, 126 (2021), 102020. https://doi.org/10.1016/j.tube.2020.102020 doi: 10.1016/j.tube.2020.102020

|
| [7] |
B. Diao, C. Wang, Y. Tan, X. Chen, Y. Liu, L. Ning, et al., Reduction and functional exhaustion of T cells in patients with coronavirus disease 2019 (COVID-19), Front. Immunol., 11 (2020), 827. https://doi.org/10.3389/fimmu.2020.00827 doi: 10.3389/fimmu.2020.00827
|
| [8] |
M. Khayat, H. Fan, Y. Vali, COVID-19 promoting the development of active tuberculosis in a patient with latent tuberculosis infection: a case report, Respir. Med. Case Rep., 32 (2021), 101344. https://doi.org/10.1016/j.rmcr.2021.101344 doi: 10.1016/j.rmcr.2021.101344
|
| [9] |
M. Tadolini, L. R. Codecasa, J. M. García-García, F. X. Blanc, S. Borisov, J. W. Alffenaar, et al., Active tuberculosis, sequelae and COVID-19 co-infection: first cohort of 49 cases, Eur. Respir. J., 56 (2020), 2001398. https://doi.org/10.1183/13993003.01398-2020 doi: 10.1183/13993003.01398-2020
|
| [10] |
A. Abdoli, S. Falahi, A. Kenarkoohi, COVID-19-associated opportunistic infections: a snapshot on the current reports, Clin. Exp. Med., 22 (2022), 327–346. https://doi.org/10.1007/s10238-021-00751-7 doi: 10.1007/s10238-021-00751-7
|
| [11] |
M. Kretzschmar, Disease modeling for public health: added value, challenges, and institutional constraints, J. Public Health Policy, 41 (2020), 39–51. https://doi.org/10.1057/s41271-019-00206-0 doi: 10.1057/s41271-019-00206-0
|
| [12] |
Y. Wu, M. Huang, X. Wang, Y. Li, L. Jiang, Y. Yuan, The prevention and control of tuberculosis: an analysis based on a tuberculosis dynamic model derived from the cases of Americans, BMC Publ. Health, 20 (2020), 1173. https://doi.org/10.1186/s12889-020-09260-w doi: 10.1186/s12889-020-09260-w
|
| [13] |
L. N. Nkamba, T. T. Manga, F. Agouanet, M. L. Mann Manyombe, Mathematical model to assess vaccination and effective contact rate impact in the spread of tuberculosis, J. Biol. Dyn., 13 (2019), 26–42. https://doi.org/10.1080/17513758.2018.1563218 doi: 10.1080/17513758.2018.1563218
|
| [14] |
S. Liu, Y. Bi, Y. Liu, Modeling and dynamic analysis of tuberculosis in mainland China from 1998 to 2017: the effect of DOTS strategy and further control, Theor. Biol. Med. Modell., 2020 (2020), 17. https://doi.org/10.1186/s12976-020-00124-9 doi: 10.1186/s12976-020-00124-9
|
| [15] |
K. C. Chong, C. C. Leung, W. W. Yew, B. C. Y. Zee, G. C. H. Tam, M. H. Wang, et al., Mathematical modelling of the impact of treating latent tuberculosis infection in the elderly in a city with intermediate tuberculosis burden. Sci. Rep., 9 (2019), 4869. https://doi.org/10.1038/s41598-019-41256-4 doi: 10.1038/s41598-019-41256-4
|
| [16] |
T. A. Perkins, G. Espa$\tilde{n}$a, Optimal control of the COVID-19 pandemic with non-pharmaceutical interventions, Bull. Math. Biol., 82 (2020), 118. https://doi.org/10.1007/s11538-020-00795-y doi: 10.1007/s11538-020-00795-y
|
| [17] |
S. I. Oke, M. I. Ekum, O. J. Akintande, M. O. Adeniyi, T. A. Adekiya, O. J. Achadu, et al., Optimal control of the coronavirus pandemic with both pharmaceutical and non-pharmaceutical interventions, Int. J. Dyn. Control, 11 (2023), 2295–2319. https://doi.org/10.1007/s40435-022-01112-2 doi: 10.1007/s40435-022-01112-2
|
| [18] |
M. Zamir, F. Nadeem, M. A. Alqudah, T. Abdeljawad, Future implications of COVID-19 through mathematical modeling, Results Phys., 33 (2022), 105097. https://doi.org/10.1016/j.rinp.2021.105097 doi: 10.1016/j.rinp.2021.105097
|
| [19] |
L. Masandawa, S. S. Mirau, I. S. Mbalawata, Mathematical modeling of COVID-19 transmission dynamics between healthcare workers and community, Results Phys., 29 (2021), 104731. https://doi.org/10.1016/j.rinp.2021.104731 doi: 10.1016/j.rinp.2021.104731
|
| [20] |
A. O. Atede, A. Omame, S. C. Inyama, A fractional order vaccination model for COVID-19 incorporating environmental transmission: a case study using Nigerian data, Bull. Biomath., 1 (2023), 78–110. https://doi.org/10.59292/bulletinbiomath.2023005 doi: 10.59292/bulletinbiomath.2023005
|
| [21] |
B. Yang, Z. Yu, Y. Cai, The impact of vaccination on the spread of COVID-19: studying by a mathematical model, Phys. A, 590 (2022), 12671. https://doi.org/10.1016/j.physa.2021.126717 doi: 10.1016/j.physa.2021.126717
|
| [22] |
A. Kouidere, O. Balatif, M. Rachik, Cost-effectiveness of a mathematical modeling with optimal control approach of spread of COVID-19 pandemic: a case study in Peru, Chaos Solitons Fract., 10 (2023), 100090. https://doi.org/10.1016/j.csfx.2022.100090 doi: 10.1016/j.csfx.2022.100090
|
| [23] |
C. N. Ngonghala, E. Iboi, S. Eikenberry, M. Scotch, C. R. MacIntyre, M. H. Bonds, et al., Mathematical assessment of the impact of non-pharmaceutical interventions on curtailing the 2019 novel Coronavirus, Math. Biosci., 325 (2020), 108364. https://doi.org/10.1016/j.mbs.2020.108364 doi: 10.1016/j.mbs.2020.108364
|
| [24] |
O. Sharomi, C. N. Podder, A. B. Gumel, B. Song, Mathematical analysis of the transmission dynamics of HIV/TB coinfection in the presence of treatment, Math. Biosci. Eng., 5 (2008), 145–174. https://doi.org/10.3934/mbe.2008.5.145 doi: 10.3934/mbe.2008.5.145
|
| [25] |
Z. Mukandavire, A. B. Gumel, W. Garira, J. M. Tchuenche, Mathematical analysis of a model for HIV-malaria co-infection, Math. Biosci. Eng., 6 (2009), 333–362. https://doi.org/10.3934/mbe.2009.6.333 doi: 10.3934/mbe.2009.6.333
|
| [26] |
H. T. Alemneh, A co-infection model of dengue and leptospirosis diseases, Adv. Differ. Equations, 2020 (2020), 664. https://doi.org/10.1186/s13662-020-03126-6 doi: 10.1186/s13662-020-03126-6
|
| [27] |
I. M. Hezam, A. Foul, A. Alrasheedi, A dynamic optimal control model for COVID-19 and cholera co-infection in Yemen, Adv. Differ. Equations, 2021 (2021), 108. htttps://doi.org/10.1186/s13662-021-03271-6 doi: 10.1186/s13662-021-03271-6
|
| [28] |
V. Guseva, N. Doktorova, O. Krivorotko, O. Otpushchennikova, L. Parolina, I. Vasilyeva, et al., Building a seir-model for predicting the HIV/tuberculosis coinfection epidemic for russian territories with low TB burden, Int. J. Infect. Dis., 134 (2023), S4-S5. https://doi.org/10.1016/j.ijid.2023.05.028 doi: 10.1016/j.ijid.2023.05.028
|
| [29] |
A. Ahmad, M. Farman, A. Akgül, N. Bukhari, S. Imtiaz, Mathematical analysis and numerical simulation of co-infection of TB-HIV, Arab J. Basic Appl. Sci., 27 (2020), 431–441. https://doi.org/10.1080/25765299.2020.1840771 doi: 10.1080/25765299.2020.1840771
|
| [30] |
A. Omame, A. D. Okuonghae, U. E. Nwafor, B. U. Odionyenma, A co-infection model for HPV and syphilis with optimal control and cost-effectiveness analysis, Int. J. Biomath., 14 (2021), 2150050. https://doi.org/10.1142/S1793524521500509 doi: 10.1142/S1793524521500509
|
| [31] |
A. Omame, M. Abbas, C. P. Onyenegecha, A fractional-order model for COVID-19 and tuberculosis co-infection using Atangana-Baleanu derivative, Chaos Solitons Fract., 153 (2021), 111486. https://doi.org/10.1016/j.chaos.2021.111486 doi: 10.1016/j.chaos.2021.111486
|
| [32] |
A. Omame, M. Abbas, C. P. Onyenegecha, A fractional order model for the co-interaction of COVID-19 and Hepatitis B virus, Results Phys., 37 (2022), 105498. https://doi.org/10.1016/j.rinp.2022.105498 doi: 10.1016/j.rinp.2022.105498
|
| [33] |
H. Rwezaura, M. L. Diagne, A. Omame, A. L. de Espindola, J. M. Tchuenche, Mathematical modeling and optimal control of SARS-CoV-2 and tuberculosis co-infection: a case study of Indonesia, Model. Earth Syst. Environ., 8 (2022), 5493–5520. https://doi.org/10.1007/s40808-022-01430-6 doi: 10.1007/s40808-022-01430-6
|
| [34] |
R. I. Gweryina, C. E. Madubueze, V. P. Bajiya, F. E. Esla, Modeling and analysis of tuberculosis and pneumonia co-infection dynamics with cost-effective strategies, Results Control Optim., 10 (2023), 100210. https://doi.org/10.1016/j.rico.2023.100210 doi: 10.1016/j.rico.2023.100210
|
| [35] |
K. G. Mekonen, L. L. Obsu, Mathematical modeling and analysis for the co-infection of COVID-19 and tubercu-losis, Heliyon, 8 (2022), e11195. https://doi.org/10.1016/j.heliyon.2022.e11195 doi: 10.1016/j.heliyon.2022.e11195
|
| [36] |
K. G. Mekonen, S. F. Balcha, L. L. Obsu, A. Hassen, Mathematical modeling and analysis of TB and COVID-19 coinfection, J. Appl. Math., 2022 (2022), 2449710. https://doi.org/10.1155/2022/2449710 doi: 10.1155/2022/2449710
|
| [37] |
A. Selvam, S. Sabarinathan, B. V. S. Kumar, H. Byeon, K. Guedri, S. M. Eldin, et al., Ulam-Hyers stability of tuberculosis and COVID-19 co-infection model under Atangana-Baleanu fractal-fractional operator, Sci. Rep., 13 (2023), 9012. https://doi.org/10.1038/s41598-023-35624-4 doi: 10.1038/s41598-023-35624-4
|
| [38] |
S. R. Bandekar, M. Ghosh, A co-infection model on TB- COVID-19 with optimal control and sensitivity analysis, Math. Comput. Simul., 200 (2022), 1–31. https://doi.org/10.1016/j.matcom.2022.04.001 doi: 10.1016/j.matcom.2022.04.001
|
| [39] |
F. Inayaturohmat, N. Anggriani, A. K. Supriatna, A mathematical model of tuberculosis and COVID-19 coinfection with the effect of isolation and treatment, Front. Appl. Math. Stat., 8 (2022), 958081. htttps://doi.org/10.3389/fams.2022.958081 doi: 10.3389/fams.2022.958081
|
| [40] |
Z. S. Kifle, L. L. Obsu, Co-dynamics of COVID-19 and TB with COVID-19 vaccination and exogenous reinfection for TB: an optimal control application, Infect. Dis. Modell., 8 (2023), 574–602. https://doi.org/10.1016/j.idm.2023.05.005 doi: 10.1016/j.idm.2023.05.005
|
| [41] |
S. W. Teklu, Y. F. Abebaw, B. B. Terefe, D. K. Mamo, HIV/AIDS and TB co-infection deterministic model bifurcation and optimal control analysis, Inf. Med. Unlocked, 41 (2023), 101328. https://doi.org/10.1016/j.imu.2023.101328 doi: 10.1016/j.imu.2023.101328
|
| [42] |
B. S. Kotola, S. W. Teklu, Y. F. Abebaw, Bifurcation and optimal control analysis of HIV/AIDS and COVID-19 co-infection model with numerical simulation, PLoS One, 18 (2023), e0284759. https://doi.org/10.1371/journal.pone.0284759 doi: 10.1371/journal.pone.0284759
|
| [43] |
S. W. Teklu, Mathematical analysis of the transmission dynamics of COVID-19 infection in the presence of intervention strategies, J. Biol. Dyn., 16 (2022), 640–664. https://doi.org/10.1080/17513758.2022.2111469 doi: 10.1080/17513758.2022.2111469
|
| [44] |
S. W. Teklu, B. B. Terefe, D. K. Mamo, Y. F. Abebaw, Optimal control strategies on HIV/AIDS and pneumonia co-infection with mathematical modelling approach, J. Biol. Dyn., 18 (2024), 2288873. https://doi.org/10.1080/17513758.2023.2288873 doi: 10.1080/17513758.2023.2288873
|
| [45] |
D. Okuonghae, S. Omosigho, Analysis of a mathematical model for tuberculosis: what could be done to increase case detection, J. Theor. Biol., 269 (2011), 31–45. https://doi.org/10.1016/j.jtbi.2010.09.044 doi: 10.1016/j.jtbi.2010.09.044
|
| [46] |
S. M. Garba, J. M. S. Lubuma, B. Tsanou, Modeling the transmission dynamics of the COVID-19 pandemic in South Africa, Math. Biosci., 328 (2020), 108441. https://doi.org/10.1016/j.mbs.2020.108441 doi: 10.1016/j.mbs.2020.108441
|
| [47] |
S. A. Lauer, K. H. Grantz, Q. Bi, F. K. Jones, Q. Zheng, H. R. Meredith, et al., The incubation period of coronavirus disease 2019 (COVID-19) from publicly reported confirmed cases: estimation and application, Ann. Int. Med., 172 (2020), 9. https://doi.org/10.7326/M20-0504 doi: 10.7326/M20-0504
|
| [48] |
A. Alemu, Z. W. Bitew, G. Seid, G. Diriba, E. Gashu, N. Berhe, et al., Tuberculosis in individuals who recovered from COVID-19: a systematic review of case reports, PLOS One, 17 (2022), 0277807. https://doi.org/10.1371/journal.pone.0277807 doi: 10.1371/journal.pone.0277807
|
| [49] |
D. Okuonghae, A. Omame, Analysis of a mathematical model for COVID-19 population dynamics in Lagos, Nigeria, Chaos Solitons Fract., 139 (2020), 110032. https://doi.org/10.1016/j.chaos.2020.110032 doi: 10.1016/j.chaos.2020.110032
|
| [50] | C. Castillo-Chavez, Z. Feng, W. Huang, On the computation of R0 and its role in global stability, Inst. Math. Appl., 125 (2002), 229. |
| [51] |
P. van den Driessche, J. Watmough, Reproduction numbers and sub-threshold endemic equilibria for compartmental models of disease transmission, Math. Biosci., 180 (2002), 29–48. https://doi.org/10.1016/s0025-5564(02)00108-6 doi: 10.1016/s0025-5564(02)00108-6
|
| [52] | J. P. LaSalle, The stability of dynamical systems, Society for Industrial and Applied Mathematics, 1976. |
| [53] |
J. O. Akanni, A non-linear optimal control model for illicit drug use and terrorism dynamics in developing countries with time-dependent control variables, Decis. Anal. J., 8 (2023), 100281. https://doi.org/10.1016/j.dajour.2023.100281 doi: 10.1016/j.dajour.2023.100281
|
| [54] |
C. Castillo-Chavez, B. Song, Dynamical models of tuberculosis and their applications, Math. Biosci. Eng., 1 (2004), 361–404. https://doi.org/10.3934/mbe.2004.1.361 doi: 10.3934/mbe.2004.1.361
|
| [55] |
A. Abidemi, J. O. Akanni, O. D. Makinde, A non-linear mathematical model for analysing the impact of COVID-19 disease on higher education in developing countries, Healthcare Anal., 3 (2023), 100193. https://doi.org/10.1016/j.health.2023.100193 doi: 10.1016/j.health.2023.100193
|
| [56] |
S. M. Blower, H. Dowlatabadi, Sensitivity and uncertainty analysis of complex models of disease transmission: an HIV model, as an example, Int. Stat. Rev., 62 (1994), 229–243. https://doi.org/10.2307/1403510 doi: 10.2307/1403510
|
| [57] |
M. A. Sanchez, S. M. Blower, Uncertainty and sensitivity analysis of the basic reproductive rate: tuberculosis as an example, Amer. J. Epidemiol., 145 (1997), 1127–1137. https://doi.org/10.1093/oxfordjournals.aje.a009076 doi: 10.1093/oxfordjournals.aje.a009076
|
| [58] |
J. Wu, R. Dhingra, M. Gambhir, J. V. Remais, Sensitivity analysis of infectious disease models: methods, advances and their application, J. R. Soc. Interface, 10 (2013), 1018. https://doi.org/10.1098/rsif.2012.1018 doi: 10.1098/rsif.2012.1018
|
| [59] |
S. Olaniyi, J. O. Akanni, O. A. Adepoju, Optimal control and cost-effectiveness analysis of an illicit drug use population dynamics, J. Appl. Nonlinear Dyn., 12 (2023), 133–146. https://doi.org/10.5890/JAND.2023.03.010 doi: 10.5890/JAND.2023.03.010
|


Figures(12) / Tables(3)
J. O. Akanni, S. Ajao, S. F. Abimbade, Fatmawati. Dynamical analysis of COVID-19 and tuberculosis co-infection using mathematical modelling approach[J]. Mathematical Modelling and Control, 2024, 4(2): 208-229. doi: 10.3934/mmc.2024018


 DownLoad: