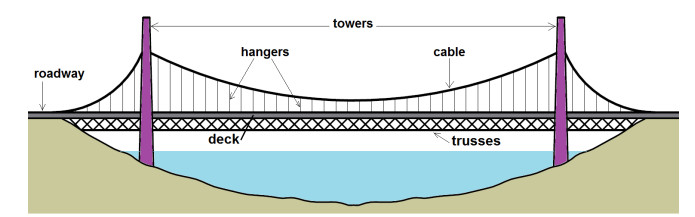
We give a new full explanation of the Tacoma Narrows Bridge collapse, occurred on November 7, 1940. Our explanation involves both structural phenomena, such as parametric resonances, and sophisticated mathematical tools, such as the Floquet theory. Contrary to all previous attempts, our explanation perfectly fits, both qualitatively and quantitatively, with what was observed that day. With this explanation at hand, we set up and partially solve some optimal control and shape optimization problems (both analytically and numerically) aiming to improve the stability of bridges. The control parameter to be optimized is the strength of a partial damping term whose role is to decrease the energy within the deck. Shape optimization intends to give suggestions for the design of future bridges.
Citation: Filippo Gazzola, Mohamed Jleli, Bessem Samet. A new detailed explanation of the Tacoma collapse and some optimization problems to improve the stability of suspension bridges[J]. Mathematics in Engineering, 2023, 5(2): 1-35. doi: 10.3934/mine.2023045
We give a new full explanation of the Tacoma Narrows Bridge collapse, occurred on November 7, 1940. Our explanation involves both structural phenomena, such as parametric resonances, and sophisticated mathematical tools, such as the Floquet theory. Contrary to all previous attempts, our explanation perfectly fits, both qualitatively and quantitatively, with what was observed that day. With this explanation at hand, we set up and partially solve some optimal control and shape optimization problems (both analytically and numerically) aiming to improve the stability of bridges. The control parameter to be optimized is the strength of a partial damping term whose role is to decrease the energy within the deck. Shape optimization intends to give suggestions for the design of future bridges.

| [1] | B. Akesson, Understanding bridges collapses, London: CRC Press, Taylor & Francis Group, 2008. |
| [2] | O. H. Ammann, T. von Kármán, G. B. Woodruff, The failure of the Tacoma Narrows Bridge, Technical Report, Washington D.C.: Federal Works Agency, 1941. |
| [3] | Annales des ponts et chaussées: Rapport de la Commission d'enquête nommée par arrêté de M. le Préfet de Maine-et-Loire, en date du 20 avril 1850, pour rechercher les causes et les circonstances qui ont amené la chûte du pont suspendu de la Baisse-Chaîne, 1850. |
| [4] | Anonymous, Fall of the Broughton Suspension Bridge, near Manchester, The Manchester Guardian, Vol. 9, No. 53, 1831,384–389. |
| [5] |
P. R. S. Antunes, F. Gazzola, Some solutions of minimaxmax problems for the torsional displacements of rectangular plates, ZAMM-Z. Angew. Math. Mech., 98 (2018), 1974–1991. http://doi.org/10.1002/zamm.201800065 doi: 10.1002/zamm.201800065

|
| [6] | E. Arioglu, Importance of "heuristics" in suspension bridge engineering and 1915 Çanakkale bridge, In: Developments in international bridge engineering, Cham: Springer, 2021, 19–41. http://doi.org/10.1007/978-3-030-59169-4_2 |
| [7] |
G. Arioli, F. Gazzola, A new mathematical explanation of what triggered the catastrophic torsional mode of the Tacoma Narrows Bridge collapse, Appl. Math. Model., 39 (2015), 901–912. http://doi.org/10.1016/j.apm.2014.06.022 doi: 10.1016/j.apm.2014.06.022
|
| [8] |
G. Arioli, F. Gazzola, On a nonlinear nonlocal hyperbolic system modeling suspension bridges, Milan J. Math., 83 (2015), 211–236. http://doi.org/10.1007/s00032-015-0239-9 doi: 10.1007/s00032-015-0239-9
|
| [9] |
G. Arioli, F. Gazzola, Torsional instability in suspension bridges: the Tacoma Narrows Bridge case, Commun. Nonlinear Sci. Numer. Simulat., 42 (2017), 342–357. http://doi.org/10.1016/j.cnsns.2016.05.028 doi: 10.1016/j.cnsns.2016.05.028
|
| [10] | A Great bridge falls, The New York Times, November 9, 1940. |
| [11] |
J. R. Banerjee, A simplified method for the free vibration and flutter analysis of bridge decks, J. Sound Vib., 260 (2003), 829–845. http://doi.org/10.1016/S0022-460X(02)00929-X doi: 10.1016/S0022-460X(02)00929-X
|
| [12] |
U. Battisti, E. Berchio, A. Ferrero, F. Gazzola, Energy transfer between modes in a nonlinear beam equation, J. Math. Pure. Appl., 108 (2017), 885–917. http://doi.org/10.1016/j.matpur.2017.05.010 doi: 10.1016/j.matpur.2017.05.010
|
| [13] |
J. A. Bello, E. Fernández-Cara, J. Lemoine, J. Simon, The differentiability of the drag with respect to the variations of a Lipschitz domain in a Navier-Stokes flow, SIAM J. Control Optim., 35 (1997), 626–640. http://doi.org/10.1137/S0363012994278213 doi: 10.1137/S0363012994278213
|
| [14] |
V. Benci, D. Fortunato, F. Gazzola, Existence of torsional solitons in a beam model of suspension bridge, Arch. Rational Mech. Anal., 226 (2017), 559–585. http://doi.org/10.1007/s00205-017-1138-8 doi: 10.1007/s00205-017-1138-8
|
| [15] | E. Berchio, D. Buoso, F. Gazzola, A measure of the torsional performances of partially hinged rectangular plates, In: Integral methods in science and engineering, Cham: Birkäuser, 2017, 35–46. http://doi.org/10.1007/978-3-319-59384-5_4 |
| [16] |
E. Berchio, D. Buoso, F. Gazzola, On the variation of longitudinal and torsional frequencies in a partially hinged rectangular plate, ESAIM: COCV, 24 (2018), 63–87. http://doi.org/10.1051/cocv/2016076 doi: 10.1051/cocv/2016076
|
| [17] |
E. Berchio, D. Buoso, F. Gazzola, D. Zucco, A minimaxmax problem for improving the torsional stability of rectangular plates, J. Optim. Theory Appl., 177 (2018), 64–92. http://doi.org/10.1007/s10957-018-1261-1 doi: 10.1007/s10957-018-1261-1
|
| [18] |
E. Berchio, A. Falocchi, About symmetry in partially hinged composite plates, Appl. Math. Optim., 84 (2021), 2645–2669. http://doi.org/10.1007/s00245-020-09722-y doi: 10.1007/s00245-020-09722-y
|
| [19] |
E. Berchio, A. Falocchi, Maximizing the ratio of eigenvalues of non-homogeneous partially hinged plates, J. Spectr. Theory, 11 (2021), 743–780. http://doi.org/10.4171/JST/355 doi: 10.4171/JST/355
|
| [20] | E. Berchio, A. Falocchi, Some remarks about a worst-case problem for the torsional response of a plate, In: Interactions between elasticity and fluid dynamics, EMS Press, in press. |
| [21] |
E. Berchio, A. Falocchi, A. Ferrero, D. Ganguly, On the first frequency of reinforced partially hinged plates, Commun. Contemp, Math., 23 (2021), 1950074. http://doi.org/10.1142/S0219199719500743 doi: 10.1142/S0219199719500743
|
| [22] |
E. Berchio, A. Falocchi, M. Garrione, On the stability of a nonlinear nonhomogeneous multiply hinged beam, SIAM J. Appl. Dyn. Syst., 20 (2021), 908–940. http://doi.org/10.1137/20M1374109 doi: 10.1137/20M1374109
|
| [23] |
E. Berchio, A. Ferrero, F. Gazzola, Structural instability of nonlinear plates modelling suspension bridges: mathematical answers to some long-standing questions, Nonlinear Anal. Real, 28 (2016), 91–125. http://doi.org/10.1016/j.nonrwa.2015.09.005 doi: 10.1016/j.nonrwa.2015.09.005
|
| [24] |
E. Berchio, F. Gazzola, A qualitative explanation of the origin of torsional instability in suspension bridges, Nonlinear Anal. Theor., 121 (2015), 54–72. http://doi.org/10.1016/j.na.2014.10.026 doi: 10.1016/j.na.2014.10.026
|
| [25] |
E. Berchio, F. Gazzola, The role of aerodynamic forces in a mathematical model for suspension bridges, Conference Publications, 2015 (2015), 112–121. http://doi.org/10.3934/proc.2015.0112 doi: 10.3934/proc.2015.0112
|
| [26] |
E. Berchio, F. Gazzola, C. Zanini, Which residual mode captures the energy of the dominating mode in second order Hamiltonian systems?, SIAM J. Appl. Dyn. Syst., 15 (2016), 338–355. http://doi.org/10.1137/140990577 doi: 10.1137/140990577
|
| [27] |
K. Y. Billah, R. H. Scanlan, Resonance, Tacoma Narrows Bridge failure, and undergraduate physics textbooks, Amer. J. Phys., 59 (1991), 118–124. http://doi.org/10.1119/1.16590 doi: 10.1119/1.16590
|
| [28] |
D. Bonheure, F. Gazzola, I. Lasiecka, J. Webster, Long-time dynamics of a hinged-free plate driven by a nonconservative force, Ann. Inst. H. Poincaré Anal. Non Linéaire, 39 (2022), 457–500. http://doi.org/10.4171/AIHPC/13 doi: 10.4171/AIHPC/13
|
| [29] |
D. Bonheure, F. Gazzola, E. M. dos Santos, Periodic solutions and torsional instability in a nonlinear nonlocal plate equation, SIAM J. Math. Anal., 51 (2019), 3052–3091. http://doi.org/10.1137/18M1221242 doi: 10.1137/18M1221242
|
| [30] |
D. Bonheure, F. Gazzola, G. Sperone, Eight(y) mathematical questions on fluids and structures, Atti Accad. Naz. Lincei Cl. Sci. Fis. Mat. Natur., 30 (2019), 759–815. http://doi.org/10.4171/RLM/870 doi: 10.4171/RLM/870
|
| [31] | P. Cannarsa, F. Gazzola, Dynamic optimization for beginners – with prerequisites and applications, EMS, 2021. |
| [32] |
H. Cao, X. Qian, Z. Chen, H. Zhu, Layout and size optimization of suspension bridges based on coupled modelling approach and enhanced particle swarm optimization, Eng. Struct., 146 (2017), 170–183. http://doi.org/10.1016/j.engstruct.2017.05.048 doi: 10.1016/j.engstruct.2017.05.048
|
| [33] |
A. Capsoni, R. Ardito, A. Guerrieri, Stability of dynamic response of suspension bridges, J. Sound Vib., 393 (2017), 285–307. http://doi.org/10.1016/j.jsv.2017.01.009 doi: 10.1016/j.jsv.2017.01.009
|
| [34] |
S. Chanillo, C. E. Kenig, T. To, Regularity of the minimizers in the composite membrane problem in $ \mathbb{R}^2$, J. Funct. Anal., 255 (2008), 2299–2320. http://doi.org/10.1016/j.jfa.2008.04.015 doi: 10.1016/j.jfa.2008.04.015
|
| [35] |
S. Chanillo, C. E. Kenig, Weak uniqueness and partial regularity for the composite membrane problem, J. Eur. Math. Soc., 10 (2008), 705–737. http://doi.org/10.4171/JEMS/127 doi: 10.4171/JEMS/127
|
| [36] | C. Chicone, Ordinary differential equations with applications, 2 Eds., New York: Springer, 2006. http://doi.org/10.1007/0-387-35794-7 |
| [37] |
J. Chu, M. Garrione, F. Gazzola, Stability analysis in some strongly prestressed rectangular plates, Evol. Equ. Control Theory, 9 (2020), 275–299. http://doi.org/10.3934/eect.2020006 doi: 10.3934/eect.2020006
|
| [38] |
G. Crasta, A. Falocchi, F. Gazzola, A new model for suspension bridges involving the convexification of the cables, Z. Angew. Math. Phys., 71 (2020), 93. http://doi.org/10.1007/s00033-020-01316-6 doi: 10.1007/s00033-020-01316-6
|
| [39] | Destruction of the Wheeling Suspension Bridge, The Intelligencer, Wheeling, Va., Vol. 2, no. 225, p. 3, Thursday, May 18, 1854. |
| [40] | Eurocode 1: Actions on structures – Part 1–4: General actions-Wind actions, The European Union Per Regulation 305/2011, Directive 98/34/EC & 2004/18/EC. Available from: http://www.phd.eng.br/wp-content/uploads/2015/12/en.1991.1.4.2005.pdf. |
| [41] |
A. Falocchi, Torsional instability in a nonlinear isolated model for suspension bridges with fixed cables and extensible hangers, IMA J. Appl. Math., 83 (2018), 1007–1036. http://doi.org/10.1093/imamat/hxy032 doi: 10.1093/imamat/hxy032
|
| [42] |
A. Falocchi, Torsional instability and sensitivity analysis in a suspension bridge model related to the Melan equation, Commun. Nonlinear Sci. Numer. Simul., 67 (2019), 60–75. http://doi.org/10.1016/j.cnsns.2018.07.005 doi: 10.1016/j.cnsns.2018.07.005
|
| [43] | A. Falocchi, Optimization of the structural performance of non-homogeneous partially hinged rectangular plates, In: Geometric properties for parabolic and elliptic PDE's, Cham: Springer, 2021, 43–65. http://doi.org/10.1007/978-3-030-73363-6_3 |
| [44] |
S. Farhangdoust, P. Eghbali, D. Younesian, Bistable tuned mass damper for suppressing the vortex induced vibrations in suspension bridges, Earthq. Struct., 18 (2020), 313–320. http://doi.org/10.12989/eas.2020.18.3.313 doi: 10.12989/eas.2020.18.3.313
|
| [45] | F. B. Farquharson, Letter to the Editor, ENR, July 3, 1941, 1–37. |
| [46] |
V. Ferreira, F. Gazzola, E. M. dos Santos, Instability of modes in a partially hinged rectangular plate, J. Differ. Equations, 261 (2016), 6302–6340. http://doi.org/10.1016/j.jde.2016.08.037 doi: 10.1016/j.jde.2016.08.037
|
| [47] |
A. Ferrero, An orthotropic plate model for decks of suspension bridges, Nonlinear Anal. Real, 68 (2022), 103701. http://doi.org/10.1016/j.nonrwa.2022.103701 doi: 10.1016/j.nonrwa.2022.103701
|
| [48] | A. Ferrero, A note on an orthotropic plate model describing the deck of a bridge, 2021, arXiv: 2110.00421. |
| [49] |
A. Ferrero, F. Gazzola, A partially hinged rectangular plate as a model for suspension bridges, Discrete Cont. Dyn. Syst., 35 (2015), 5879–5908. http://doi.org/10.3934/dcds.2015.35.5879 doi: 10.3934/dcds.2015.35.5879
|
| [50] | J. Finley, A description of the patent Chain Bridge, Philadelphia: Bradford & Inskeep, 1810. |
| [51] |
I. Fragalà, F. Gazzola, G. Sperone, Solenoidal extensions in domains with obstacles: explicit bounds and applications to Navier-Stokes equations, Calc. Var., 59 (2020), 196. http://doi.org/10.1007/s00526-020-01844-z doi: 10.1007/s00526-020-01844-z
|
| [52] |
K. Friedrichs, Die randwert und eigenwertprobleme aus der theorie der elastischen platten. (Anwendung der direkten methoden der variationsrechnung), Math. Ann., 98 (1928), 205–247. http://doi.org/10.1007/BF01451590 doi: 10.1007/BF01451590
|
| [53] |
M. Garrione, Beams with an intermediate pier: spectral properties, asymmetry and stability, Mathematics in Engineering, 3 (2021), 1–21. http://doi.org/10.3934/mine.2021016 doi: 10.3934/mine.2021016
|
| [54] |
M. Garrione, F. Gazzola, Loss of energy concentration in nonlinear evolution beam equations, J. Nonlinear Sci., 27 (2017), 1789–1827. http://doi.org/10.1007/s00332-017-9386-1 doi: 10.1007/s00332-017-9386-1
|
| [55] | M. Garrione, F. Gazzola, Nonlinear equations and stability for beams and degenerate plates with several intermediate piers, Cham: Springer, 2019. http://doi.org/10.1007/978-3-030-30218-4 |
| [56] |
M. Garrione, F. Gazzola, Linear theory for beams with intermediate piers, Commun. Contemp. Math., 22 (2020), 1950081. http://doi.org/10.1142/S0219199719500810 doi: 10.1142/S0219199719500810
|
| [57] |
C. Gasparetto, F. Gazzola, Resonance tongues for the Hill equation with Duffing coefficients and instabilities in a nonlinear beam equation, Commun. Contemp. Math., 20 (2018), 1750022. http://doi.org/10.1142/S0219199717500225 doi: 10.1142/S0219199717500225
|
| [58] |
F. Gazzola, Hexagonal design for stiffening trusses, Annali di Matematica, 194 (2015), 87–108. http://doi.org/10.1007/s10231-013-0366-2 doi: 10.1007/s10231-013-0366-2
|
| [59] | F. Gazzola, Mathematical models for suspension bridges, Cham: Springer, 2015. http://doi.org/10.1007/978-3-319-15434-3 |
| [60] | F. Gazzola, H. C. Grunau, G. Sweers, Polyharmonic boundary value problems, Berlin, Heidelberg: Springer, 2010. http://doi.org/10.1007/978-3-642-12245-3 |
| [61] |
F. Gazzola, M. Jleli, B. Samet, On the Melan equation for suspension bridges, J. Fixed Point Theory Appl., 16 (2014), 159–188. http://doi.org/10.1007/s11784-014-0200-5 doi: 10.1007/s11784-014-0200-5
|
| [62] |
F. Gazzola, R. Pavani, Wide oscillations finite time blow up for solutions to nonlinear fourth order differential equations, Arch. Rational Mech. Anal., 207 (2013), 717–752. http://doi.org/10.1007/s00205-012-0569-5 doi: 10.1007/s00205-012-0569-5
|
| [63] |
F. Gazzola, V. Racič, A model of synchronisation in crowd dynamics, Appl. Math. Model., 59 (2018), 305–318. http://doi.org/10.1016/j.apm.2018.02.001 doi: 10.1016/j.apm.2018.02.001
|
| [64] |
F. Gazzola, A. Soufyane, Long-time behavior of partially damped systems modeling degenerate plates with piers, Nonlinearity, 34 (2021), 7705–7727. http://doi.org/10.1088/1361-6544/ac24e2 doi: 10.1088/1361-6544/ac24e2
|
| [65] |
F. Gazzola, G. Sperone, Thresholds for hanger slackening and cable shortening in the Melan equation for suspension bridges, Nonlinear Anal. Real, 39 (2018), 520–536. http://doi.org/10.1016/j.nonrwa.2017.08.001 doi: 10.1016/j.nonrwa.2017.08.001
|
| [66] |
F. Gazzola, G. Sperone, Steady Navier-Stokes equations in planar domains with obstacle and explicit bounds for unique solvability, Arch. Rational Mech. Anal., 238 (2020), 1283–1347. http://doi.org/10.1007/s00205-020-01565-9 doi: 10.1007/s00205-020-01565-9
|
| [67] |
F. Gazzola, G. Sperone, T. Weth, A connection between symmetry breaking for Sobolev minimizers and stationary Navier-Stokes flows past a circular obstacle, Appl. Math. Optim., 85 (2022), 10. http://doi.org/10.1007/s00245-022-09831-w doi: 10.1007/s00245-022-09831-w
|
| [68] |
F. Gazzola, Y. Wang, R. Pavani, Variational formulation of the Melan equation, Math. Method. Appl. Sci., 41 (2018), 943–951. http://doi.org/10.1002/mma.3962 doi: 10.1002/mma.3962
|
| [69] |
D. Green, W. G. Unruh, The failure of the Tacoma Bridge: A physical model, Amer. J. Phys., 74 (2006), 706–716. http://doi.org/10.1119/1.2201854 doi: 10.1119/1.2201854
|
| [70] | J. D. Holmes, Wind loading of structures, 3 Eds., CRC Press, 2007. http://doi.org/10.1201/b18029 |
| [71] | H. M. Irvine, Cable structures, Massachusetts: The MIT Press, 1981. |
| [72] | J. A. Jurado, S. Hernández, F. Nieto, A. Mosquera, Bridge aeroelasticity: sensitivity analysis and optimum design (high performance structures and materials), WIT Press, 2011. |
| [73] | I. B. Karintsev, I. V. Pavlenko, Hydroaeroelasticity, Sumy State University, 2017. |
| [74] |
G. R. Kirchhoff, Über das gleichgewicht und die bewegung einer elastischen scheibe, J. Reine Angew. Math., 1850 (1850), 51–88. http://doi.org/10.1515/crll.1850.40.51 doi: 10.1515/crll.1850.40.51
|
| [75] |
B. Kawohl, J. Stará, G. Wittum, Analysis and numerical studies of a problem of shape design, Arch. Rational Mech. Anal., 114 (1991), 349–363. http://doi.org/10.1007/BF00376139 doi: 10.1007/BF00376139
|
| [76] | W. Lacarbonara, Nonlinear structural mechanics, New York: Springer, 2013. http://doi.org/10.1007/978-1-4419-1276-3 |
| [77] |
A. C. Lazer, P. J. McKenna, Large-amplitude periodic oscillations in suspension bridges: some new connections with nonlinear analysis, SIAM Rev., 32 (1990), 537–578. http://doi.org/10.1137/1032120 doi: 10.1137/1032120
|
| [78] | W. J. Lewis, Tension cables in suspension bridges. A case of form-finding, In: Tension structures, form and behaviour, ICE Publishing, 2017,101–133. http://doi.org/10.1680/tsfab.61736.101 |
| [79] | J. H. Lienhard, Synopsis of lift, drag, and vortex frequency data for rigid circular cylinders, Research Division Bulletin, Washington State University College of Engineering, 1966. |
| [80] | A. E. H. Love, A treatise on the mathematical theory of elasticity, 4 Eds., Cambridge University Press, 1927. |
| [81] |
M. Matsumoto, H. Matsumiya, S. Fujiwara, Y. Ito, New consideration on flutter properties based on step-by-step analysis, J. Wind Eng. Ind. Aerod., 98 (2010), 429–437. http://doi.org/10.1016/j.jweia.2010.02.001 doi: 10.1016/j.jweia.2010.02.001
|
| [82] |
P. J. McKenna, Large torsional oscillations in suspension bridges revisited: fixing an old approximation, Amer. Math. Mon., 106 (1999), 1–18. http://doi.org/10.1080/00029890.1999.12005001 doi: 10.1080/00029890.1999.12005001
|
| [83] |
P. J. McKenna, Oscillations in suspension bridges, vertical and torsional, Discrete. Cont. Dyn. Syst. S, 7 (2014), 785–791. http://doi.org/10.3934/dcdss.2014.7.785 doi: 10.3934/dcdss.2014.7.785
|
| [84] | J. Melan, Theory of arches and suspension bridges, London: Myron Clark Pul. Comp., 1913. |
| [85] |
O. Pironneau, On optimum profiles in Stokes flow, J. Fluid Mech., 59 (1973), 117–128. http://doi.org/10.1017/S002211207300145X doi: 10.1017/S002211207300145X
|
| [86] |
O. Pironneau, On optimum design in fluid mechanics, J. Fluid Mech., 64 (1974), 97–110. http://doi.org/10.1017/S0022112074002023 doi: 10.1017/S0022112074002023
|
| [87] | W. Podolny, Cable-suspended bridges, In: Structural steel designer's handbook: AISC, AASHTO, AISI, ASTM, AREMA, and ASCE-07 design standards, 5 Eds., New York: McGraw-Hill, 2011. |
| [88] |
W. A. Provis, Observations on the effects produced by wind on the suspension bridge over the Menai Strait, more especially as relates to the injuries sustained by the roadways during the storm of January, 1839; together with brief notices of various suggestions for repairing the structure, Transactions of the Institution of Civil Engineers, 3 (1842), 357–370. http://doi.org/10.1680/itrcs.1842.24373 doi: 10.1680/itrcs.1842.24373
|
| [89] | W. Reid, A short account of the failure of a part of the Brighton Chain Pier, in the gale of the 30th of November 1836, Papers on Subjects Connected with the Duties of the Corps of Royal Engineers, Professional Papers of the Corps of Royal Engineers, Vol.I, 1844. |
| [90] | Y. Rocard, Dynamic instability: automobiles, aircraft, suspension bridges, London: Crosby Lockwood, 1957. |
| [91] |
R. H. Scanlan, The action of flexible bridges under wind, I: flutter theory, J. Sound Vib., 60 (1978), 187–199. http://doi.org/10.1016/S0022-460X(78)80028-5 doi: 10.1016/S0022-460X(78)80028-5
|
| [92] |
R. H. Scanlan, The action of flexible bridges under wind, II: buffeting theory, J. Sound Vib., 60 (1978), 201–211. http://doi.org/10.1016/S0022-460X(78)80029-7 doi: 10.1016/S0022-460X(78)80029-7
|
| [93] |
R. H. Scanlan, J. J. Tomko, Airfoil and bridge deck flutter derivatives, Journal of the Engineering Mechanics Division, 97 (1971), 1717–1737. http://doi.org/10.1061/JMCEA3.0001526 doi: 10.1061/JMCEA3.0001526
|
| [94] | R. Scott, In the wake of Tacoma. Suspension bridges and the quest for aerodynamic stability, ASCE Press, 2001. http://doi.org/10.1061/9780784405420 |
| [95] | A. Selberg, Oscillation and aerodynamic instability of suspension bridges, Acta Polytechnica Scandinavica, Civil Engineering and Construction Series, 1961. |
| [96] |
B. Semper, A mathematical model for suspension bridge vibration, Math. Comput. Model., 18 (1993), 17–28. http://doi.org/10.1016/0895-7177(93)90203-B doi: 10.1016/0895-7177(93)90203-B
|
| [97] |
B. Semper, Finite element methods for suspension bridge models, Comput. Math. Appl., 26 (1993), 77–91. http://doi.org/10.1016/0898-1221(93)90076-8 doi: 10.1016/0898-1221(93)90076-8
|
| [98] |
B. Semper, Finite element approximation of a fourth order integro-differential equation, Appl. Math. Lett., 7 (1994), 59–62. http://doi.org/10.1016/0893-9659(94)90054-X doi: 10.1016/0893-9659(94)90054-X
|
| [99] | E. Simiu, R. H. Scanlan, Wind effects on structures: fundamentals and applications to design, 3 Eds., New York: John Wiley, 1996. |
| [100] | F. C. Smith, G. S. Vincent, Aerodynamic stability of suspension bridges: with special reference to the Tacoma Narrows Bridge, Part II: Mathematical analysis, University of Washington Press, 1950. |
| [101] | Tacoma Narrows Bridge collapse, Video from Youtube, 1940. Available from: http://www.youtube.com/watch?v=3mclp9QmCGs. |
| [102] | E. Ventsel, T. Krauthammer, Thin plates and shells: theory, analysis, and applications, New York: CRC Press, 2001. http://doi.org/10.1201/9780203908723 |
| [103] | F. Verantii, Machinae novae, Venetiis cum Privilegiis, 1595. |
| [104] | F. Verhulst, Nonlinear differential equations and dynamical systems, Berlin: Springer, 1990. http://doi.org/10.1007/978-3-642-97149-5 |
| [105] |
H. Wagner, Über die entstehung des dynamischen auftriebes von tragflügeln, ZAMM-Z. Angew. Math. Mech., 5 (1925), 17–35. http://doi.org/10.1002/zamm.19250050103 doi: 10.1002/zamm.19250050103
|
| [106] |
L. Xu, Y. Hui, W. Zhu, X. Hua, Three-to-one internal resonance analysis for a suspension bridge with spatial cable through a continuum model, Eur. J. Mech. A-Solid., 90 (2021), 104354. http://doi.org/10.1016/j.euromechsol.2021.104354 doi: 10.1016/j.euromechsol.2021.104354
|
| [107] |
M. Zurru, Non-linear normal modes of plane cable trusses, Comput. Struct., 257 (2021), 106662. http://doi.org/10.1016/j.compstruc.2021.106662 doi: 10.1016/j.compstruc.2021.106662
|


Figures(18) / Tables(2)

Filippo Gazzola, Mohamed Jleli, Bessem Samet. A new detailed explanation of the Tacoma collapse and some optimization problems to improve the stability of suspension bridges[J]. Mathematics in Engineering, 2023, 5(2): 1-35. doi: 10.3934/mine.2023045


 DownLoad: