In this paper, we construct an age-structured epidemic model to analyze the optimal vaccine allocation strategy in an epidemic. We focus on two topics: the first one is the optimal vaccination interval between the first and second doses, and the second one is the optimal vaccine allocation ratio between young and elderly people. On the first topic, we show that the optimal interval tends to become longer as the relative efficacy of the first dose to the second dose (RE) increases. On the second topic, we show that the heterogeneity in the age-dependent susceptibility (HS) affects the optimal allocation ratio between young and elderly people, whereas the heterogeneity in the contact frequency among different age groups (HC) tends to affect the effectiveness of the vaccination campaign. A counterfactual simulation suggests that the epidemic wave in the summer of 2021 in Japan could have been greatly mitigated if the optimal vaccine allocation strategy had been taken.
Citation: Toshikazu Kuniya, Taisuke Nakata, Daisuke Fujii. Optimal vaccine allocation strategy: Theory and application to the early stage of COVID-19 in Japan[J]. Mathematical Biosciences and Engineering, 2024, 21(6): 6359-6371. doi: 10.3934/mbe.2024277
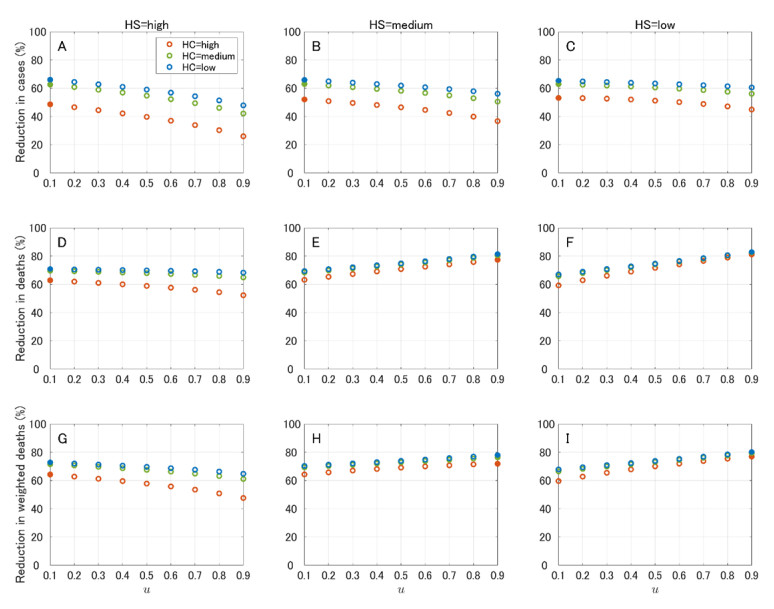
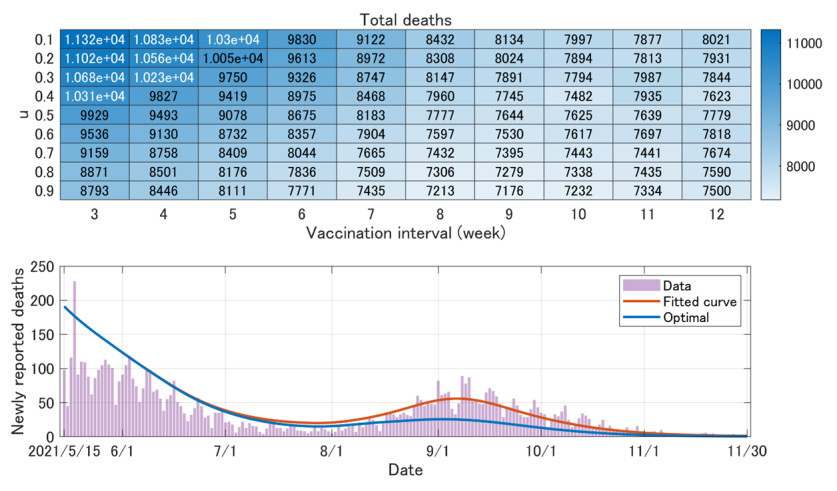
In this paper, we construct an age-structured epidemic model to analyze the optimal vaccine allocation strategy in an epidemic. We focus on two topics: the first one is the optimal vaccination interval between the first and second doses, and the second one is the optimal vaccine allocation ratio between young and elderly people. On the first topic, we show that the optimal interval tends to become longer as the relative efficacy of the first dose to the second dose (RE) increases. On the second topic, we show that the heterogeneity in the age-dependent susceptibility (HS) affects the optimal allocation ratio between young and elderly people, whereas the heterogeneity in the contact frequency among different age groups (HC) tends to affect the effectiveness of the vaccination campaign. A counterfactual simulation suggests that the epidemic wave in the summer of 2021 in Japan could have been greatly mitigated if the optimal vaccine allocation strategy had been taken.

| [1] |
S. Flaxman, S. Mishra, A. Gandy, H. J. T. Unwin, T. A. Mellan, H. Coupland, et al., Estimating the effects of non-pharmaceutical interventions on COVID-19 in Europe, Nature, 584 (2020), 257–261. https://doi.org/10.1038/s41586-020-2405-7 doi: 10.1038/s41586-020-2405-7

|
| [2] | M. Nicola, Z. Alsafi, C. Sohrabi, A. Kerwan, A. Al-Jabir, C. Iosifidis, et al., The socio-economic implications of the coronavirus pandemic (COVID-19): A review, Int. J. Surgery, 78 (2020), 185–193. https://doi.org/10.1016%2Fj.ijsu.2020.04.018 |
| [3] | World Health Organization, WHO SAGE Roadmap for prioritizing uses of COVID-19 vaccines in the context of limited supply, 2020. Available from: https://www.who.int/docs/default-source/immunization/sage/covid/sage-prioritization-roadmap-covid19-vaccines.pdf. |
| [4] | Joint Committee on Vaccination and Immunisation, Prioritising the first COVID-19 vaccine dose: JCVI statement, 2021. Available from: https://www.gov.uk/government/publications/prioritising-the-first-covid-19-vaccine-dose-jcvi-statement. |
| [5] |
L. S. Ferreira, O. Canton, R. L. P. Silva, S. Poloni, V. Sudbrack, M. E. Borges, et al., Assessing the best time interval between doses in a two-dose vaccination regimen to reduce the number of deaths in an ongoing epidemic of SARS-CoV-2, PLoS Comput. Biol., 18 (2022), e10009978. https://doi.org/10.1371/journal.pcbi.1009978 doi: 10.1371/journal.pcbi.1009978
|
| [6] |
M. J. Keeling, S. Moore, B. S. Penman, E. M. Hill, The impacts of SARS-CoV-2 vaccine dose separation and targeting on the COVID-19 epidemic in England, Nat. Commun., 14 (2023), 740. https://doi.org/10.1038/s41467-023-35943-0 doi: 10.1038/s41467-023-35943-0
|
| [7] |
H. Parry, R. Bruton, C. Stephens, C. Bentley, K. Brown, G. Amirthalingam, et al., Extended interval BNT162b2 vaccination enhances peak antibody generation, NPJ Vaccines, 7 (2022), 14. https://doi.org/10.1038/s41541-022-00432-w doi: 10.1038/s41541-022-00432-w
|
| [8] |
K. M. Bubar, K. Reinholt, S. M. Kissler, M. Lipsitch, S. Cobey, Y. H. Grad, et al., Model-informed COVID-19 vaccine prioritization strategies by age and serostatus, Science, 371 (2021), 916–921. https://doi.org/10.1126/science.abe6959 doi: 10.1126/science.abe6959
|
| [9] |
B. H. Foy, B. Wahl, K. Mehta, A. Shet, G. I. Menon, C. Britto, Comparing COVID-19 vaccine allocation strategies in India: a mathematical modelling study, Int. J. Infect. Dis., 103 (2021), 431–438. https://doi.org/10.1016/j.ijid.2020.12.075 doi: 10.1016/j.ijid.2020.12.075
|
| [10] |
L. Matrajt, J. Eaton, T. Leung, E. R. Brown, Vaccine optimization for COVID-19: who to vaccinate first?, Sci. Adv., 7 (2021), eabf1374. https://doi.org/10.1126/sciadv.abf1374 doi: 10.1126/sciadv.abf1374
|
| [11] |
J. Molla, A. P. L. Chávez, T. Hiraoka, T. Ala-Nissila, M. Kivelä , L. Leskelä , Adaptive and optimized COVID-19 vaccination strategies across geographical regions and age groups, PLoS Comput. Biol., 18 (2022), e1009974. https://doi.org/10.1371/journal.pcbi.1009974 doi: 10.1371/journal.pcbi.1009974
|
| [12] |
A. Babus, S. Das, S. Lee, The optimal allocation of COVID-19 vaccines, Econom. Letters, 224 (2023) 111008. https://doi.org/10.1016/j.econlet.2023.111008 doi: 10.1016/j.econlet.2023.111008
|
| [13] |
O. Diekmann, J. A. P. Heesterbeek, J. A. J. Metz, On the definition and the computation of the basic reproduction ratio R0 in models for infectious diseases in heterogeneous populations, J. Math. Biol., 28 (1990), 365–382. https://doi.org/10.1007/BF00178324 doi: 10.1007/BF00178324
|
| [14] |
S. Kodera, E. A. Rashed, A. Hirata, Estimation of real-world vaccination effectiveness of mRNA COVID-19 vaccines against Delta and Omicron variants in Japan, Vaccines, 10 (2022), 430. https://doi.org/10.3390/vaccines10030430 doi: 10.3390/vaccines10030430
|
| [15] | Digital Agency, Vaccination Record System (VRS). Available from: https://info.vrs.digital.go.jp/opendata/ (Japanese). |
| [16] |
C. Fraser, C. A. Donnelly, S. Cauchemez, W. P. Hanage, M. D. Kerkhove, T. D. Hollingsworth, et al., Pandemic potential of a strain of influenza A (H1N1): early findings, Science, 324 (2009) 1557–1561. https://doi.org/10.1126/science.1176062 doi: 10.1126/science.1176062
|
| [17] | SPI-M-O, Summary of further modelling of easing restrictions – Roadmap Step 2 (2021). Available from: https://assets.publishing.service.gov.uk/government/uploads/system/uploads/attachment_data/file/975909/S1182_SPI-M-O_Summary_of_modelling_of_easing_roadmap_step_2_restrictions.pdf. |
| [18] | Ministry of Health, Labour and Welfare of Japan, Visualizing the data: information on COVID-19 infections. Available from: https://covid19.mhlw.go.jp/en/. |
 mbe-21-06-277-Supplementary.pdf mbe-21-06-277-Supplementary.pdf |
 |
Figures(6) / Tables(1)

Toshikazu Kuniya, Taisuke Nakata, Daisuke Fujii. Optimal vaccine allocation strategy: Theory and application to the early stage of COVID-19 in Japan[J]. Mathematical Biosciences and Engineering, 2024, 21(6): 6359-6371. doi: 10.3934/mbe.2024277


 DownLoad: