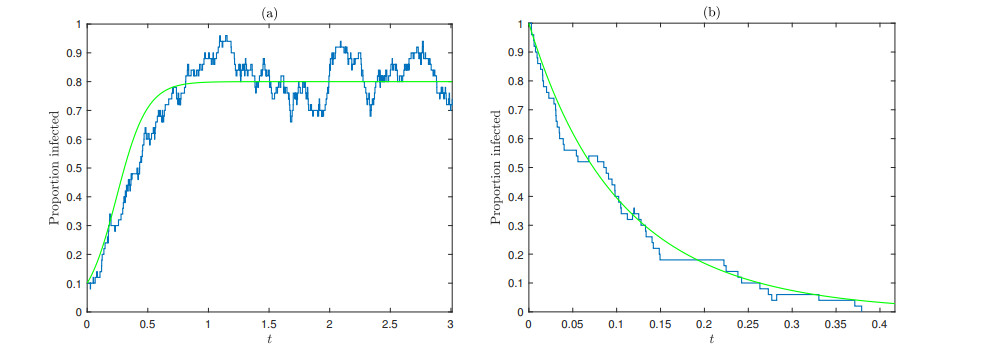
We study an extension of the stochastic SIS (Susceptible-Infectious-Susceptible) model in continuous time that accounts for variation amongst individuals. By examining its limiting behaviour as the population size grows we are able to exhibit conditions for the infection to become endemic.
Citation: Philip K. Pollett. An SIS epidemic model with individual variation[J]. Mathematical Biosciences and Engineering, 2024, 21(4): 5446-5455. doi: 10.3934/mbe.2024240
We study an extension of the stochastic SIS (Susceptible-Infectious-Susceptible) model in continuous time that accounts for variation amongst individuals. By examining its limiting behaviour as the population size grows we are able to exhibit conditions for the infection to become endemic.

| [1] |
G.H. Weiss, M. Dishon, On the asymptotic behaviour of the stochastic and deterministic models of an epidemic, Math. Biosci., 11 (1971), 261–265. https://doi.org/10.1016/0025-5564(71)90087-3 doi: 10.1016/0025-5564(71)90087-3

|
| [2] |
T. G. Kurtz, Solutions of ordinary differential equations as limits of pure jump Markov processes, J. Appl. Probab., 7 (1970), 49–58. https://doi.org/10.2307/3212147 doi: 10.2307/3212147
|
| [3] |
F. Ball, Stochastic and deterministic models for SIS epidemics among a population partitioned into households, Math. Biosci., 158 (1999), 41–67. https://doi.org/10.1016/S0025-5564(98)10060-3 doi: 10.1016/S0025-5564(98)10060-3
|
| [4] |
F. G. Ball, O. D. Lyne, Optimal vaccination policies for stochastic epidemics among a population of households, Math. Biosci., 177–178 (2002), 333–354. https://doi.org/10.1016/S0025-5564(01)00095-5 doi: 10.1016/S0025-5564(01)00095-5
|
| [5] |
T. Britton, P. Neal, The time to extinction for an SIS-household-epidemic model, J. Math. Biol., 61 (2010), 763–779. https://doi.org/10.1007/s00285-009-0320-5 doi: 10.1007/s00285-009-0320-5
|
| [6] |
D. Clancy, P. O'Neill, Exact bayesian inference and model selection for stochastic models of epidemics among a community of households, Scand. J. Statist., 34 (2007), 259–274. https://doi.org/10.1111/j.1467-9469.2006.00522.x doi: 10.1111/j.1467-9469.2006.00522.x
|
| [7] |
D. Hiebler, Moment equations and dynamics of a household SIS epidemiological model, J. Math. Biol., 68 (2006), 1315–1333. https://doi.org/10.1007/s11538-006-9080-1 doi: 10.1007/s11538-006-9080-1
|
| [8] |
P. Neal, Efficient likelihood-free bayesian computation for household epidemics, Stat. Comput., 22 (2012), 1239–1256. https://doi.org/10.1007/s11222-010-9216-x doi: 10.1007/s11222-010-9216-x
|
| [9] |
V. Cane, R. McNamee, The spread of infection in a heterogeneous population, J. Appl. Probab., 19A (1982), 173–184. https://doi.org/10.1017/S0021900200034549 doi: 10.1017/S0021900200034549
|
| [10] |
R. McVinish, P. K. Pollett, The deterministic limit of a stochastic logistic model with individual variation, Math. Biosci., 241 (2013), 109–114. https://doi.org/10.1016/j.mbs.2012.10.001 doi: 10.1016/j.mbs.2012.10.001
|
| [11] | S. Nadarajaha, A. K. Gupta, Some bivariate gamma distributions. Appl. Math. Letters, 19 (2006), 767–774. https://doi.org/10.1016/j.aml.2005.10.007 |
| [12] | L. Hodgkinson, Approximations for finite spin systems and occupancy processes. PhD thesis, School of Mathematics and Physics, The University of Queensland, 2019. |
| [13] |
L. Hodgkinson, R. McVinish, P. K. Pollett. Normal approximations for discrete-time occupancy processes, Stochastic Process. Appl., 130 (2020), 6414–6444. https://doi.org/10.1016/j.spa.2020.05.016 doi: 10.1016/j.spa.2020.05.016
|
| [14] |
P. Stone, H. Wilkinson-Herbots, V. Isham, A stochastic model for head lice infections, J. Math. Biol., 56 (2008), 743–763. https://doi.org/10.1007/s00285-007-0136-0 doi: 10.1007/s00285-007-0136-0
|


Figures(5)

Philip K. Pollett. An SIS epidemic model with individual variation[J]. Mathematical Biosciences and Engineering, 2024, 21(4): 5446-5455. doi: 10.3934/mbe.2024240


 DownLoad: