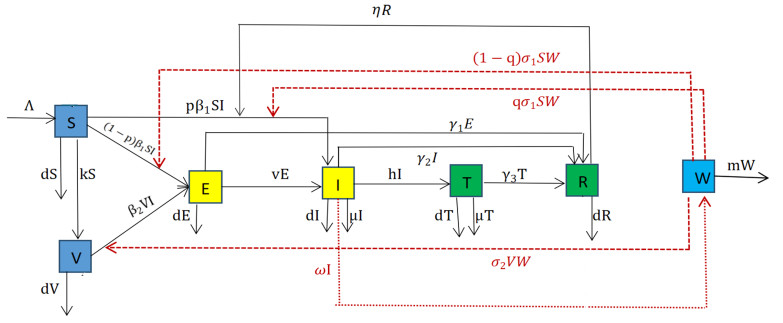
Tuberculosis has affected human beings for thousands of years, and until today, tuberculosis still ranks third among 29 infectious diseases in China. However, most of the existing mathematical models consider a single factor, which is not conducive to the study of tuberculosis transmission dynamics. Therefore, this study considers the combined effects of vaccination, treatment, and contaminated environments on tuberculosis, and builds a new model with seven compartments of $ SVEITRW $ based on China's tuberculosis data. The study shows that when the basic reproduction number $ R_{0} $ is less than 1, the disease will eventually disappear, but when $ R_{0} $ is greater than 1, the disease may persist. In the numerical analysis part, we use Markov-chain Monte-Carlo method to obtain the optimal parameters of the model. Through the next generation matrix theory, we calculate that the $ R_{0} $ value of tuberculosis in China is $ 2.1102 $, that is, if not controlled, tuberculosis in China will not disappear over time. At the same time, through partial rank correlation coefficients, we find the most sensitive parameter to the basic reproduction number $ R_{0} $. On this basis, we combine the actual prevalence of tuberculosis in China, apply Pontryagin's maximum principle, and perform cost-effectiveness analysis to obtain the conditions required for optimal control. The analysis shows that four control strategies could effectively reduce the prevalence of TB, and simultaneously controlling $ u_{2}, u_{3}, u_{4} $ is the most cost-effective control strategy.
Citation: Tao-Li Kang, Hai-Feng Huo, Hong Xiang. Dynamics and optimal control of tuberculosis model with the combined effects of vaccination, treatment and contaminated environments[J]. Mathematical Biosciences and Engineering, 2024, 21(4): 5308-5334. doi: 10.3934/mbe.2024234
Tuberculosis has affected human beings for thousands of years, and until today, tuberculosis still ranks third among 29 infectious diseases in China. However, most of the existing mathematical models consider a single factor, which is not conducive to the study of tuberculosis transmission dynamics. Therefore, this study considers the combined effects of vaccination, treatment, and contaminated environments on tuberculosis, and builds a new model with seven compartments of $ SVEITRW $ based on China's tuberculosis data. The study shows that when the basic reproduction number $ R_{0} $ is less than 1, the disease will eventually disappear, but when $ R_{0} $ is greater than 1, the disease may persist. In the numerical analysis part, we use Markov-chain Monte-Carlo method to obtain the optimal parameters of the model. Through the next generation matrix theory, we calculate that the $ R_{0} $ value of tuberculosis in China is $ 2.1102 $, that is, if not controlled, tuberculosis in China will not disappear over time. At the same time, through partial rank correlation coefficients, we find the most sensitive parameter to the basic reproduction number $ R_{0} $. On this basis, we combine the actual prevalence of tuberculosis in China, apply Pontryagin's maximum principle, and perform cost-effectiveness analysis to obtain the conditions required for optimal control. The analysis shows that four control strategies could effectively reduce the prevalence of TB, and simultaneously controlling $ u_{2}, u_{3}, u_{4} $ is the most cost-effective control strategy.

| [1] | Wikipedia (2023) Tuberculosis, 2023. Available from: https://en.wikipedia.org/wiki/Tuberculosis. |
| [2] |
J. Grange, M. Gandy, P. Farmer, A. Zumla, Historical declines in tuberculosis: nature, nurture and the biosocial model [Counterpoint], Int. J. Tuberc. Lung D, 5 (2001), 208–212. https://doi.org/10.1067/mhl.2001.118364 doi: 10.1067/mhl.2001.118364

|
| [3] | World Health Organization, 2023. Available from: https://www.who.int/en/news-room/fact-sheets/detail/tuberculosis. |
| [4] |
H. Waaler, A. Geser, S. Andersen, The use of mathematical models in the study of the epidemiology of tuberculosis, Am. J. Public Health, 52 (1962), 1002–1013. https://doi.org/10.2105/AJPH.52.6.1002 doi: 10.2105/AJPH.52.6.1002
|
| [5] |
C. Dye, G. P. Garnett, K. Sleeman, B. G. Williams, Prospects for worldwide tuberculosis control under the WHO DOTS strategy, Lancet, 352 (1998), 1886–1891. https://doi.org/10.1016/s0140-6736(98)03199-7 doi: 10.1016/s0140-6736(98)03199-7
|
| [6] |
B. Song, C. Castillo-Chavez, J. P. Aparicio, Tuberculosis models with fast and slow dynamics: the role of close and casual contacts, Math. Biosci., 180 (2002), 187–205. https://doi.org/10.1016/s0025-5564(02)00112-8 doi: 10.1016/s0025-5564(02)00112-8
|
| [7] | T. C. Porco, S. M. Blower, Quantifying the intrinsic transmission dynamics of tuberculosis, Theor. Popul. Biol., 54 (1998), 117–132. http://dx.doi.org/10.1006%2Ftpbi.1998.1366 |
| [8] |
C. Bhunu, W. Garira, Z. Mukandavire, G. Magombedze, Modelling the effects of pre-exposure and post-exposure vaccines in tuberculosis control, J. Theor. Biol., 254 (2008), 633–649. https://doi.org/10.1016/j.jtbi.2008.06.023 doi: 10.1016/j.jtbi.2008.06.023
|
| [9] |
N. Mantilla, M. Gomes, Mycobacterial ecology as a modulator of tuberculosis vaccine success, Theor. Popul. Biol., 75 (2009), 142–152. http://dx.doi.org/10.1016/j.tpb.2009.01.006 doi: 10.1016/j.tpb.2009.01.006
|
| [10] |
Y. Yang, S. Tang, X. Ren, H. Zhao, C. Guo, Global stability and optimal control for a tuberculosis model with vaccination and treatment, Discrete Cnotin. Dyn. B, 21 (2016), 1009–1022. https://doi.org/10.3934/dcdsb.2016.21.1009 doi: 10.3934/dcdsb.2016.21.1009
|
| [11] |
E. Ziv, C. L. Daley, S. Blower, Potential public health impact of new tuberculosis vaccines, Emerg. Infect. Dis., 10 (2004), 1529–1535. https://doi.org/10.3201/eid1009.030921 doi: 10.3201/eid1009.030921
|
| [12] |
S. Ren, Global stability in a tuberculosis model of imperfect treatment with age-dependent latency and relapse, Math. Biosci. Eng., 14 (2017), 1337–1360. http://dx.doi.org/10.3934/mbe.2017069 doi: 10.3934/mbe.2017069
|
| [13] |
J. M. Trauer, J. T. Denholm, E. S. McBryde, Construction of a mathematical model for tuberculosis transmission in highly endemic regions of the Asia-Pacific, J. Theor. Biol., 358 (2014), 74–84. https://doi.org/10.1016/j.jtbi.2014.05.023 doi: 10.1016/j.jtbi.2014.05.023
|
| [14] |
C. Bhunu, W. Garira, Z. Mukandavire, Modeling HIV/AIDS and tuberculosis coinfection, Bull. Math. Biol., 71 (2009), 1745–1780. https://doi.org/10.1007/s11538-009-9423-9 doi: 10.1007/s11538-009-9423-9
|
| [15] |
Z. Guo, H. Xiang, H. Huo, Analysis of an age-structured tuberculosis model with treatment and relapse, J. Math. Biol., 82 (2021), 1–37. https://doi.org/10.1007/s00285-021-01595-1 doi: 10.1007/s00285-021-01595-1
|
| [16] |
L. Xue, S. Jing, H. Wang, Evaluating strategies for tuberculosis to achieve the goals of WHO in China: a seasonal age-structured model study, Bull. Math. Biol., 84 (2022), 61. http://dx.doi.org/10.1007/s11538-022-01019-1 doi: 10.1007/s11538-022-01019-1
|
| [17] | S. Bowong, J. Kurths, Modeling and analysis of the transmission dynamics of tuberculosis without and with seasonality, Nonlinear Dyn., 67 (2012), 2027–2051. http://dx.doi.org/10.1007%2Fs11071-011-0127-y |
| [18] |
T. Li, Y. Guo, Modeling and optimal control of mutated COVID-19 (Delta strain) with imperfect vaccination, Chaos Soliton Fractals, 156 (2022), 111825. https://doi.org/10.1016/j.chaos.2022.111825 doi: 10.1016/j.chaos.2022.111825
|
| [19] |
Y. Guo, T. Li, Modeling the competitive transmission of the Omicron strain and Delta strain of COVID-19, J. Math. Anal. Appl., 526 (2023), 127283. https://doi.org/10.1016/j.jmaa.2023.127283 doi: 10.1016/j.jmaa.2023.127283
|
| [20] | T. R. Hawn, T. A. Day, T. J. Scriba, M. Hatherill, W. A. Hanekom, T. G. Evans, et al., Tuberculosis vaccines and prevention of infection, Microbiol. Mol. Biol. R., 78 (2014), 650–671. https://doi.org/10.1128/mmbr.00021-14 |
| [21] |
G. Disease, I. Incidence, L. Monasta, L. Ronfani, E. Beghi, B. Giussani, et al., Global, regional, and national incidence, prevalence, andyears lived with disability for 354 diseases and injuries for 195 countries and territories, 1990–2017: a systematic analysis for the Global Burden of Disease Study 2017, Lancet, 392 (2018), 1789–1858. https://doi.org/10.1016/S0140-6736(18)32279-7 doi: 10.1016/S0140-6736(18)32279-7
|
| [22] |
P. J. White, G. P. Garnett, Mathematical modelling of the epidemiology of tuberculosis, Adv. Exp. Med. Biol., 2010 (2010), 127–140. https://doi.org/10.1007/978-1-4419-6064-1_9 doi: 10.1007/978-1-4419-6064-1_9
|
| [23] |
Y. Li, X. Liu, Y. Yuan, J. Li, L. Wang, Global analysis of tuberculosis dynamical model and optimal control strategies based on case data in the United States, Appl. Math. Comput., 422 (2022), 126983. https://doi.org/10.1016/j.amc.2022.126983 doi: 10.1016/j.amc.2022.126983
|
| [24] |
Q. Jiang, Z. Liu, L. Wang, R. Tan, A tuberculosis model with early and late latency, imperfect vaccination, and relapse: An application to China, Math. Method. Appl. Sci., 46 (2023), 10929–10946. https://doi.org/10.1002/mma.9160 doi: 10.1002/mma.9160
|
| [25] |
A. Xu, Z. Wen, Y. Wang, W. Wang, Prediction of different interventions on the burden of drug-resistant tuberculosis in China: a dynamic modelling study, J. Glob. Antimicrob. Res., 29 (2022), 323–330. https://doi.org/10.21203/rs.3.rs-637762/v1 doi: 10.21203/rs.3.rs-637762/v1
|
| [26] | Y. Cai, S. Zhao, Y. Niu, Z. Peng, K. Wang, D. He, et al., Modelling the effects of the contaminated environments on tuberculosis in Jiangsu, China, J. Math. Biol., 508 (2021) 110453. https://doi.org/10.1016/j.jtbi.2020.110453 |
| [27] |
P. Van den Driessche, J. Watmough, Reproduction numbers and sub-threshold endemic equilibria for compartmental models of disease transmission, Math. Biosci., 180 (2002), 29–48. https://doi.org/10.1016/s0025-5564(02)00108-6 doi: 10.1016/s0025-5564(02)00108-6
|
| [28] | J. LaSalle, The Stability of Dynamical Systems, Society for Industrial and Applied Mathematics, Philadelphia Pennsylvania, 1976. https://doi.org/10.1137/1.9781611970432 |
| [29] | X. Zhao, Dissipative Dynamical Systems, Dynamical Systems in Population Biology, Spring Link, New York, 2003. https://doi.org/10.1007/978-3-319-56433-3 |
| [30] | X. Zhao, Uniform persistence and periodic coexistence states in infinite-dimensional periodic semiflows with applications, Canad. Appl. Math. Quart., 3 (1995), 473–495. |
| [31] |
W. Wang, X. Zhao, An epidemic model in a patchy environment, Math. Biosci., 190 (2004), 97–112. https://doi.org/10.1016/j.mbs.2002.11.001 doi: 10.1016/j.mbs.2002.11.001
|
| [32] |
Y. Guo, T. Li, Fractional-order modeling and optimal control of a new online game addiction model based on real data, Commun. Nonlinear Sci., 121 (2023), 107221. https://doi.org/10.1016/j.cnsns.2023.107221 doi: 10.1016/j.cnsns.2023.107221
|
| [33] | L. Pontryagin, V. Boltyanskii, R. Gamkrelidze, E. Mischenko, The Mathematical Theory of Optimal Processes, Gordon and Breach Science Publishers, New York, 1986. https://doi.org/10.1201/9780203749319 |
| [34] | China Center for Disease Control and Prevention, 2021. Available from: https://www.ndcpa.gov.cn/jbkzzx/c100016/common/list.html. |
| [35] | China Population Statistic Yearbook, 2020. Available from: https://www.stats.gov.cn/sj/ndsj/2022/indexch.htm. |
| [36] |
S. Liu, Y. Bi, Y. Liu, Modeling and dynamic analysis of tuberculosis in mainland China from 1998 to 2017: the effect of DOTS strategy and further control, Theor. Biol. Med. Model., 17 (2020), 6. https://doi.org/10.1186/s12976-020-00124-9 doi: 10.1186/s12976-020-00124-9
|
| [37] |
L. Xue, X. Ren, W. Sun, X. Zheng, Z. Peng, B. Singh, Seasonal transmission dynamics and optimal control strategies for tuberculosis in Jiangsu Province, China, Math. Method. Appl. Sci., 46 (2023), 2072–2092. https://doi.org/10.1002/mma.8629 doi: 10.1002/mma.8629
|
| [38] |
S. Marino, I. B. Hogue, C. J. Ray, D. E. Kirschner, A methodology for performing global uncertainty and sensitivity analysis in systems biology, J. Theor. Biol., 254 (2008), 178–196. https://doi.org/10.1016/j.jtbi.2008.04.011 doi: 10.1016/j.jtbi.2008.04.011
|
| [39] |
H. Pan, S. Bele, Y. Feng, S. Qiu, J. Lü, S. Tang, et al., Analysis of the economic burden of diagnosis and treatment of tuberculosis patients in rural China, Int. J. Tuberc. Lung D., 17 (2013), 1575–1580. https://doi.org/10.5588/ijtld.13.0144 doi: 10.5588/ijtld.13.0144
|
| [40] |
X. Li, Y. Ruan, X. Liu, C. Xu, W. Chen, H. D. Xin, Analysis on funding input and benefit output for tuberculosis control and prevention in China from 2011 to 2019, Chin. J. Antituberc., 43 (2021), 702–707. https://doi.org/10.3969/j.issn.1000-6621.2021.07.011 doi: 10.3969/j.issn.1000-6621.2021.07.011
|


Figures(8) / Tables(4)

Tao-Li Kang, Hai-Feng Huo, Hong Xiang. Dynamics and optimal control of tuberculosis model with the combined effects of vaccination, treatment and contaminated environments[J]. Mathematical Biosciences and Engineering, 2024, 21(4): 5308-5334. doi: 10.3934/mbe.2024234


 DownLoad: