Pulmonary artery stenosis endangers people's health. Quantitative pulmonary pressure ratio (QPPR) is very important for clinicians to quickly diagnose diseases and develop treatment plans.
Our purpose of this paper is to investigate the effects of different degrees (50% and 80%) of pulmonary artery stenosis on QPPR.
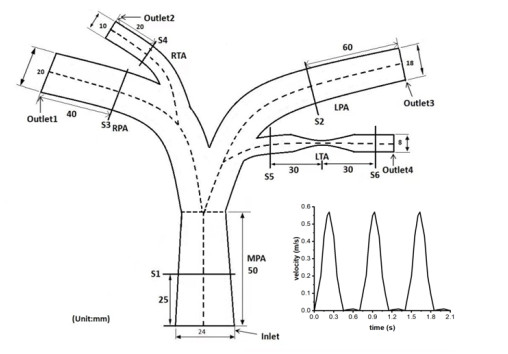
An idealized model is established based on the normal size of human pulmonary artery. The hemodynamic governing equations are solved using fluid-structure interaction.
The results show that the QPPR decreases with the increase of stenosis degree, and it is closely related to the pressure drop at both ends of stenosis. Blood flow velocity and wall shear stress are sensitive to the stenosis degree. When the degree of stenosis is 80%, the amplitude of changes of blood flow velocity and wall shear stress at both ends of stenosis is lower.
The results suggest that the degree of pulmonary artery stenosis has a significant impact on QPPR and hemodynamic changes. This study lays a theoretical foundation for further study of QPPR.
Citation: Fan He, Minru Li, Xinyu Wang, Lu Hua, Tingting Guo. Numerical investigation of quantitative pulmonary pressure ratio in different degrees of stenosis[J]. Mathematical Biosciences and Engineering, 2024, 21(2): 1806-1818. doi: 10.3934/mbe.2024078
Pulmonary artery stenosis endangers people's health. Quantitative pulmonary pressure ratio (QPPR) is very important for clinicians to quickly diagnose diseases and develop treatment plans.
Our purpose of this paper is to investigate the effects of different degrees (50% and 80%) of pulmonary artery stenosis on QPPR.
An idealized model is established based on the normal size of human pulmonary artery. The hemodynamic governing equations are solved using fluid-structure interaction.
The results show that the QPPR decreases with the increase of stenosis degree, and it is closely related to the pressure drop at both ends of stenosis. Blood flow velocity and wall shear stress are sensitive to the stenosis degree. When the degree of stenosis is 80%, the amplitude of changes of blood flow velocity and wall shear stress at both ends of stenosis is lower.
The results suggest that the degree of pulmonary artery stenosis has a significant impact on QPPR and hemodynamic changes. This study lays a theoretical foundation for further study of QPPR.

| [1] |
M. P. Wasserman, P. J. Varghese, R. D. Rowe, The evolution of pulmonary arterial stenosis associated with congenital rubella, Am. Heart J., 76 (1968), 638–644. https://doi.org/10.1016/0002-8703(68)90162-2 doi: 10.1016/0002-8703(68)90162-2

|
| [2] |
N. H. Pijls, J. A. van Son, R. L. Kirkeeide, B. De Bruyne, K. L. Gould, Experimental basis of determining maximum coronary, myocardial, and collateral blood flow by pressure measurements for assessing functional stenosis severity before and after percutaneous transluminal coronary angioplasty, Circulation, 87 (1993), 1354–1367. https://doi.org/10.1161/01.CIR.87.4.1354 doi: 10.1161/01.CIR.87.4.1354
|
| [3] |
F. Díez-Delhoyo, E. Gutiérrez-Ibañes, F. Fernández-Avilés, Functional disorders in non-culprit coronary arteries and their implications in patients with acute myocardial infarction, Trends Cardiovasc. Med., 30 (2020), 346–352. https://doi.org/10.1016/j.tcm.2019.08.011 doi: 10.1016/j.tcm.2019.08.011
|
| [4] |
G. Franchini, F. Giovanniello, M. Amabili, Viscoelasticity of human descending thoracic aorta in a mock circulatory loop, J. Mech. Behav. Biomed. Mater., 130 (2022), 105205. https://doi.org/10.1016/j.jmbbm.2022.105205 doi: 10.1016/j.jmbbm.2022.105205
|
| [5] |
N. Suzuki, S. Nishide, T. Kimura, T. Aoyagi, K. Kanamori, Y. Shiratori, et al., Relationship of quantitative flow ratio after second-generation drug-eluting stent implantation to clinical outcomes, Heart Vessels, 35 (2020), 743–749. https://doi.org/10.1007/s00380-019-01545-4 doi: 10.1007/s00380-019-01545-4
|
| [6] |
S. Tu, J. Westra, J. Yang, C. von Birgelen, A. Ferrara, M. Pellicano, et al., Diagnostic accuracy of fast computational approaches to derive fractional flow reserve from diagnostic coronary angiography: the international multicenter FAVOR pilot study, JACC Cardiovasc. Interventions, 9 (2016), 2024–2035. https://doi.org/10.1016/j.jcin.2016.07.013 doi: 10.1016/j.jcin.2016.07.013
|
| [7] |
T. Inami, M. Kataoka, N. Shimura, H. Ishiguro, R. Yanagisawa, K. Fukuda, et al., Pressure-wire-guided percutaneous transluminal pulmonary angioplasty: A breakthrough in catheter-interventional therapy for chronic thromboembolic pulmonary hypertension, JACC Cardiovasc. Interventions, 7 (2014), 1297–1306. https://doi.org/10.1016/j.jcin.2014.06.010 doi: 10.1016/j.jcin.2014.06.010
|
| [8] |
F. J. H. Gijsen, F. N. van de Vosse, J. D. Janssen, The influence of the non-Newtonian properties of blood on the fow inlarge arteries: Steady fow in a carotid bifurcation model, J. Biomech., 32 (1999), 601–608. https://doi.org/10.1016/s0021-9290(99)00015-9 doi: 10.1016/s0021-9290(99)00015-9
|
| [9] |
H. Yao, K. C. Ang, J. H. Yeo, E. K. Sim, Computational modelling of blood flow through curved stenosed arteries, J. Med. Eng. Technol., 24 (2000), 163–168. https://doi.org/10.1080/03091900050163445 doi: 10.1080/03091900050163445
|
| [10] | Z. Q. Wang, Y. J. Zhou, Y. X. Zhao, D. M. Shi, Y. Y. Liu, W. Liu, et al., Diagnostic accuracy of a deep learning approach to calculate FFR from coronary CT angiography, J. Geriatr. Cardiol., 16 (2019), 42–48. |
| [11] |
S. Molloi, Y. Zhou, G. S. Kassab, Regional volumetric coronary blood flow measurement by digital angiography: In vivo validation1, Acad. Radiol., 11 (2004), 757–766. https://doi.org/10.1016/j.acra.2004.04.002 doi: 10.1016/j.acra.2004.04.002
|
| [12] |
C. Abugattas, A. Aguirre, E. Castillo, M. Cruchaga, Numerical study of bifurcation blood flows using three different non-Newtonian constitutive models, Appl. Math. Modell., 88 (2020), 529–549. https://doi.org/10.1016/j.apm.2020.06.066 doi: 10.1016/j.apm.2020.06.066
|
| [13] |
F. Kong, V. Kheyfets, E. Finol, X. C. Cai, Simulation of unsteady blood flows in a patient-specific compliant pulmonary artery with a highly parallel monolithically coupled fluid-structure interaction algorithm, Int. J. Numer. Method Biomed. Eng., 35 (2019), 1–25. https://doi.org/10.1002/cnm.3208 doi: 10.1002/cnm.3208
|
| [14] |
M. Jahangiri, M. Saghafian, M. R. Sadeghi, Numerical simulation of hemodynamic parameters of turbulent and pulsatile blood flow in flexible artery with single and double stenoses, J. Mech. Sci. Technol., 29 (2015), 3549–3560. https://doi.org/10.1007/s12206-015-0752-3 doi: 10.1007/s12206-015-0752-3
|
| [15] |
J. P. O'Callaghan, E. R. Heitzman, J. W. Somogyi, B. A. Spirt, CT evaluation of pulmonary artery size, J. Comput. Assisted Tomogr., 6 (1982), 101–104. https://doi.org/10.1097/00004728-198202000-00017 doi: 10.1097/00004728-198202000-00017
|
| [16] |
D. Tang, C. Yang, H. Walker, S. Kobayashi, D. N. Ku, Simulating cyclic artery compression using a 3D unsteady model with fluid–structure interactions, Comput. Struct., 80 (2002), 1651–1665. https://doi.org/10.1016/S0045-7949(02)00111-6 doi: 10.1016/S0045-7949(02)00111-6
|
| [17] |
K. L. Gould, Pressure-flow characteristics of coronary stenoses in unsedated dogs at rest and during coronary vasodilation, Circ. Res., 43 (1978), 242–253. https://doi.org/10.1161/01.RES.43.2.242 doi: 10.1161/01.RES.43.2.242
|
| [18] |
P. Stradins, R. Lacis, I. Ozolanta, B. Purina, V. Ose, L. Feldmane, et al., Comparison of biomechanical and structural properties between human aortic and pulmonary valve, Eur. J. Cardiothorac. Surg., 26 (2004), 634–639. https://doi.org/10.1016/j.ejcts.2004.05.043 doi: 10.1016/j.ejcts.2004.05.043
|
| [19] | T. J. Pedley, The Fluid Mechanics of Large Blood Vessel, Cambridge: Cambridge University Press, 1980. https://doi.org/10.1017/CBO9780511896996 |
| [20] |
N. Bessonov, A. Sequeira, S. Simakov, Y. Vassilevskii, V. Volpert, Methods of blood flow modelling, Math. Modell. Nat. Phenom., 11 (2016), 1–25. https://doi.org/10.1051/mmnp/201611101 doi: 10.1051/mmnp/201611101
|
| [21] |
M. J. Chern, M. T. Wu, S. W. Her, Numerical study for blood flow in pulmonary arteries after repair of tetralogy of Fallot, Comput. Math. Methods Med., 2012 (2012), 1–18. https://doi.org/10.1155/2012/198108 doi: 10.1155/2012/198108
|
| [22] |
C. A. Taylor, J. D. Humphrey, Open problems in computational vascular biomechanics: Hemodynamics and arterial wall mechanics, Comput. Methods Appl. Mech. Eng., 198 (2009), 3514–3523. https://doi.org/10.1016/j.cma.2009.02.004 doi: 10.1016/j.cma.2009.02.004
|
| [23] |
H. Xu, J. Liu, D. Zhou, Y. Jin, Influence of microcirculation load on FFR in coronary artery stenosis model, BMC Cardiovasc. Disord., 20 (2020), 1–7. https://doi.org/10.1186/s12872-020-01437-w doi: 10.1186/s12872-020-01437-w
|
| [24] |
S. Kamangar, I. A. Badruddin, K. Govindaraju, N. Nik-Ghazali, A. Badarudin, G. N. Viswanathan, et al., Patient-specific 3D hemodynamics modelling of left coronary artery under hyperemic conditions, Med. Biol. Eng. Comput., 55 (2017), 1451–1461. https://doi.org/10.1007/s11517-016-1604-8 doi: 10.1007/s11517-016-1604-8
|
| [25] |
J. Zhou, Y. S. Li, S. Chien, Shear stress-initiated signaling and its regulation of endothelial function, Arterioscler., Thromb., Vasc. Biol., 34 (2014), 2191–2198. https://doi.org/10.1161/ATVBAHA.114.303422 doi: 10.1161/ATVBAHA.114.303422
|
| [26] |
G. Franchini, I. D. Breslavsky, G. A. Holzapfel, M. Amabili, Viscoelastic characterization of human descending thoracic aortas under cyclic load, Acta Biomater., 130 (2021), 291–307. https://doi.org/10.1016/j.actbio.2021.05.025 doi: 10.1016/j.actbio.2021.05.025
|
| [27] |
M. Amabili, M. Asgari, I. D. Breslavsky, G. Franchini, F. Giovanniello, G. A. Holzapfel, Microstructural and mechanical characterization of the layers of human descending thoracic aortas, Acta Biomater., 134 (2021), 401–421. https://doi.org/10.1016/j.actbio.2021.07.036 doi: 10.1016/j.actbio.2021.07.036
|
| [28] |
M. Amabili, P. Balasubramanian, I. Bozzo, I. D. Breslavsky, G. Ferrari, Layer-specific hyperelastic and viscoelastic characterization of human descending thoracic aortas, J. Mech. Behav. Biomed. Mater., 99 (2019), 27–46. https://doi.org/10.1016/j.jmbbm.2019.07.008 doi: 10.1016/j.jmbbm.2019.07.008
|
| [29] |
I. D. Breslavsky, M. Amabili, Nonlinear model of human descending thoracic aortic segments with residual stresses, Biomech. Model. Mechanobiol., 17 (2018), 1839–1855. https://doi.org/10.1007/s10237-018-1060-5 doi: 10.1007/s10237-018-1060-5
|
| [30] |
H. Zhou, Y. Zhang, W. Duan, H. Zhao, Nonlinear systems modelling based on self-organizing fuzzy neural network with hierarchical pruning scheme, Appl. Soft. Comput., 95 (2020), 106516. https://doi.org/10.1016/j.asoc.2020.106516 doi: 10.1016/j.asoc.2020.106516
|
| [31] |
H. Zhou, Y. Li, Q. Zhang, H. Xu, Y. Su, Soft-sensing of effluent total phosphorus using adaptive recurrent fuzzy neural network with Gustafson-Kessel clustering, Expert Syst. Appl., 203 (2022), 117589. https://doi.org/10.1016/j.eswa.2022.117589 doi: 10.1016/j.eswa.2022.117589
|
| [32] |
H. Zhou, Y. Li, H. Xu, Y. Su, L. Chen, A self-organizing fuzzy neural network modeling approach using an adaptive quantum particle swarm optimization, Appl. Intell., 53 (2023), 13569–13592. https://doi.org/10.1007/s10489-022-04133-8 doi: 10.1007/s10489-022-04133-8
|


Figures(8) / Tables(2)

Fan He, Minru Li, Xinyu Wang, Lu Hua, Tingting Guo. Numerical investigation of quantitative pulmonary pressure ratio in different degrees of stenosis[J]. Mathematical Biosciences and Engineering, 2024, 21(2): 1806-1818. doi: 10.3934/mbe.2024078


 DownLoad: