Starting from the idea of constructing the standard incidence rate, we take the effective contact times of individuals in the population per unit time as a contact function, $ T(\cdot) $, which depends on the population size. Considering the influence of disease on the contact function, the influence intensity factor of the disease affected by the infected person is integrated into the nonlinear incidence rate. We propose an epidemic model with a class of disease-related contact functions. Then, we analyze the well-posedness of the solutions of the model. By using the next generation matrix method, we get the basic reproduction number $ \mathcal{R}_0 $. We find that the existence and stability of the equilibria are not only related to $ \mathcal{R}_0 $, but also to the intensity of the disease affected for the infected person, $ \eta $, and the contact function, $ T(\cdot) $. We obtain some stability results under different assumptions about the contact function. Finally, we use MATLAB to simulate the system for several different contact functions. The numerical simulation results agree with our qualitative study. At the same time, we also prove that the system may have a Hopf bifurcation when the contact function $ T(\cdot) $ satisfies some corresponding conditions.
Citation: Qian Yan, Xianning Liu. Dynamics of an epidemic model with general incidence rate dependent on a class of disease-related contact functions[J]. Mathematical Biosciences and Engineering, 2023, 20(12): 20795-20808. doi: 10.3934/mbe.2023920
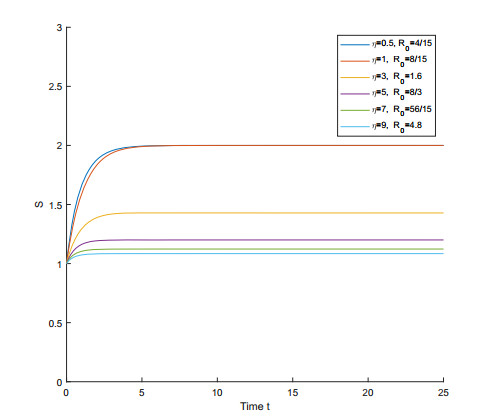
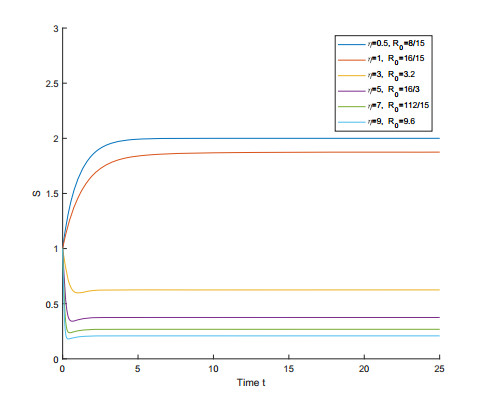
Starting from the idea of constructing the standard incidence rate, we take the effective contact times of individuals in the population per unit time as a contact function, $ T(\cdot) $, which depends on the population size. Considering the influence of disease on the contact function, the influence intensity factor of the disease affected by the infected person is integrated into the nonlinear incidence rate. We propose an epidemic model with a class of disease-related contact functions. Then, we analyze the well-posedness of the solutions of the model. By using the next generation matrix method, we get the basic reproduction number $ \mathcal{R}_0 $. We find that the existence and stability of the equilibria are not only related to $ \mathcal{R}_0 $, but also to the intensity of the disease affected for the infected person, $ \eta $, and the contact function, $ T(\cdot) $. We obtain some stability results under different assumptions about the contact function. Finally, we use MATLAB to simulate the system for several different contact functions. The numerical simulation results agree with our qualitative study. At the same time, we also prove that the system may have a Hopf bifurcation when the contact function $ T(\cdot) $ satisfies some corresponding conditions.

| [1] |
N. Bacaër, S. Guernaoui, The epidemic threshold of vector-borne diseases with seasonality, J. Math. Biol., 53 (2006), 421–436. https://doi.org/10.1007/s00285-006-0015-0 doi: 10.1007/s00285-006-0015-0

|
| [2] |
D. Greenhalgh, I. A. Moneim, SIRS epidemic model and simulations using different types of seasonal contact rate, Syst. Anal. Modell. Simul., 43 (2006), 573–600. https://doi.org/10.1080/023929021000008813 doi: 10.1080/023929021000008813
|
| [3] | H. W. Hethcote, H. W. Stech, P. van den Driessche, Periodicity and stability in epidemic models: a survey, in Differential Equations and Applications in Ecology, Epidemics, and Population Problems, Academic Press, (1981), 65–82. https://doi.org/10.1016/B978-0-12-148360-9.50011-1 |
| [4] | D. Schenzle, An age-structured model of pre- and post-vaccination measles transmission, IMA. J. Math. Appl. Med. Biol., 1 (1984), 169–191. |
| [5] |
A. Bernoussi, Bifurcation of periodic solutions of a delayed SEIR epidemic model with nonlinear incidence rate, J. Appl. Nonlinear Dyn., 10 (2021), 351–367. https://doi.org/10.5890/JAND.2021.09.001 doi: 10.5890/JAND.2021.09.001
|
| [6] |
A. Bernoussi, S. Elkhaiar, C. Jerry, Stability analysis of an SEIRS epidemic model with relapse, immune and general incidence rates, J. Appl. Nonlinear Dyn., 11 (2022), 217–231. https://doi.org/10.5890/JAND.2022.03.013 doi: 10.5890/JAND.2022.03.013
|
| [7] |
W.R. Derrick, P. van den Driessche, A disease transmission model in a nonconstant population, J. Math. Biol., 31 (1993), 495–512. https://doi.org/10.1007/BF00173889 doi: 10.1007/BF00173889
|
| [8] |
J. Hui, L. Chen, Impulsive vaccination of SIR epidemic models with nonlinear incidence rates, Discrete Contin. Dyn. Syst. Ser. B, 4 (2004), 595–605. https://doi.org/10.3934/dcdsb.2004.4.595 doi: 10.3934/dcdsb.2004.4.595
|
| [9] |
W. Liu, S. A. Levin, Y. Iwasa, Influence of nonlinear incidence rates upon the behavior of SIRS epidemiological models, J. Math. Biol., 23 (1986), 187–204. https://doi.org/10.1007/BF00276956 doi: 10.1007/BF00276956
|
| [10] |
H. W. Hethcote, P. van den Driessche, Some epidemiological models with nonlinear incidence, J. Math. Biol., 29 (1991), 271–287. https://doi.org/10.1007/BF00160539 doi: 10.1007/BF00160539
|
| [11] |
J. Mossong, N. Hens, M. Jit, P. Beutels, K. Auranen, R. Mikolajczyk, et al., Social contacts and mixing patterns relevant to the spread of infectious diseases, PLoS Med., 5 (2008), 74. https://doi.org/10.1371/journal.pmed.0050074 doi: 10.1371/journal.pmed.0050074
|
| [12] |
A. Nold, Heterogeneity in disease-transmission modeling, Math. Biosci., 52 (1980), 227–240. https://doi.org/10.1016/0025-5564(80)90069-3 doi: 10.1016/0025-5564(80)90069-3
|
| [13] |
H. W. Hethcote, Qualtiative analysis of communicable disease models, J. Math. Biol., 28 (1976), 335–356. https://doi.org/10.1016/0025-5564(76)90132-2 doi: 10.1016/0025-5564(76)90132-2
|
| [14] |
P. van den Driessche, J. Watmough, Reproduction numbers and sub-threshold endemic equilibria for compartmental models of disease transmission, Math. Biosci., 180 (2002), 29–48. https://doi.org/10.1016/S0025-5564(02)00108-6 doi: 10.1016/S0025-5564(02)00108-6
|
| [15] | S. Guo, J. Wu, Bifurcation Theory of Functional Differential Equations, Springer, New York, 2006. https://doi.org/10.1007/978-1-4614-6992-6 |


Figures(4) / Tables(2)

Qian Yan, Xianning Liu. Dynamics of an epidemic model with general incidence rate dependent on a class of disease-related contact functions[J]. Mathematical Biosciences and Engineering, 2023, 20(12): 20795-20808. doi: 10.3934/mbe.2023920


 DownLoad: