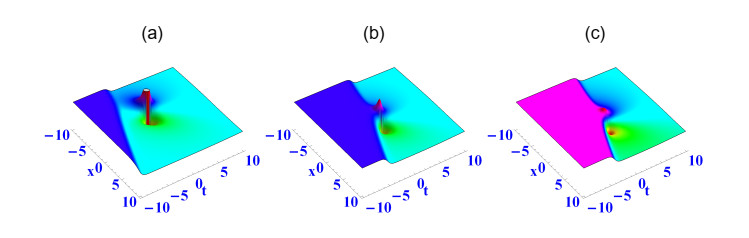
In this work, a new extended shallow water wave equation in (3+1) dimensions was studied, which represents abundant physical meaning in a nonlinear shallow water wave. We discussed the interaction between a lump wave and a single solitary wave, which is an inelastic collision. Further, the interaction between a lump wave and two solitary waves and the interaction between a lump wave and a periodic wave was also studied using the Hirota bilinear method. Finally, the interaction among lump, periodic and one solitary wave was investigated. The dynamic properties of the obtained results are shown and analyzed by some three-dimensional images.
Citation: Hong-Yang Guan, Jian-Guo Liu. Propagation of lump-type waves in nonlinear shallow water wave[J]. Mathematical Biosciences and Engineering, 2023, 20(11): 19553-19564. doi: 10.3934/mbe.2023866
In this work, a new extended shallow water wave equation in (3+1) dimensions was studied, which represents abundant physical meaning in a nonlinear shallow water wave. We discussed the interaction between a lump wave and a single solitary wave, which is an inelastic collision. Further, the interaction between a lump wave and two solitary waves and the interaction between a lump wave and a periodic wave was also studied using the Hirota bilinear method. Finally, the interaction among lump, periodic and one solitary wave was investigated. The dynamic properties of the obtained results are shown and analyzed by some three-dimensional images.

| [1] |
W. X. Ma, Lump solutions to the Kadomtsev-Petviashvili equation, Phys. Lett. A, 379 (2015), 1975–1978. https://doi.org/10.1016/j.physleta.2015.06.061 doi: 10.1016/j.physleta.2015.06.061

|
| [2] |
W. X. Ma, Y. Zhou, Lump solutions to nonlinear partial differential equations via Hirota bilinear forms, J. Differ. Equations, 264 (2018), 2633–2659. https://doi.org/10.1016/j.jde.2017.10.033 doi: 10.1016/j.jde.2017.10.033
|
| [3] |
Y. Sun, B. Tian, L. Liu, H. P. Chai, Y. Q. Yuan, Rogue waves and lump solitons of the (3+ 1)-dimensional generalized B-type Kadomtsev–Petviashvili equation for water waves, Commun. Theor. Phys., 68 (2017), 693–700. https://doi.org/10.1142/S0217984917501226 doi: 10.1142/S0217984917501226
|
| [4] |
M. Wang, B, Tian, S. H. Liu, W. R. Shan, Y. Jiang, Soliton, multiple-lump and hybrid solutions of a (2+1)-dimensional generalized Hirota-Satsuma-Ito equation for the water waves, Eur. Phys. J. Plus, 136 (2021), 635. https://doi.org/10.1140/epjp/s13360-021-01588-5 doi: 10.1140/epjp/s13360-021-01588-5
|
| [5] |
H. Yin, B. Tian, X. Zhao, C. R. Zhang, C. C. Hu, Breather-like solitons, rogue waves, quasi-periodic/chaotic states for the surface elevation of water waves, Nonlinear Dyn., 97 (2019), 21–31. https://doi.org/10.1007/s11071-019-04904-y doi: 10.1007/s11071-019-04904-y
|
| [6] |
X. Lü, W. X. Ma, S. T. Chen, M. K. Chaudry, A note on rational solutions to a Hirota-Satsuma-like equation, Appl. Math. Lett., 58 (2016), 13–18. https://doi.org/10.1016/j.aml.2015.12.019 doi: 10.1016/j.aml.2015.12.019
|
| [7] | S. J. Chen, X. Lü, M. G. Li, F. Wang, Derivation and simulation of the M-lump solutions to two (2+1)-dimensional nonlinear equations. Phys. Scr., 96 (2021), 095201. https://doi.org/10.1088/1402-4896/abf307 |
| [8] |
X. Lü, S. J. Chen, Interaction solutions to nonlinear partial differential equations via Hirota bilinear forms: one-lump-multi-stripe and one-lump-multi-soliton types, Nonlinear Dyn., 103 (2021), 947–977. https://doi.org/10.1007/s11071-020-06068-6 doi: 10.1007/s11071-020-06068-6
|
| [9] |
J. Rao, K. W. Chow, D. Mihalache, J. He, Completely resonant collision of lumps and line solitons in the Kadomtsev-Petviashvili I equation, Stud. Appl. Math., 147 (2021), 1007–1035. https://doi.org/10.1111/sapm.12417 doi: 10.1111/sapm.12417
|
| [10] |
Y. Jiang, J. Rao, D. Mihalache, J. He, Y. Cheng, Rogue breathers and rogue lumps on a background of dark line solitons for the Maccari system, Commun. Nonlin. Sci. Numer. Simul., 102 (2021), 105943. https://doi.org/10.1016/j.cnsns.2021.105943 doi: 10.1016/j.cnsns.2021.105943
|
| [11] |
Y. L. Cao, Y. Cheng, J. S. He, Y. R. Chen, High-order breather, M-kink lump and semi-rational solutions of potential Kadomtsev-Petviashvili equation, Commun. Theor. Phys., 73 (2021), 035004. https://doi.org/10.1088/1572-9494/abdaa6 doi: 10.1088/1572-9494/abdaa6
|
| [12] |
H. T. Wang, X. Y. Wen, Modulational instability and mixed breather-lump interaction solutions in the (2+1)-dimensional KMN equation, Mod. Phys. Lett. B, 34 (2020), 2050092. https://doi.org/10.1142/S021798492050092X doi: 10.1142/S021798492050092X
|
| [13] |
Y. Q. Liu, X. Y. Wen, Soliton, breather, lump and their interaction solutions of the (2 +1)-dimensional asymmetrical Nizhnik-Novikov-Veselov equation, Adv. Differ. Equations, 1 (2019), 332. https://doi.org/10.1186/s13662-019-2271-5 doi: 10.1186/s13662-019-2271-5
|
| [14] |
Y. Q. Liu, X. Y. Wen, D. S. Wang, Novel interaction phenomena of localized waves in the generalized (3+1)-dimensional KP equation, Comput. Math. Appl., 78 (2019), 1–19. https://doi.org/10.1016/j.camwa.2019.03.005 doi: 10.1016/j.camwa.2019.03.005
|
| [15] |
J. J. Su, S. Zhang, Nth-order rogue waves for the AB system via the determinants, Appl. Math. Lett., 112 (2021), 06714. https://doi.org/10.1016/j.aml.2020.106714 doi: 10.1016/j.aml.2020.106714
|
| [16] |
J. J. Su, G. F. Deng, Quasi-periodic waves and irregular solitary waves of the AB system, Waves Random Complex Medium, 32 (2022), 856–866. https://doi.org/10.1080/17455030.2020.1804091 doi: 10.1080/17455030.2020.1804091
|
| [17] |
J. J. Su, Y. T. Gao, G. F. Deng, T. T. Jia, Solitary waves, breathers, and rogue waves modulated by long waves for a model of a baroclinic shear flow, Phys. Rev. E, 100 (2019), 042210. https://doi.org/10.1103/PhysRevE.100.042210 doi: 10.1103/PhysRevE.100.042210
|
| [18] |
R. F. Zhang, M. C. Li, M. Albishari, F. C. Zheng, Z. Z. Lan, Generalized lump solutions, classical lump solutions and rogue waves of the (2+1)-dimensional Caudrey-Dodd-Gibbon-Kotera-Sawada-like equation, Appl. Math. Comput., 403 (2021), 126201. https://doi.org/10.1016/j.amc.2021.126201 doi: 10.1016/j.amc.2021.126201
|
| [19] |
Z. Z. Lan, J. J. Su, Solitary and rogue waves with controllable backgrounds for the non-autonomous generalized AB system, Nonlinear Dyn., 96 (2019), 2535–2546. https://doi.org/10.1007/s11071-019-04939-1 doi: 10.1007/s11071-019-04939-1
|
| [20] |
Z. Z. Lan, Periodic, breather and rogue wave solutions for a generalized (3+1)-dimensional variable-coefficient B-type Kadomtsev-Petviashvili equation in fluid dynamics, Appl. Math. Lett., 94 (2019), 126–132. https://doi.org/10.1016/j.aml.2018.12.005 doi: 10.1016/j.aml.2018.12.005
|
| [21] |
Z. L. Zhao, Y. Chen, B. Han, Lump soliton, mixed lump stripe and periodic lump solutions of a (2+1)-dimensional asymmetrical Nizhnik-Novikov-Veselov equation, Mod. Phys. Lett. B, 31 (2017), 1750157. https://doi.org/10.1142/S0217984917501573 doi: 10.1142/S0217984917501573
|
| [22] |
Y. F. Yue, Y. Chen, Dynamics of localized waves in a (3+1)-dimensional nonlinear evolution equation, Mod. Phys. Lett. B, 33 (2019), 1950101. https://doi.org/10.1142/S021798491950101X doi: 10.1142/S021798491950101X
|
| [23] |
X. L. Tang, Y. Chen, Lumps, breathers, rogue waves and interaction solutions to a (3+1)-dimensional Kudryashov-Sinelshchikov equation, Mod. Phys. Lett. B, 34 (2020), 2050117. https://doi.org/10.1142/S0217984920501171 doi: 10.1142/S0217984920501171
|
| [24] |
B. Q. Li, Y. L. Ma, Hybrid soliton and breather waves, solution molecules and breather molecules of a (3+1)-dimensional Geng equation, Phys. Lett. A, 463 (2023), 128672. https://doi.org/10.1016/j.physleta.2023.128672 doi: 10.1016/j.physleta.2023.128672
|
| [25] |
B. Q. Li, Y. L. Ma, Breather, soliton molecules, soliton fusions and fissions, and lump wave of the Caudrey-Dodd-Gibbon equation, Phys. Scr., 98 (2023), 095214. https://doi.org/10.1088/1402-4896/aceb25 doi: 10.1088/1402-4896/aceb25
|
| [26] |
B. Q. Li, Loop-like kink breather and its transition phenomena for the Vakhnenko equation arising from high-frequency wave propagation in electromagnetic physics, Appl. Math. Lett., 112 (2021), 106822. https://doi.org/10.1016/j.aml.2020.106822 doi: 10.1016/j.aml.2020.106822
|
| [27] |
Y. L. Ma, B. Q. Li, Interaction behaviors between solitons, breathers and their hybrid forms for a short pulse equation, Qual. Theory Dyn. Syst., 22 (2023), 146. https://doi.org/10.1007/s12346-023-00844-6 doi: 10.1007/s12346-023-00844-6
|
| [28] |
Y. L. Ma, A. M. Wazwaz, B. Q. Li, Soliton resonances, soliton molecules, soliton oscillations and heterotypic solitons for the nonlinear Maccari system, Nonlinear Dyn., 111 (2023), 18331–18344. https://doi.org/10.1007/s11071-023-08798-9 doi: 10.1007/s11071-023-08798-9
|
| [29] |
C. R. Gilson, J. J. C. Nimmo, R. Willox, A (2+1)-dimensional generalization of the AKNS shallow water wave equation, Phys. Lett. A, 180 (1993), 337–345. https://doi.org/10.1016/0375-9601(93)91187-A doi: 10.1016/0375-9601(93)91187-A
|
| [30] |
A. C. Petter, L. M. Elizabeth, Symmetry reductions and exact solutions of shallow water wave equations, Acta Appl. Math., 39 (1995), 245–276. https://doi.org/10.1007/BF00994636 doi: 10.1007/BF00994636
|
| [31] |
A. M. Wazwaz, New integrable (2+1)-and (3+1)-dimensional shallow water wave equations: multiple soliton solutions and lump solutions, Int. J. Numer. Methods Heat Fluid Flow, 32 (2022), 138–149. https://doi.org/10.1108/HFF-01-2021-0019 doi: 10.1108/HFF-01-2021-0019
|
| [32] |
G. Q. Xu, Y. P. Liu, W. Y. Cui, Painlevé analysis, integrability property and multiwave interaction solutions for a new (4+1)-dimensional KdV-Calogero-Bogoyavlenkskii-Schiff equation, Appl. Math. Lett., 132 (2022), 108184. https://doi.org/10.1016/j.aml.2022.108184 doi: 10.1016/j.aml.2022.108184
|
| [33] |
A. M. Wazwaz, Two new Painlevé integrable KdV-Calogero-Bogoyavlenskii-Schiff (KdV-CBS) equation and new negative-order KdV-CBS equation, Nonlinear Dyn., 104 (2021), 4311–4315. https://doi.org/10.1007/s11071-021-06537-6 doi: 10.1007/s11071-021-06537-6
|
| [34] |
K. J. Wang, J. H. Liu, Diverse optical solitons to the nonlinear Schrödinger equation via two novel techniques, Eur. Phys. J. Plus, 138 (2023), 74. https://doi.org/10.1140/epjp/s13360-023-03710-1 doi: 10.1140/epjp/s13360-023-03710-1
|
| [35] |
Y. L. Ma, A. M. Wazwaz, B. Q. Li, A new (3+1)-dimensional Kadomtsev-Petviashvili equation and its integrability, multiple-solitons, breathers and lump waves, Math. Comput. Simulat., 187 (2021), 505–519. https://doi.org/10.1016/j.matcom.2021.03.012 doi: 10.1016/j.matcom.2021.03.012
|
| [36] |
F. Baronio, S. Wabnitz, Y. Kodama, Optical Kerr spatiotemporal dark-lump dynamics of hydrodynamic origin, Phys. Rev. Lett., 116 (2016), 173901. https://doi.org/10.1103/PhysRevLett.116.173901 doi: 10.1103/PhysRevLett.116.173901
|
| [37] |
Y. L. Ma, B. Q. Li, Bifurcation solitons and breathers for the nonlocal Boussinesq equations, Appl. Math. Lett., 124 (2023), 107677. https://doi.org/10.1016/j.aml.2021.107677 doi: 10.1016/j.aml.2021.107677
|
| [38] |
R. F. Zhang, M. C. Li, H. M. Yin, Rogue wave solutions and the bright and dark solitons of the (3+1)-dimensional Jimbo-Miwa equation, Nonlinear Dyn., 103 (2021), 1071–1079. https://doi.org/10.1007/s11071-020-06112-5 doi: 10.1007/s11071-020-06112-5
|
| [39] |
Y. L. Ma, B. Q. Li, Mixed lump and soliton solutions for a generalized (3+1)-dimensional Kadomtsev-Petviashvili equation, AIMS Math., 5 (2020), 1162–1176. https://doi.org/10.3934/math.2020080 doi: 10.3934/math.2020080
|
| [40] |
Y. Y. Gu, L. W. Liao, Closed form solutions of Gerdjikov-Ivanov equation in nonlinear fiber optics involving the beta derivatives, Int. J. Mod. Phys. B, 36 (2022), 2250116. https://doi.org/10.1142/S0217979222501168 doi: 10.1142/S0217979222501168
|
| [41] |
B. Q. Li, Y. L. Ma, Multiple-lump waves for a (3+1)-dimensional Boiti-Leon-Manna-Pempinelli equation arising from incompressible fluid, Comput. Math. Appl., 76 (2023), 204–214. https://doi.org/10.1016/j.camwa.2018.04.015 doi: 10.1016/j.camwa.2018.04.015
|
| [42] |
Y. Y. Gu, C. F. Wu, X. Yao, W. J. Yuan, Characterizations of all real solutions for the KdV equation and $W_R$, Appl. Math. Lett., 107 (2020), 106446. https://doi.org/10.1016/j.aml.2020.106446 doi: 10.1016/j.aml.2020.106446
|
| [43] |
Y. L. Ma, A. M. Wazwaz, B. Q. Li, New extended Kadomtsev-Petviashvili equation: multiple soliton solutions, breather, lump and interaction solutions, Nonlinear Dyn., 104 (2021), 1581–1594. https://doi.org/10.1007/s11071-021-06357-8 doi: 10.1007/s11071-021-06357-8
|
| [44] |
Y. Y. Gu, W. J. Yuan, N. Aminakbari, J. M. Lin, Meromorphic solutions of some algebraic differential equations related Painleve equation IV and its applications, Math. Methods Appl. Sci., 41 (2018), 3832–3840. https://doi.org/10.1002/mma.4869 doi: 10.1002/mma.4869
|
| [45] |
B. Q. Li, Y. L. Ma, Extended generalized Darboux transformation to hybrid rogue wave and breather solutions for a nonlinear Schrödinger equation, Appl. Math. Comput., 386 (2020), 125469. https://doi.org/10.1016/j.amc.2020.125469 doi: 10.1016/j.amc.2020.125469
|
| [46] |
B. Q. Li, Y. L. Ma, Interaction dynamics of hybrid solitons and breathers for extended generalization of Vakhnenko equation, Nonlinear Dyn., 102 (2020), 1787–1799. https://doi.org/10.1007/s11071-020-06024-4 doi: 10.1007/s11071-020-06024-4
|
| [47] |
B. Q. Li, Hybrid breather and rogue wave solution for a (2+1)-dimensional ferromagnetic spin chain system with variable coefficients, Int. J. Comput. Math., 99 (2022), 506–519. https://doi.org/10.1080/00207160.2021.1922678 doi: 10.1080/00207160.2021.1922678
|
| [48] |
Y. L. Ma, B. Q. Li, Hybrid rogue wave and breather solutions for a complex mKdV equation in few-cycle ultra-short pulse optics, Eur. Phys. J. Plus, 137 (2022), 861. https://doi.org/10.1140/epjp/s13360-022-03080-0 doi: 10.1140/epjp/s13360-022-03080-0
|


Figures(4)

Hong-Yang Guan, Jian-Guo Liu. Propagation of lump-type waves in nonlinear shallow water wave[J]. Mathematical Biosciences and Engineering, 2023, 20(11): 19553-19564. doi: 10.3934/mbe.2023866


 DownLoad: