The goal of this study is to develop a mathematical model that captures the interaction between evofosfamide, immunotherapy, and the hypoxic landscape of the tumor in the treatment of tumors. Recently, we showed that evofosfamide, a hypoxia-activated prodrug, can synergistically improve treatment outcomes when combined with immunotherapy, while evofosfamide alone showed no effects in an in vivo syngeneic model of colorectal cancer. However, the mechanisms behind the interaction between the tumor microenvironment in the context of oxygenation (hypoxic, normoxic), immunotherapy, and tumor cells are not fully understood. To begin to understand this issue, we develop a system of ordinary differential equations to simulate the growth and decline of tumors and their vascularization (oxygenation) in response to treatment with evofosfamide and immunotherapy (6 combinations of scenarios). The model is calibrated to data from in vivo experiments on mice implanted with colon adenocarcinoma cells and longitudinally imaged with [18F]-fluoromisonidazole ([18F]FMISO) positron emission tomography (PET) to quantify hypoxia. The results show that evofosfamide is able to rescue the immune response and sensitize hypoxic tumors to immunotherapy. In the hypoxic scenario, evofosfamide reduces tumor burden by $ 45.07 \pm 2.55 $%, compared to immunotherapy alone, as measured by tumor volume. The model accurately predicts the temporal evolution of five different treatment scenarios, including control, hypoxic tumors that received immunotherapy, normoxic tumors that received immunotherapy, evofosfamide alone, and hypoxic tumors that received combination immunotherapy and evofosfamide. The average concordance correlation coefficient (CCC) between predicted and observed tumor volume is $ 0.86 \pm 0.05 $. Interestingly, the model values to fit those five treatment arms was unable to accurately predict the response of normoxic tumors to combination evofosfamide and immunotherapy (CCC = $ -0.064 \pm 0.003 $). However, guided by the sensitivity analysis to rank the most influential parameters on the tumor volume, we found that increasing the tumor death rate due to immunotherapy by a factor of $ 18.6 \pm 9.3 $ increases CCC of $ 0.981 \pm 0.001 $. To the best of our knowledge, this is the first study to mathematically predict and describe the increased efficacy of immunotherapy following evofosfamide.
Citation: Ernesto A. B. F. Lima, Patrick N. Song, Kirsten Reeves, Benjamin Larimer, Anna G. Sorace, Thomas E. Yankeelov. Predicting response to combination evofosfamide and immunotherapy under hypoxic conditions in murine models of colon cancer[J]. Mathematical Biosciences and Engineering, 2023, 20(10): 17625-17645. doi: 10.3934/mbe.2023783
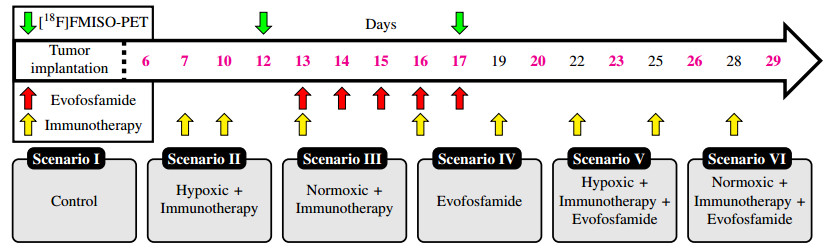
The goal of this study is to develop a mathematical model that captures the interaction between evofosfamide, immunotherapy, and the hypoxic landscape of the tumor in the treatment of tumors. Recently, we showed that evofosfamide, a hypoxia-activated prodrug, can synergistically improve treatment outcomes when combined with immunotherapy, while evofosfamide alone showed no effects in an in vivo syngeneic model of colorectal cancer. However, the mechanisms behind the interaction between the tumor microenvironment in the context of oxygenation (hypoxic, normoxic), immunotherapy, and tumor cells are not fully understood. To begin to understand this issue, we develop a system of ordinary differential equations to simulate the growth and decline of tumors and their vascularization (oxygenation) in response to treatment with evofosfamide and immunotherapy (6 combinations of scenarios). The model is calibrated to data from in vivo experiments on mice implanted with colon adenocarcinoma cells and longitudinally imaged with [18F]-fluoromisonidazole ([18F]FMISO) positron emission tomography (PET) to quantify hypoxia. The results show that evofosfamide is able to rescue the immune response and sensitize hypoxic tumors to immunotherapy. In the hypoxic scenario, evofosfamide reduces tumor burden by $ 45.07 \pm 2.55 $%, compared to immunotherapy alone, as measured by tumor volume. The model accurately predicts the temporal evolution of five different treatment scenarios, including control, hypoxic tumors that received immunotherapy, normoxic tumors that received immunotherapy, evofosfamide alone, and hypoxic tumors that received combination immunotherapy and evofosfamide. The average concordance correlation coefficient (CCC) between predicted and observed tumor volume is $ 0.86 \pm 0.05 $. Interestingly, the model values to fit those five treatment arms was unable to accurately predict the response of normoxic tumors to combination evofosfamide and immunotherapy (CCC = $ -0.064 \pm 0.003 $). However, guided by the sensitivity analysis to rank the most influential parameters on the tumor volume, we found that increasing the tumor death rate due to immunotherapy by a factor of $ 18.6 \pm 9.3 $ increases CCC of $ 0.981 \pm 0.001 $. To the best of our knowledge, this is the first study to mathematically predict and describe the increased efficacy of immunotherapy following evofosfamide.

| [1] |
D. Hanahan, Hallmarks of Cancer: New Dimensions, Cancer Discov., 12 (2022), 31–46. https://doi.org/10.1158/2159-8290.CD-21-1059 doi: 10.1158/2159-8290.CD-21-1059

|
| [2] |
I. N. Fleming, R. Manavaki, P. J. Blower, C. West, K. J. Williams, A. L. Harris, et al., Imaging tumour hypoxia with positron emission tomography, Br. J. Cancer, 112 (2015), 238–250. https://doi.org/10.1038/bjc.2014.610 doi: 10.1038/bjc.2014.610
|
| [3] |
B. Muz, P. de la Puente, F. D. Azab, A. K. Azab, The role of hypoxia in cancer progression, angiogenesis, metastasis, and resistance to therapy, Hypoxia, 3 (2015), 83–92. https://doi.org/10.2147/HP.S93413 doi: 10.2147/HP.S93413
|
| [4] |
P. Vaupel, A. Mayer, Hypoxia in cancer: Significance and impact on clinical outcome, Cancer Metastasis Rev., 26 (2007), 225–239. https://doi.org/10.1007/s10555-007-9055-1 doi: 10.1007/s10555-007-9055-1
|
| [5] |
S. Chouaib, M. Z. Noman, K. Kosmatopoulos, M. A. Curran, Hypoxic stress: Obstacles and opportunities for innovative immunotherapy of cancer, Oncogene, 36 (2017), 439–445. https://doi.org/10.1038/onc.2016.225 doi: 10.1038/onc.2016.225
|
| [6] |
C. R. Hong, B. D. Dickson, J. K. Jaiswal, F. B. Pruijn, F. W. Hunter, M. P. Hay, et al., Cellular pharmacology of evofosfamide (th-302): A critical re-evaluation of its bystander effects, Biochem. Pharmacol., 156 (2018), 265–280. https://doi.org/10.1016/j.bcp.2018.08.027 doi: 10.1016/j.bcp.2018.08.027
|
| [7] |
Z. Fu, A. M. Mowday, J. B. Smaill, I. F Hermans, A. V. Patterson, Tumour hypoxia-mediated immunosuppression: Mechanisms and therapeutic approaches to improve cancer immunotherapy, Cells, 10 (2021), 1006. https://doi.org/10.3390/cells10051006 doi: 10.3390/cells10051006
|
| [8] |
K. M. Reeves, P. N. Song, A. Angermeier, D. D. Manna, Y. F. Li, J. B. Wang, et al., 18f-fmiso pet imaging identifies hypoxia and immunosuppressive tumor microenvironments and guides targeted evofosfamide therapy in tumors refractory to pd-1 and ctla-4 inhibition, Clin. Cancer Res., 28 (2022), 327–337. https://doi.org/10.1158/1078-0432.CCR-21-2394 doi: 10.1158/1078-0432.CCR-21-2394
|
| [9] |
A. Hegde, P. Jayaprakash, C. A. Couillault, S. Piha-Paul, D. Karp, J. Rodon, et al., A phase i dose-escalation study to evaluate the safety and tolerability of evofosfamide in combination with ipilimumab in advanced solid malignanciesphase i study of evofosfamide and ipilimumab in solid tumors, Clin. Cancer Res., 27 (2021), 3050–3060. https://doi.org/10.1158/1078-0432.CCR-20-4118 doi: 10.1158/1078-0432.CCR-20-4118
|
| [10] |
L. Spiegelberg, S. J. van Hoof, R. Biemans, N. G. Lieuwes, D. Marcus, R. Niemans, et al., Evofosfamide sensitizes esophageal carcinomas to radiation without increasing normal tissue toxicity, Radiother. Oncol., 141 (2019), 247–255. https://doi.org/10.1016/j.radonc.2019.06.034 doi: 10.1016/j.radonc.2019.06.034
|
| [11] |
T. Badar, D. R. Handisides, J. M. Benito, M. A. Richie, G. Borthakur, E. Jabbour, et al., Phase i study of evofosfamide, an investigational hypoxia-activated prodrug, in patients with advanced leukemia, Am. J. Hematol., 91 (2016), 800–805. https://doi.org/10.1002/ajh.24415 doi: 10.1002/ajh.24415
|
| [12] |
S. Kishimoto, J. R. Brender, G. V. R. Chandramouli, Y. Saida, K. Yamamoto, J. B. Mitchell, et al., Hypoxia-activated prodrug evofosfamide treatment in pancreatic ductal adenocarcinoma xenografts alters the tumor redox status to potentiate radiotherapy, Antioxid. Redox Signal., 35 (2021), 904–915. https://doi.org/10.1089/ars.2020.8131 doi: 10.1089/ars.2020.8131
|
| [13] |
J. P Laubach, C.-J. Liu, N. S. Raje, A. J. Yee, P. Armand, R. L. Schlossman, et al., A phase i/ii study of evofosfamide, a hypoxia-activated prodrug with or without bortezomib in subjects with relapsed/refractory multiple myelomaphase i/ii study of evofosfamide in multiple myeloma, Clin. Cancer Res., 25 (2019), 478–486. https://doi.org/10.1158/1078-0432.CCR-18-1325 doi: 10.1158/1078-0432.CCR-18-1325
|
| [14] |
A. J. Brenner, J. Floyd, L. Fichtel, J. Michalek, K. P. Kanakia, S. l. Huang, et al., Phase 2 trial of hypoxia activated evofosfamide (th302) for treatment of recurrent bevacizumab-refractory glioblastoma, Sci. Rep., 11 (2021), 1–6. https://doi.org/10.1038/s41598-021-81841-0 doi: 10.1038/s41598-021-81841-0
|
| [15] |
P. Jayaprakash, M. Ai, A. Liu, P. Budhani, T. Bartkowiak, J. Sheng, et al., Targeted hypoxia reduction restores t cell infiltration and sensitizes prostate cancer to immunotherapy, J. Clin. Invest., 128 (2018), 5137–5149. https://doi.org/10.1172/JCI96268 doi: 10.1172/JCI96268
|
| [16] | E. Lopci, Pet radiopharmaceuticals for imaging of tumor hypoxia: A review of the evidence, Am. J. Nucl. Med. Mol. Imaging, 4 (2014), 365. |
| [17] |
S. Kumar, J. D. Sun, L. B. Zhang, R. B. Mokhtari, B. Wu, F. Y. Meng, et al., Hypoxia-targeting drug evofosfamide (th-302) enhances sunitinib activity in neuroblastoma xenograft models, Transl. Oncol., 11 (2018), 911–919. https://doi.org/10.1016/j.tranon.2018.05.004 doi: 10.1016/j.tranon.2018.05.004
|
| [18] |
C. Meaney, S. Rhebergen, M. Kohandel, In silico analysis of hypoxia activated prodrugs in combination with anti angiogenic therapy through nanocell delivery, PLoS Computat. Biol., 16 (2020), e1007926. https://doi.org/10.1371/journal.pcbi.1007926 doi: 10.1371/journal.pcbi.1007926
|
| [19] |
D. Lindsay, C. M. Garvey, S. M. Mumenthaler, J. Foo, Leveraging hypoxia-activated prodrugs to prevent drug resistance in solid tumors, PLoS Computat. Biol., 12 (2016), e1005077. https://doi.org/10.1371/journal.pcbi.1005077 doi: 10.1371/journal.pcbi.1005077
|
| [20] | S. Hamis, M. Kohandel, M. Kohandel, L. J. Dubois, A. Yaromina, P. Lambin, et al., Combining hypoxia-activated prodrugs and radiotherapy in silico: Impact of treatment scheduling and the intra-tumoural oxygen landscape. PLoS Computat. Biol., 16 (2020), e1008041. https://doi.org/10.1371/journal.pcbi.1008041 |
| [21] |
A. Saltelli, K. Aleksankina, W. Becker, P. Fennell, F. Ferretti, N. Holst, et al., Why so many published sensitivity analyses are false: A systematic review of sensitivity analysis practices, Environ. Model. Softw., 114 (2019), 29–39. https://doi.org/10.1016/j.envsoft.2019.01.012 doi: 10.1016/j.envsoft.2019.01.012
|
| [22] | A. Saltelli, Global Sensitivity Analysis: The Primer. Wiley, 2008. |
| [23] | A. Saltelli, K. Chan, E. M. Scott, Sensitivity Analysis, Number no. 2008 in Wiley paperback series, (2009), Wiley. |
| [24] |
A. Saltelli, P. Annoni, I. Azzini, F. Campolongo, M. Ratto, S. Tarantola, Variance based sensitivity analysis of model output. design and estimator for the total sensitivity index, Comp. Phys. Commun., 181 (2010), 259–270. https://doi.org/10.1016/j.cpc.2009.09.018 doi: 10.1016/j.cpc.2009.09.018
|
| [25] |
M. J. W. Jansen, Analysis of variance designs for model output, Comp. Phys. Commun., 117 (1989), 35–43. https://doi.org/10.1016/S0010-4655(98)00154-4 doi: 10.1016/S0010-4655(98)00154-4
|
| [26] | J. C. Butcher, The numerical analysis of ordinary differential equations: Runge-Kutta and general linear methods, Wiley-Interscience, 1987. |
| [27] |
E. Prudencio, S. H. Cheung, Parallel adaptive multilevel sampling algorithms for the bayesian analysis of mathematical models, Int. J. Uncertain. Quantif., 2 (2012). https://doi.org/10.1615/Int.J.UncertaintyQuantification.2011003499 doi: 10.1615/Int.J.UncertaintyQuantification.2011003499
|
| [28] |
G. O. Roberts, J. S. Rosenthal, General state space markov chains and mcmc algorithms. Probab. Surv., 1 (2004), 20–71. https://doi.org/10.1214/154957804100000024 doi: 10.1214/154957804100000024
|
| [29] |
A. Gelman, D. B. Rubin, Inference from iterative simulation using multiple sequences. Stat. Sci, , 7 (1992), 457–472. https://doi.org/10.1214/ss/1177011136 doi: 10.1214/ss/1177011136
|
| [30] | Ernesto E Prudencio, Karl W Schulz. The parallel C++ statistical library 'QUESO': Quantification of Uncertainty for Estimation, Simulation and Optimization. In Euro-Par 2011: Parallel Processing Workshops, (2012), 398–407, Springer. https://doi.org/10.1007/978-3-642-29737-3_44 |
| [31] |
P. Jayaprakash, P. D. A. Vignali, G. M. Delgoffe, M. A. Curran, Hypoxia reduction sensitizes refractory cancers to immunotherapy, Annu. Rev. Med., 73 (2022), 251–265. https://doi.org/10.1146/annurev-med-060619-022830 doi: 10.1146/annurev-med-060619-022830
|
| [32] |
E. A. B. F. Lima, D. Faghihi, R. Philley, J. C. Yang, J. Virostko, C. M. Phillips, et al., Bayesian calibration of a stochastic, multiscale agent-based model for predicting in vitro tumor growth, PLoS Computat. Biol., 17 (2021), e1008845. https://doi.org/10.1371/journal.pcbi.1008845 doi: 10.1371/journal.pcbi.1008845
|
| [33] |
C. M Phillips, E. A. B. F. Lima, R. T. Woodall, A. Brock, T. E. Yankeelov, A hybrid model of tumor growth and angiogenesis: In silico experiments, Plos One, 15 (2020), e0231137. https://doi.org/10.1371/journal.pone.0231137 doi: 10.1371/journal.pone.0231137
|
| [34] |
E. A. B. F. Lima, J. T. Oden, D. A. Hormuth, T. E. Yankeelov, R. C. Almeida, Selection, calibration, and validation of models of tumor growth, Math.Models Methods Appl. Sci., 26 (2016), 2341–2368. https://doi.org/10.1142/S021820251650055X doi: 10.1142/S021820251650055X
|
| [35] |
E. A. B. F. Lima, R. A. F. Wyde, A. G. Sorace, T. E. Yankeelov, Optimizing combination therapy in a murine model of her2+ breast cancer, Comput. Methods Appl. Mech. Eng., 402 (2022), 115484. https://doi.org/10.1016/j.cma.2022.115484 doi: 10.1016/j.cma.2022.115484
|
| [36] |
T. E. Yankeelov, J. C. Gore, Dynamic contrast enhanced magnetic resonance imaging in oncology: theory, data acquisition, analysis, and examples, Curr. Med. Imaging, 3 (2007), 91–107. https://doi.org/10.2174/157340507780619179 doi: 10.2174/157340507780619179
|
| [37] |
G. Lestini, F. Mentré, P. Magni, Optimal design for informative protocols in xenograft tumor growth inhibition experiments in mice, AAPS J., 18 (2016), 1233–1243. https://doi.org/10.1208/s12248-016-9924-z doi: 10.1208/s12248-016-9924-z
|
| [38] | S. D. Cárdenas, C. J. Reznik, R. Ranaweera, F. F. Song, C. H. Chung, E. J. Fertig, et al., Model-informed experimental design recommendations for distinguishing intrinsic and acquired targeted therapeutic resistance in head and neck cancer. npj Syst. Biol. Appl., 8 (2022), 32. https://doi.org/10.1038/s41540-022-00244-7 |
| [39] |
S. Bandara, J. P. Schlöder, R. Eils, H. G. Bock, T. Meyer, Optimal experimental design for parameter estimation of a cell signaling model, PLoS Computat. Biol., 5 (2009), e1000558. https://doi.org/10.1371/journal.pcbi.1000558 doi: 10.1371/journal.pcbi.1000558
|
| [40] |
H. W. Wang, C. Zhao, C. A. Santa-Maria, L. A. Emens, A. S. Popel, Dynamics of tumor-associated macrophages in a quantitative systems pharmacology model of immunotherapy in triple-negative breast cancer, iScience, 25 (2022). https://doi.org/10.1016/j.isci.2022.104702 doi: 10.1016/j.isci.2022.104702
|
| [41] |
P. Saxena, S. Gambhir, M. Dixit, Insight into tumor hypoxia: Radionuclide-based biomarker as diagnostic tools, Curr. Top. Med. Chem., 23 (2023), 1136–1154. https://doi.org/10.2174/1568026623666230515154442 doi: 10.2174/1568026623666230515154442
|


Figures(7) / Tables(2)

Ernesto A. B. F. Lima, Patrick N. Song, Kirsten Reeves, Benjamin Larimer, Anna G. Sorace, Thomas E. Yankeelov. Predicting response to combination evofosfamide and immunotherapy under hypoxic conditions in murine models of colon cancer[J]. Mathematical Biosciences and Engineering, 2023, 20(10): 17625-17645. doi: 10.3934/mbe.2023783


 DownLoad: