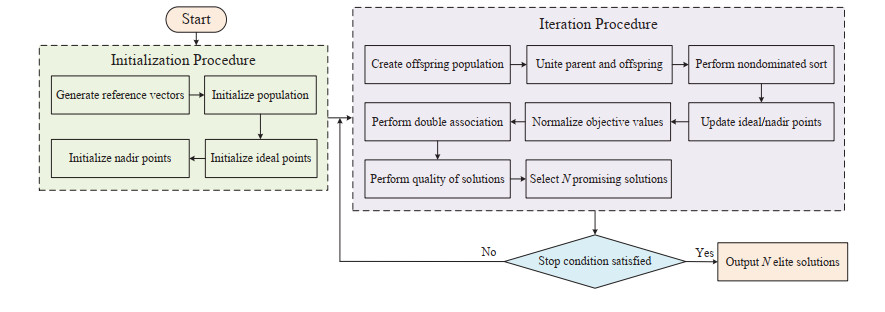
In this paper, a double association-based evolutionary algorithm (denoted as DAEA) is proposed to solve many-objective optimization problems. In the proposed DAEA, a double association strategy is designed to associate solutions with each subspace. Different from the existing association methods, the double association strategy takes the empty subspace into account and associates it with a promising solution, which can facilitate the exploration of unknown areas. Besides, a new quality evaluation scheme is developed to evaluate the quality of each solution in subspace, where the convergence and diversity of each solution is first measured, and in order to evaluate the diversity of solutions more finely, the global diversity and local diversity is designed to measure the diversity of each solution. Then, a dynamic penalty coefficient is designed to balance the convergence and diversity by penalizing the global diversity distribution of solutions. The performance of DAEA is validated by comparing with five state-of-the-art many-objective evolutionary algorithms on a number of well-known benchmark problems with up to 20 objectives. Experimental results show that our DAEA has high competitiveness in solving many-objective optimizatiopn problems compared with the other compared algorithms.
Citation: Junhua Liu, Wei Zhang, Mengnan Tian, Hong Ji, Baobao Liu. A double association-based evolutionary algorithm for many-objective optimization[J]. Mathematical Biosciences and Engineering, 2023, 20(9): 17324-17355. doi: 10.3934/mbe.2023771
In this paper, a double association-based evolutionary algorithm (denoted as DAEA) is proposed to solve many-objective optimization problems. In the proposed DAEA, a double association strategy is designed to associate solutions with each subspace. Different from the existing association methods, the double association strategy takes the empty subspace into account and associates it with a promising solution, which can facilitate the exploration of unknown areas. Besides, a new quality evaluation scheme is developed to evaluate the quality of each solution in subspace, where the convergence and diversity of each solution is first measured, and in order to evaluate the diversity of solutions more finely, the global diversity and local diversity is designed to measure the diversity of each solution. Then, a dynamic penalty coefficient is designed to balance the convergence and diversity by penalizing the global diversity distribution of solutions. The performance of DAEA is validated by comparing with five state-of-the-art many-objective evolutionary algorithms on a number of well-known benchmark problems with up to 20 objectives. Experimental results show that our DAEA has high competitiveness in solving many-objective optimizatiopn problems compared with the other compared algorithms.

| [1] |
J. Sun, Z. Miao, D. Gong, X. Zeng, J. Li, G. Wang, Interval multiobjective optimization with memetic algorithms, IEEE Trans. Cybern., 50 (2022), 3444–3457. https://doi.org/10.1109/TCYB.2019.2908485 doi: 10.1109/TCYB.2019.2908485

|
| [2] |
Y. Hua, Q. Liu, K. Hao, Y. Jin, A survey of evolutionary algorithms for multi-objective optimization problems with irregular pareto fronts, IEEE-CAA J. Automatica Sin., 8 (2021), 303–318. https://doi.org/10.1109/JAS.2021.1003817 doi: 10.1109/JAS.2021.1003817
|
| [3] |
L. Ma, N. Li, Y. Guo, X. Wang, S. Yang, M. Huang, et al., Learning to optimize: Reference vector reinforcement learning adaption to constrained many-objective optimization of industrial copper burdening system, IEEE Trans. Cybern., 52 (2022), 12698–12711. https://doi.org/10.1109/TCYB.2021.3086501 doi: 10.1109/TCYB.2021.3086501
|
| [4] |
Z. Zhang, M. Zhao, H. Wang, Z. Cui, W. Zhang, An efficient interval many-objective evolutionary algorithm for cloud task scheduling problem under uncertainty, Inf. Sci., 583 (2022), 56–72. https://doi.org/10.1016/j.ins.2021.11.027 doi: 10.1016/j.ins.2021.11.027
|
| [5] |
M. Gao, B. Ai, Y. Niu, W. Wu, P. Yang, F. Lyu, et al., Efficient hybrid beamforming with anti-blockage design for high-speed railway communications, IEEE Trans. Veh. Technol., 69 (2020), 9643–9655. https://doi.org/10.1109/TVT.2020.3000757 doi: 10.1109/TVT.2020.3000757
|
| [6] |
C. Tan, J. Yao, K. Tang, J. Sun, Cycle-based queue length estimation for signalized intersections using sparse vehicle trajectory data, IEEE Trans. Intell. Transp. Syst., 22 (2021), 91–106. https://doi.org/10.1109/TITS.2019.2954937 doi: 10.1109/TITS.2019.2954937
|
| [7] |
Y. Guo, X. Tian, G. Fang, Y. Xu, Many-objective optimization with improved shuffled frog leaping algorithm for inter-basin water transfers, Adv. Water Resour., 138 (2020), 103531. https://doi.org/10.1016/j.advwatres.2020.103531 doi: 10.1016/j.advwatres.2020.103531
|
| [8] |
F. Li, L. Gao, A. Garg, W. Shen, S. Huang, Two infill criteria driven surrogate-assisted multi-objective evolutionary algorithms for computationally expensive problems with medium dimensions, Swarm Evol. Comput., 60 (2021), 100774. https://doi.org/10.1016/j.swevo.2020.100774 doi: 10.1016/j.swevo.2020.100774
|
| [9] |
M. Wu, L. Wang, J. Xu, P. Hu, P. Xu, Adaptive surrogate-assisted multi-objective evolutionary algorithm using an efficient infill technique, Swarm Evol. Comput., 75 (2022), 101170. https://doi.org/10.1016/j.swevo.2022.101170 doi: 10.1016/j.swevo.2022.101170
|
| [10] |
B. Li, J. Li, K. Tang, X. Yao, Many-objective evolutionary algorithms: A survey, ACM Comput. Surv., 48 (2015), 1–35. https://doi.org/10.1145/2792984 doi: 10.1145/2792984
|
| [11] |
K. Deb, A. Pratap, S. Agarwal, T. Meyarivan, A fast and elitist multiobjective genetic algorithm: NSGA-II, IEEE Trans. Evol. Comput., 6 (2002), 182–197. https://doi.org/10.1109/4235.996017 doi: 10.1109/4235.996017
|
| [12] |
W. Zhang, J. Liu, S. Tan, H. Wang, A decomposition-rotation dominance based evolutionary algorithm with reference point adaption for many-objective optimization, Expert Syst. Appl., 215 (2023), 119424. https://doi.org/10.1016/j.eswa.2022.119424 doi: 10.1016/j.eswa.2022.119424
|
| [13] |
M. Laumanns, L. Thiele, K. Deb, E. Zitzler, Combining convergence and diversity in evolutionary multiobjective optimization, Evol. Comput., 10 (2002), 263–282. https://doi.org/10.1162/106365602760234108 doi: 10.1162/106365602760234108
|
| [14] | P. J. Bentley, J. P. Wakefield, Finding acceptable solutions in the Pareto-optimal range using multiobjective genetic algorithms, in Soft Computing in Engineering Design and Manufacturing, (1998), 231–240. https://doi.org/10.1007/978-1-4471-0427-8 |
| [15] |
D. Hadka, P. Reed, Borg: An auto-adaptive many-objective evolutionary computing framework, Evol. Comput., 21 (2013), 231–259. https://doi.org/10.1162/EVCO_a_00075 doi: 10.1162/EVCO_a_00075
|
| [16] |
X. Zou, Y. Chen, M. Liu, L. Kang, A new evolutionary algorithm for solving many-objective optimization problems, IEEE Trans. Syst. Man Cybern. Part B Cybern., 38 (2008), 1402–1412. https://doi.org/10.1109/TSMCB.2008.926329 doi: 10.1109/TSMCB.2008.926329
|
| [17] |
L. Li, G. Li, L. Chang, A many-objective particle swarm optimization with grid dominance ranking and clustering, Appl. Soft. Comput., 96 (2020), 106661. https://doi.org/10.1016/j.asoc.2020.106661 doi: 10.1016/j.asoc.2020.106661
|
| [18] |
F. D. Pierro, S. T. Khu, D. A. Savic, An investigation on preference order ranking scheme for multiobjective evolutionary optimization, IEEE Trans. Evol. Comput., 11 (2007), 17–45. https://doi.org/10.1109/TEVC.2006.876362 doi: 10.1109/TEVC.2006.876362
|
| [19] | G. Wang, H. Jiang, Fuzzy-dominance and its application in evolutionary many objective optimization, in 2007 International Conference on Computational Intelligence and Security Workshops, 2007. https://doi.org/10.1109/CISW.2007.4425478 |
| [20] |
Y. Yuan, H. Xu, B. Wang, X. Yao, A new dominance relation based evolutionary algorithm for many-objective optimization, IEEE Trans. Evol. Comput., 20 (2015), 16–37. https://doi.org/10.1109/TEVC.2015.2420112 doi: 10.1109/TEVC.2015.2420112
|
| [21] |
M. Elarbi, S. Bechikh, A. Gupta, L. B. Said, Y. S. Ong, A new decomposition-based NSGA-II for many-objective optimization, IEEE Trans. Syst. Man Cybern. Syst., 48 (2018), 1191–1210. https://doi.org/10.1109/TSMC.2017.2654301 doi: 10.1109/TSMC.2017.2654301
|
| [22] | K. Ikeda, H. Kita, S. Kobayashi, Failure of pareto-based MOEAs: Does non-dominated really mean near to optimal?, in Proceedings of the 2001 Congress on Evolutionary Computation, 2001. https://doi.org/10.1109/CEC.2001.934293 |
| [23] | H. Sato, H. E. Aguirre, K. Tanaka, Controlling dominance area of solutions and its impact on the performance of moeas, in International Conference on Evolutionary Multi-Criterion Optimization, 2007. https://doi.org/10.1007/978-3-540-70928-2_5 |
| [24] |
C. Dai, Y. Wang, M. Ye, A new evolutionary algorithm based on contraction method for many-objective optimization problems, Appl. Math. Comput., 245 (2014), 191–205. https://doi.org/10.1016/j.amc.2014.07.069 doi: 10.1016/j.amc.2014.07.069
|
| [25] | H. Ishibuchi, N. Tsukamoto, Y. Sakane, Y. Nojima, Indicator-based evolutionary algorithm with hypervolume approximation by achievement scalarizing functions, in Proceedings of the Conference on Genetic and Evolutionary Computation, 2010. https://doi.org/10.1145/1830483.1830578 |
| [26] |
Y. Sun, G. G. Yen, Z. Yi, IGD indicator-based evolutionary algorithm for many-objective optimization problems, IEEE Trans. Evol. Comput., 23 (2019), 173–187. https://doi.org/10.1109/TEVC.2018.2791283 doi: 10.1109/TEVC.2018.2791283
|
| [27] |
E. Zitzler, L. Thiele, Multiobjective evolutionary algorithms: A comparative case study and the strength pareto approach, IEEE Trans. Evol. Comput., 3 (1999), 257–271. https://doi.org/10.1109/4235.797969 doi: 10.1109/4235.797969
|
| [28] | C. A. Rodríguez-Villalobos, C. A. C. Coello, A new multi-objective evolutionary algorithm based on a performance assessment indicator, in Conference on Genetic and Evolutionary Computation, 2012. https://doi.org/10.1145/2330163.2330235 |
| [29] |
J. Bader, E. Zitzler, HypE: An algorithm for fast hypervolume-based many-objective optimization, Evol. Comput., 19 (2014), 45–76. https://doi.org/10.1162/EVCO_a_00009 doi: 10.1162/EVCO_a_00009
|
| [30] |
S. Jiang, S. Yang, A strength pareto evolutionary algorithm based on reference direction for multiobjective and many-objective optimization, IEEE Trans. Evol. Comput., 21 (2017), 329–346. https://doi.org/10.1109/TEVC.2016.2592479 doi: 10.1109/TEVC.2016.2592479
|
| [31] | K. Deb, D. Saxena, On finding pareto-optimal solutions through dimensionality reduction for certain large-dimensional multi-objective optimization problems, Kangal Rep., 2005 (2005), 1–19. |
| [32] |
H. K. Singh, A. Isaacs, T. Ray, A pareto corner search evolutionary algorithm and dimensionality reduction in many-objective optimization problems, IEEE Trans. Evol. Comput., 15 (2011), 539–556. https://doi.org/10.1109/TEVC.2010.2093579 doi: 10.1109/TEVC.2010.2093579
|
| [33] |
L. Thiele, K. Miettinen, P. J. Korhonen, J. Molina, A preference based evolutionary algorithm for multi-objective optimization, Evol. Comput., 17 (2014), 411–436. https://doi.org/10.1162/evco.2009.17.3.411 doi: 10.1162/evco.2009.17.3.411
|
| [34] |
R. Wang, R. C. Purshouse, P. J. Fleming, Preference-inspired coevolutionary algorithms for many-objective optimization, IEEE Trans. Evol. Comput., 17 (2013), 474–494. https://doi.org/10.1109/TEVC.2012.2204264 doi: 10.1109/TEVC.2012.2204264
|
| [35] |
R. Cheng, Y. Jin, M. Olhofer, B. Sendhoff, A reference vector guided evolutionary algorithm for many-objective optimization, IEEE Trans. Evol. Comput., 20 (2016), 773–791. https://doi.org/10.1109/TEVC.2016.2519378 doi: 10.1109/TEVC.2016.2519378
|
| [36] |
Y. Zhao, J. Zeng, Y. Tan, Neighborhood samples and surrogate assisted multi-objective evolutionary algorithm for expensive many-objective optimization problems, Appl. Soft. Comput., 17 (2013), 474–494. https://doi.org/10.1016/j.asoc.2021.107268 doi: 10.1016/j.asoc.2021.107268
|
| [37] |
Q. Zhang, H. Li, MOEA/D: A multiobjective evolutionary algorithm based on decomposition, IEEE Trans. Evol. Comput., 11 (2007), 712–731. https://doi.org/10.1109/TEVC.2007.892759 doi: 10.1109/TEVC.2007.892759
|
| [38] |
H. Zhao, C. Zhang, X. Zheng, C. Zhang, B. Zhang, A decomposition-based many-objective ant colony optimization algorithm with adaptive solution construction and selection approaches, Swarm Evol. Comput., 68 (2022), 100977. https://doi.org/10.1016/j.swevo.2021.100977 doi: 10.1016/j.swevo.2021.100977
|
| [39] |
Y. Zhou, Y. Xiang, Z. Chen, J. He, J. Wang, An adaptive convergence enhanced evolutionary algorithm for many-objective optimization problems, Swarm Evol. Comput., 75 (2022), 101180. https://doi.org/10.1016/j.swevo.2022.101180 doi: 10.1016/j.swevo.2022.101180
|
| [40] |
F. Gu, Y. M. Cheung, Self-organizing map-based weight design for decomposition-based many-objective evolutionary algorithm, IEEE Trans. Evol. Comput., 22 (2018), 211–225. https://doi.org/10.1109/TEVC.2017.2695579 doi: 10.1109/TEVC.2017.2695579
|
| [41] |
D. Han, W. Du, W. Du, Y. Jin, C. Wu, An adaptive decomposition based evolutionary algorithm for many-objective optimization, Inf. Sci., 491 (2019), 204–222. https://doi.org/10.1016/j.ins.2019.03.062 doi: 10.1016/j.ins.2019.03.062
|
| [42] |
R. Liu, J. Liu, R. Zhou, C. Lian, R. Bian, A region division based decomposition approach for evolutionary many-objective optimization, Knowl. Based Syst., 194 (2020), 105518. https://doi.org/10.1016/j.knosys.2020.105518 doi: 10.1016/j.knosys.2020.105518
|
| [43] |
H. Zhao, C. Zhang, B. Zhang, A decomposition-based many-objective ant colony optimization algorithm with adaptive reference points, Inf. Sci., 540 (2020), 435–448. https://doi.org/10.1016/j.ins.2020.06.028 doi: 10.1016/j.ins.2020.06.028
|
| [44] |
L. Ma, M. Huang, S. Yang, R. Wang, X. Wang, An adaptive localized decision variable analysis approach to large-scale multiobjective and many-objective optimization, IEEE Trans. Cybern., 52 (2022), 6684–6696. https://doi.org/10.1109/TCYB.2020.3041212 doi: 10.1109/TCYB.2020.3041212
|
| [45] |
Y. Zhang, G. Wang, K. Li, W. Yeh, M. Jian, J. Dong, Enhancing MOEA/D with information feedback models for large-scale many-objective optimization, Inf. Sci., 522 (2020), 1–16. https://doi.org/10.1016/j.ins.2020.02.066 doi: 10.1016/j.ins.2020.02.066
|
| [46] |
Y. Sun, B. Xue, M. Zhang, G. G. Yen, A new two-stage evolutionary algorithm for many-objective optimization, IEEE Trans. Evol. Comput., 23 (2019), 748–761. https://doi.org/10.1109/TEVC.2018.2882166 doi: 10.1109/TEVC.2018.2882166
|
| [47] |
K. Deb, H. Jain, An evolutionary many-objective optimization algorithm using reference-point-based nondominated sorting approach, part I: Solving problems with box constraints, IEEE Trans. Evol. Comput., 18 (2014), 577–601. https://doi.org/10.1109/TEVC.2013.2281535 doi: 10.1109/TEVC.2013.2281535
|
| [48] |
J. Yi, L. Xing, G. Wang, J. Dong, A. V. Vasilakos, A. H. Alavi, et al., Behavior of crossover operators in NSGA-III for large-scale optimization problems, Inf. Sci., 509 (2020), 470–487. https://doi.org/10.1016/j.ins.2018.10.005 doi: 10.1016/j.ins.2018.10.005
|
| [49] |
I. Das, J. E. Dennis, Normal-boundary intersection: A new method for generating the pareto surface in nonlinear multicriteria optimization problems, SIAM J. Optim., 8 (2006), 631–657. https://doi.org/10.1137/S1052623496307510 doi: 10.1137/S1052623496307510
|
| [50] | K. Deb, R. B. Agrawal, Simulated binary crossover for continuous search space, Complex Syst., 9 (1994), 115–148. |
| [51] | K. Deb, M. Goyal, A combined genetic adaptive search (GeneAS) for engineering design, Comput. Sci. Inf., 26 (1996), 30–45. |
| [52] |
C. Dai, Y. Wang, A new multiobjective evolutionary algorithm based on decomposition of the objective space for multiobjective optimization, J. Appl. Math., 2014 (2014), 1–9. https://doi.org/10.1155/2014/906147 doi: 10.1155/2014/906147
|
| [53] | Y. Yuan, H. Xu, B. Wang, An improved NSGA-III procedure for evolutionary many-objective optimization, in 16th Genetic and Evolutionary Computation Conference, 2014. https://doi.org/10.1145/2576768.2598342 |
| [54] |
Y. Tian, R. Cheng, X. Zhang, Y. Jin, PlatEMO: A matlab platform for evolutionary multi-objective optimization [educational forum], IEEE Comput. Intell. Mag., 12 (2017), 73–87. https://doi.org/10.1109/MCI.2017.2742868 doi: 10.1109/MCI.2017.2742868
|
| [55] | K. Deb, L. Thiele, M. Laumanns, E. Zitzler, Scalable multi-objective optimization test problems, in Proceedings of the 2002 Congress on Evolutionary Computation, 2002. https://doi.org/10.1109/CEC.2002.1007032 |
| [56] |
S. Huband, P. Hingston, L. Barone, L. While, A review of multiobjective test problems and a scalable test problem toolkit, IEEE Trans. Evol. Comput., 10 (2006), 477–506. https://doi.org/10.1109/TEVC.2005.861417 doi: 10.1109/TEVC.2005.861417
|
| [57] |
E. Zitzler, L. Thiele, M. Laumanns, C. M. Fonseca, V. G. D. Fonseca, Performance assessment of multiobjective optimizers: An analysis and review, IEEE Trans. Evol. Comput., 7 (2003), 117–132. https://doi.org/10.1109/TEVC.2003.810758 doi: 10.1109/TEVC.2003.810758
|


Figures(4) / Tables(11)

Junhua Liu, Wei Zhang, Mengnan Tian, Hong Ji, Baobao Liu. A double association-based evolutionary algorithm for many-objective optimization[J]. Mathematical Biosciences and Engineering, 2023, 20(9): 17324-17355. doi: 10.3934/mbe.2023771


 DownLoad: