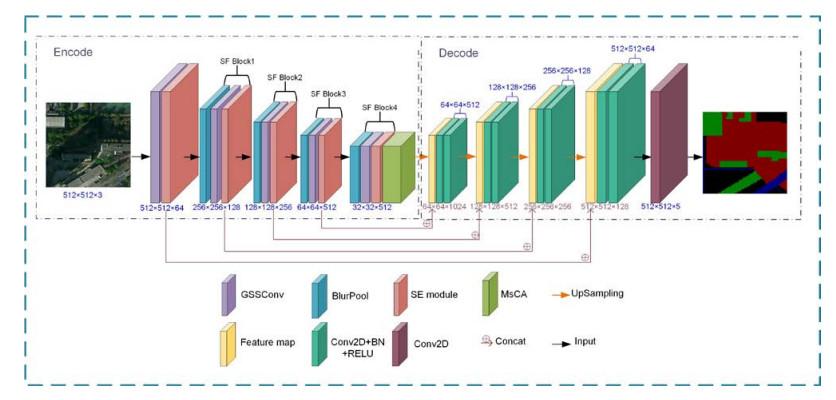
The monitoring of urban land categories is crucial for effective land resource management and urban planning. To address challenges such as uneven parcel distribution, difficulty in feature extraction and loss of image information in urban remote sensing images, this study proposes a multi-scale feature shuffle urban scene segmentation model. The model utilizes a deep convolutional encoder-decoder network with BlurPool instead of MaxPool to compensate for missing translation invariance. GSSConv and SE module are introduced to enhance information interaction and filter redundant information, minimizing category misclassification caused by similar feature distributions. To address unclear boundary information during feature extraction, the model applies multi-scale attention to aggregate context information for better integration of boundary and global information. Experiments conducted on the BDCI2017 public dataset show that the proposed model outperforms several established segmentation networks in OA, mIoU, mRecall, P and Dice with scores of 83.1%, 71.0%, 82.7%, 82.7% and 82.5%, respectively. By effectively improving the completeness and accuracy of urban scene segmentation, this study provides a better understanding of urban development and offers suggestions for future planning.
Citation: Wenjuan Gu, Hongcheng Wang, Xiaobao Liu, Yanchao Yin, Biao Xu. Urban scene segmentation model based on multi-scale shuffle features[J]. Mathematical Biosciences and Engineering, 2023, 20(7): 11763-11784. doi: 10.3934/mbe.2023523
The monitoring of urban land categories is crucial for effective land resource management and urban planning. To address challenges such as uneven parcel distribution, difficulty in feature extraction and loss of image information in urban remote sensing images, this study proposes a multi-scale feature shuffle urban scene segmentation model. The model utilizes a deep convolutional encoder-decoder network with BlurPool instead of MaxPool to compensate for missing translation invariance. GSSConv and SE module are introduced to enhance information interaction and filter redundant information, minimizing category misclassification caused by similar feature distributions. To address unclear boundary information during feature extraction, the model applies multi-scale attention to aggregate context information for better integration of boundary and global information. Experiments conducted on the BDCI2017 public dataset show that the proposed model outperforms several established segmentation networks in OA, mIoU, mRecall, P and Dice with scores of 83.1%, 71.0%, 82.7%, 82.7% and 82.5%, respectively. By effectively improving the completeness and accuracy of urban scene segmentation, this study provides a better understanding of urban development and offers suggestions for future planning.

| [1] |
Z. Z. Fan, S. Wang, H. Zhang, R. L. Shi, W. J. Fu, M. Z. Li, W-Net-Based segmentation for remote sensing satellite image of high resolution, J. South China Uni. Technol. (Natural Science Edition), 48 (2020), 114–124. https://doi.org/10.12141/j.issn.1000-565X.200365 doi: 10.12141/j.issn.1000-565X.200365

|
| [2] |
J. X. Zhang, L. X. Wang, Image segmentation models of remote sensing using full residual connection and multiscale feature fusion, N. Remote Sens Bull., 24 (2020), 1120–1133. https://doi.org/10.11834/jrs.20208365 doi: 10.11834/jrs.20208365
|
| [3] |
M. M. Li, A. Stein, M. K. de Beurs, A bayesian characterization of urban land use configurations from VHR remote sensing images, Int. J. Appl. Earth Obs. Geoinf., 92 (2020), 102175. https://doi.org/10.1016/j.jag.2020.102175 doi: 10.1016/j.jag.2020.102175
|
| [4] |
D. L. Mao, Z. Zheng, F. X. Meng, C. Y. Zhou, J. P. Zhao, H. Z. Yang, et al., Large-scale automatic identification of urban vacant land using semantic segmentation of high-resolution remote sensing images, Landscape Urban Plan, 222 (2022), 104384. https://doi.org/10.1016/j.landurbplan.2022.104384 doi: 10.1016/j.landurbplan.2022.104384
|
| [5] |
D. H. Cheng, H. X. Jiang, Y. Sun, L. J. Wang, Color image segmentation: Advances and prospects, Pattern Recogn., 34 (2001), 2259–2281. https://doi.org/10.1016/S0031-3203(00)00149-7 doi: 10.1016/S0031-3203(00)00149-7
|
| [6] | S. S. Al-amri, V. N. Kalyankar, S. D. Khamitkar, Image segmentation by using threshold techniques, Comput. Vis. Pat. Recog. (CVPR) (cs.CV). arXiv: 1005. 4020 [cs.CV]. https://doi.org/10.48550/arXiv.1005.4020 |
| [7] | F. Meyer, Color image segmentation, Intl. Conf. Im. Prcsg. Appls., Maastricht, Netherlands, 1992. https://ieeexplore.ieee.org/abstract/document/785528/ |
| [8] | K. G. Hassana, J. B. Zou, Region-Based segmentation versus edge detection.5 Intl. Conf. Intell. Info. Hdg & MM Sig. Prcsg., Kyoto, Japan, 2009. https://doi.org/10.1109/IIH-MSP.2009.13 |
| [9] |
M. Abdel-Basset, V. Chang, R. Mohamed, A novel equilibrium optimization algorithm for multi-thresholding image segmentation problems, Neural Comput. Appl., 33 (2021), 10685–10718. https://doi.org/10.1007/s00521-020-04820-y doi: 10.1007/s00521-020-04820-y
|
| [10] |
O. Csillik, Fast segmentation and classification of very high resolution remote sensing data using SLIC superpixels, Remote Sens, 9 (2017), 243. https://doi.org/10.3390/rs9030243 doi: 10.3390/rs9030243
|
| [11] |
X. B. Liu, S. S. Wang, J. C. W. Lin, S. Liu, An algorithm for overlapping chromosome segmentation based on region selection, Neural Comput. Appl., (2022). https://doi.org/10.1007/s00521-022-07317-y doi: 10.1007/s00521-022-07317-y
|
| [12] |
P. M. Cipolletti, A. C. Delrieux, G. M. E. Perillo, M. P. Cintia, Superresolution border segmentation and measurement in remote sensing images, Comput. Geosci., 40 (2012), 87–96. https://doi.org/10.1016/j.cageo.2011.07.015 doi: 10.1016/j.cageo.2011.07.015
|
| [13] |
Q. Nie, Yb. Zou, J. C. W. Lin, Feature Extraction for Medical CT Images of Sports Tear Injury, Mobile Netw Appl, 26 (2021), 404–414. https://doi.org/10.1007/s11036-020-01675-4 doi: 10.1007/s11036-020-01675-4
|
| [14] |
K. Z. Wu, S. Zhao, W. H. Li, R. Y. Jiang, Spatial global context information network for semantic segmentation of remote sensing image, J. Zhejiang Uni. (Engineering Science), 56 (2022). 795–802. https://doi.org/10.3785/j.issn.1008-973X.2022.04.019 doi: 10.3785/j.issn.1008-973X.2022.04.019
|
| [15] | C. T, Tian, X. Y. Zhang, J. C. W. Lin, W. M. Zuo, Y. N. Zhang, C. W. Liu, Generative Adversarial Networks for Image Super-Resolution: A Survey. Img. Vid. Prcsg. (eess.IV); Comput. Vis. Pat. Recog. (CVPR) (cs.CV). arXiv: 2204. 13620 [cs.CV]. https://doi.org/10.48550/arXiv.2204.13620 |
| [16] |
U. Ahmed, J. CW. Lin, G. Srivastava, Ensemble-based deep meta learning for medical image segmentation, J. Intell. Fzy. Syst., 42 (2022), 4307–4313. https://doi.org/10.3233/JIFS-219221 doi: 10.3233/JIFS-219221
|
| [17] | W. Z. Liu, P. Luo, G. X. Wang, O. X. Tang, Deep learning face attributes in the wild, Intl. Conf. Comput. Vis. (ICCV), Santiago, Chile, 2015. https://doi.org/10.1109/ICCV.2015.425 |
| [18] | J. Long, E. Shelhamer, T. Darrell, Fully convolutional networks for semantic segmentation, Comput. Vis. Pat. Recog. (CVPR), Boston, USA, 2015. https://doi.org/10.1109/CVPR.2015.7298965 |
| [19] |
V. Badrinarayanan, A. Kendall, R. CipollaI, SegNet: A deep convolutional encoder-decoder architecture for image segmentation, Trans. Pat. Anal. Mach. Intell., 39 (2017), 2481–2495. https://doi.org/10.1109/TPAMI.2016.2644615 doi: 10.1109/TPAMI.2016.2644615
|
| [20] | S. H. Zhao, J. Shi, J. X. Qi, G. X. Wang, Y. J. Jia, Pyramid scene parsing network, Comput. Vis. Pat. Recog. (CVPR), Honolulu, USA, 2017. https://doi.org/10.1109/CVPR.2017.660 |
| [21] | O. Ronneberger, P. Fischer, T. Brox, U-Net: convolutional networks for biomedical image segmentation, Comput. Vis. Pat. Recog. (CVPR) (cs.CV). arXiv: 1505.04597 [cs.CV]. https://doi.org/10.48550/arXiv.1505.04597 |
| [22] | LC. Chen, G. Papandreou, F. Schroff, H. Adam, Rethinking atrous convolution for semantic image segmentation, Comput. Vis. Pat. Recog. (CVPR) (cs.CV). arXiv: 1706. 05587 [cs.CV]. https://doi.org/10.48550/arXiv.1706.05587 |
| [23] |
B. H. Xie, Z. Y. Pan, H. J. Luan, X. Yang, W. Y. Xi, Open-pit mining area segmentation of remote sensing images based on DUSegNet, J. Indian Soc. Remote, 49 (2021), 1257–1270. https://doi.org/10.1007/s12524-021-01312-x doi: 10.1007/s12524-021-01312-x
|
| [24] |
X. Wang, C. Y. Guo, S. Wang, G. Cheng, Q. X. Wang, L. He, Rapid detection of incomplete coal and gangue based on improved PSPNet, Meas., 201 (2022), 111646. https://doi.org/10.1016/j.measurement.2022.111646 doi: 10.1016/j.measurement.2022.111646
|
| [25] |
B. Z. Su, W. Li, Z. Ma, R. Gao, An improved U-Net method for the semantic segmentation of remote sensing images, Appl Intell, 52 (2022), 3276–3288. https://doi.org/10.1007/s10489-021-02542-9 doi: 10.1007/s10489-021-02542-9
|
| [26] |
S. Liu, R. H. Ye, K. Jin, H. H. Cheng, CT-UNet: Context-Transfer-UNet for building segmentation in remote sensing images, Neural Process Lett, 53 (2021), 4257–4277. https://doi.org/10.1007/s11063-021-10592-w doi: 10.1007/s11063-021-10592-w
|
| [27] | Q. S. Yang, F. P. Wang, S. Wang, S. Y. Tang, F. J. Ning, J. Y. Xi, Detection of wheat lodging in UAV remote sensing image based on multi-head self-attention Deeplab v3+, Trans. Chin. Soc. Agric. Mach., 53 (2022), 213–219. https://doi.org/710.6041/j.issn.1000-1298.2022.08.022 |
| [28] |
A. Belhadi, JO. Holland, A. Yazidi, G. Srivastava, J. CW. Lin, Y Djenouri, BIoMT-ISeg: Blockchain internet of medical th ings for intelligent segmentation, Front. Physiol., 13 (2023). https://doi.org/10.3389/fphys.2022.1097204 doi: 10.3389/fphys.2022.1097204
|
| [29] | Z. Richard, Making Convolutional networks shift-Invariant again, Comput. Vis. Pat. Recog. (CVPR) (cs.CV); Machine Learning (cs.LG). arXiv: 1904. 11486 [cs.CV]. https://doi.org/10.48550/arXiv.1904.11486 |
| [30] |
J. Hu, L. Shen, S. Albanie, G. Sun, H. E. Wu, Squeeze-and-Excitation Networks, Trans. Pat. Anal. Mach. Intell., 42 (2019), 2011–2023. https://doi.org/10.1109/TPAMI.2019.2913372 doi: 10.1109/TPAMI.2019.2913372
|
| [31] |
M. K. He, Y. X. Zhang, Q. S. Ren, J. Sun, Spatial pyramid pooling in deep convolutional networks for visual recognition, Trans. Pat. Anal. Mach. Intell., 37 (2015), 1904–1916. https://doi.org/10.1109/TPAMI.2015.2389824 doi: 10.1109/TPAMI.2015.2389824
|
| [32] | C. L. Chen, Y. Zhu, G. Papandreou, F. Schroff, H. Adadm, Encoder-Decoder with atrous separable convolution for semantic image segmentation, Eur. Conf. Comput. Vis. (ECCV), Munich, Germany, 2018. https://doi.org/10.1007/978-3-030-01234-2_49 |
| [33] | A. Howard, M. Sandler, B. Chen, J. W. Wang, C. L. Chen, X. M. Tan, et al., Searching for MobileNetV3, Intl. Conf. Comput. Vis. (ICCV), Seoul, Korea, 2019. https://doi.org/10.1109/ICCV.2019.00140 |
| [34] |
X. B. Liu, B. Xu, W. J. Gu, Y. C. Yin, H. C. Wang, Plant leaf veins coupling feature representation and measurement method based on DeepLabV3+. Front. Plant Sci., 13 (2022). https://doi.org/10.3389/fpls.2022.1043884 doi: 10.3389/fpls.2022.1043884
|
| [35] | G. Máttyus, S. L. Wang, S. Fidler, U. Raquel, Hd maps: Fine-grained road segmentation by parsing ground and aerial images, Comput. Vis. Pat. Recog. (CVPR), Las Vegas, USA, 2016. https://doi.org/10.1109/CVPR.2016.393 |


Figures(12) / Tables(6)

Wenjuan Gu, Hongcheng Wang, Xiaobao Liu, Yanchao Yin, Biao Xu. Urban scene segmentation model based on multi-scale shuffle features[J]. Mathematical Biosciences and Engineering, 2023, 20(7): 11763-11784. doi: 10.3934/mbe.2023523


 DownLoad: