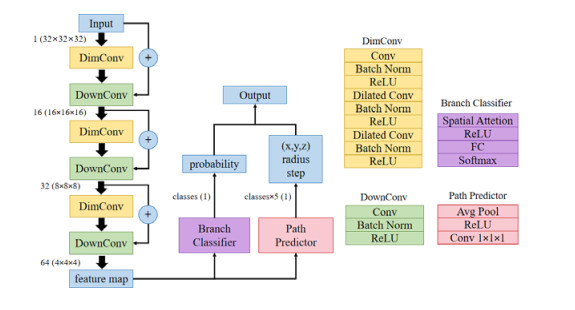
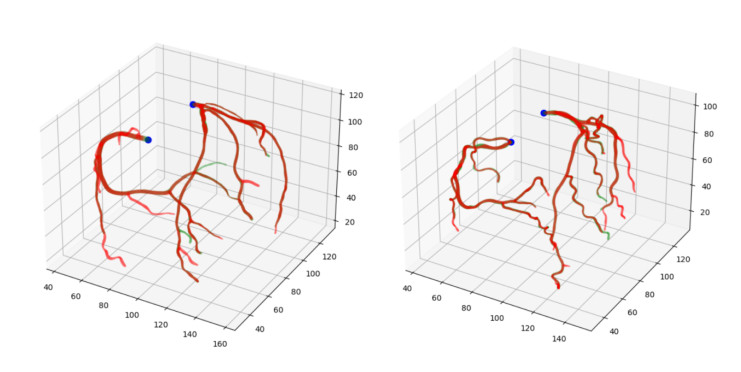
Coronary artery centerline extraction in cardiac computed tomography angiography (CTA) is an effectively non-invasive method to diagnose and evaluate coronary artery disease (CAD). The traditional method of manual centerline extraction is time-consuming and tedious. In this study, we propose a deep learning algorithm that continuously extracts coronary artery centerlines from CTA images using a regression method. In the proposed method, a CNN module is trained to extract the features of CTA images, and then the branch classifier and direction predictor are designed to predict the most possible direction and lumen radius at the given centerline point. Besides, a new loss function is developed for associating the direction vector with the lumen radius. The whole process starts from a point manually placed at the coronary artery ostia, and terminates until tracking the vessel endpoint. The network was trained using a training set consisting of 12 CTA images and the evaluation was performed using a testing set consisting of 6 CTA images. The extracted centerlines had an average overlap (OV) of 89.19%, overlap until first error (OF) of 82.30%, and overlap with clinically relevant vessel (OT) of 91.42% with manually annotated reference. Our proposed method can efficiently deal with multi-branch problems and accurately detect distal coronary arteries, thereby providing potential help in assisting CAD diagnosis.
Citation: Xintong Wu, Yingyi Geng, Xinhong Wang, Jucheng Zhang, Ling Xia. Continuous extraction of coronary artery centerline from cardiac CTA images using a regression-based method[J]. Mathematical Biosciences and Engineering, 2023, 20(3): 4988-5003. doi: 10.3934/mbe.2023231
Coronary artery centerline extraction in cardiac computed tomography angiography (CTA) is an effectively non-invasive method to diagnose and evaluate coronary artery disease (CAD). The traditional method of manual centerline extraction is time-consuming and tedious. In this study, we propose a deep learning algorithm that continuously extracts coronary artery centerlines from CTA images using a regression method. In the proposed method, a CNN module is trained to extract the features of CTA images, and then the branch classifier and direction predictor are designed to predict the most possible direction and lumen radius at the given centerline point. Besides, a new loss function is developed for associating the direction vector with the lumen radius. The whole process starts from a point manually placed at the coronary artery ostia, and terminates until tracking the vessel endpoint. The network was trained using a training set consisting of 12 CTA images and the evaluation was performed using a testing set consisting of 6 CTA images. The extracted centerlines had an average overlap (OV) of 89.19%, overlap until first error (OF) of 82.30%, and overlap with clinically relevant vessel (OT) of 91.42% with manually annotated reference. Our proposed method can efficiently deal with multi-branch problems and accurately detect distal coronary arteries, thereby providing potential help in assisting CAD diagnosis.

| [1] | World Health Organization, The top 10 causes of death, 2020. Available from: https://www.who.int/en/news-room/fact-sheets/detail/the-top-10-causes-of-death. |
| [2] |
F. Cademartiri, L. La Grutta, A. Palumbo, P. Malagutti, F. Pugliese, W. B. Meijboom, et al., Non-invasive visualization of coronary atherosclerosis: state-of-art, J. Cardiovasc. Med., 8 (2007), 129–137. https://doi.org/10.2459/01.JCM.0000260820.40145.a8 doi: 10.2459/01.JCM.0000260820.40145.a8

|
| [3] |
G. Mowatt, E. Cummins, N. Waugh, S. Walker, J. Cook, X. Jia, et al., Systematic review of the clinical effectiveness and cost-effectiveness of 64-slice or higher computed tomography angiography as an alternative to invasive coronary angiography in the investigation of coronary artery disease, Health Technol. Assess., 12 (2008), 3–143. https://doi.org/10.3310/hta12170 doi: 10.3310/hta12170
|
| [4] |
A. W. Leber, A. Becker, A. Knez, F. von Ziegler, M. Sirol, K. Nikolaou, et al., Accuracy of 64-slice computed tomography to classify and quantify plaque volumes in the proximal coronary system—A comparative study using intravascular ultrasound, J. Am. Coll. Cardiol., 47 (2006), 672–677. https://doi.org/10.1016/j.jacc.2005.10.058 doi: 10.1016/j.jacc.2005.10.058
|
| [5] | A. Kanitsar, D. Fleischmann, R. Wegenkittl, P. Felkel, M. E. Grö ller, CPR-curved planar reformation, in IEEE Visualization, 2002. VIS 2002, (2002), 37–44. https://doi.org/10.1109/VISUAL.2002.1183754 |
| [6] |
H. S. Hecht, Applications of multislice coronary computed tomographic angiography to percutaneous coronary intervention: How did we ever do without it, Catheterization Cardiovasc. Interventions, 71 (2008), 490–503. https://doi.org/10.1002/ccd.21427 doi: 10.1002/ccd.21427
|
| [7] |
M. F. Khan, S. Wesarg, J. Gurung, S. Dogan, A. Maataoui, B. Brehmer, et al., Facilitating coronary artery evaluation in MDCT using a 3D automatic vessel segmentation tool, Eur. Radiol., 16 (2006), 1789–1795. https://doi.org/10.1007/s00330-006-0159-8 doi: 10.1007/s00330-006-0159-8
|
| [8] | J. S. Shinbane, S. S. Mao, M. J. Girsky, R. J. Oudiz, S. Carson, J. Child, et al., Computed tomographic angiography can define three-dimensional relationships between coronary veins and coronary arteries relevant to coronary venous procedures, Circulation, 110 (2004), 702. |
| [9] |
Y. Shen, Y. Gao, P. Zhang, W. Yu, S. Zhou, B. Li, et al., Research on CCTA coronary lumen segmentation based on Polar1DMLP model, CT Theory Appl. Res., 29 (2020), 631–642. https://doi.org/10.15953/j.1004-4140.2020.29.06.01 doi: 10.15953/j.1004-4140.2020.29.06.01
|
| [10] | M. Umer, S. Sharma, P. Rattan, A survey of deep learning models for medical image analysis, in 2021 International Conference on Computing Sciences (ICCS), (2021), 65–69. https://doi.org/10.1109/iccs54944.2021.00021 |
| [11] | W. Huang, L. Huang, Z. Lin, S. Huang, Y. Chi, J. Zhou, et al., Coronary artery segmentation by deep learning neural networks on computed tomographic coronary angiographic images, in 2018 40th Annual international conference of the IEEE engineering in medicine and biology society (EMBC), (2018), 608–611. https://doi.org/10.1109/embc.2018.8512328 |
| [12] |
F. Isensee, P. F. Jaeger, S. A. A. Kohl, J. Petersen, K. H. Maier-Hein, nnU-Net: A self-configuring method for deep learning-based biomedical image segmentation, Nat. Methods, 18 (2021), 203–211. https://doi.org/10.1038/s41592-020-01008-z doi: 10.1038/s41592-020-01008-z
|
| [13] |
D. Jia, X. Zhuang, Learning-based algorithms for vessel tracking: A review, Comput. Med. Imaging Graphics, 89 (2021), 101840. https://doi.org/10.1016/j.compmedimag.2020.101840 doi: 10.1016/j.compmedimag.2020.101840
|
| [14] |
A. Dorobanțiu, V. Ogrean, R. Brad, Coronary centerline extraction from CCTA using 3D-UNet, Future Int., 13 (2021), https://doi.org/10.3390/fi13040101 doi: 10.3390/fi13040101
|
| [15] | S. Rjiba, T. Urruty, P. Bourdon, C. Fernandez-Maloigne, R. Delepaule, L. P. Christiaens, et al., CenterlineNet: Automatic coronary artery centerline extraction for computed tomographic angiographic images using convolutional neural network architectures, in 2020 Tenth International Conference on Image Processing Theory, Tools and Applications (IPTA), (2020), 1–6. https://doi.org/10.1109/IPTA50016.2020.9286458 |
| [16] |
J. M. Wolterink, R. W. van Hamersvelt, M. A. Viergever, T. Leiner, I. Išgum, Coronary artery centerline extraction in cardiac CT angiography using a CNN-based orientation classifier, Med. Image Anal., 51 (2019), 46–60. https://doi.org/10.1016/j.media.2018.10.005 doi: 10.1016/j.media.2018.10.005
|
| [17] | A. Mostafa, A. M. Ghanem, M. El-Shatoury, T. Basha, Improved centerline extraction in fully automated coronary ostium localization and centerline extraction framework using deep learning, in 2021 43rd Annual International Conference of the IEEE Engineering in Medicine & Biology Society (EMBC), (2021), 3846–3849. https://doi.org/10.1109/EMBC46164.2021.9629655 |
| [18] | H. Yang, J. Chen, Y. Chi, X. Xie, X. Hua, Discriminative coronary artery tracking via 3D CNN in cardiac CT angiography, in International Conference on Medical Image Computing and Computer-assisted Intervention, 11765 (2019), 468–476. https://doi.org/10.1007/978-3-030-32245-8_52 |
| [19] | R. Girshick, Fast R-CNN, in 2015 IEEE International Conference on Computer Vision, (2015), 1440–1448. https://doi.org/10.1109/iccv.2015.1697 |
| [20] |
C. Zhou, H. P. Chan, A. Chughtai, S. Patel, L. M. Hadjiiski, J. Wei, et al., Automated coronary artery tree extraction in coronary CT angiography using a multiscale enhancement and dynamic balloon tracking (MSCAR-DBT) method, Comput. Med. Imaging Graphics, 36 (2012), 1–10. https://doi.org/10.1016/j.compmedimag.2011.04.001 doi: 10.1016/j.compmedimag.2011.04.001
|
| [21] |
D. Han, H. Shim, B. Jeon, Y. Jang, Y. Hong, S. Jung, et al., Automatic coronary artery segmentation using active search for branches and seemingly disconnected vessel segments from coronary CT angiography, Plos One, 11 (2016), https://doi.org/10.1371/journal.pone.0156837 doi: 10.1371/journal.pone.0156837
|
| [22] |
M. Schaap, C. T. Metz, T. van Walsum, A. G. van der Giessen, A. C. Weustink, N. R. Mollet, et al., Standardized evaluation methodology and reference database for evaluating coronary artery centerline extraction algorithms, Med. Image Anal., 13 (2009), 701–714. https://doi.org/10.1016/j.media.2009.06.003 doi: 10.1016/j.media.2009.06.003
|
| [23] |
W. G. Austen, J. E. Edwards, R. L. Frye, G. G. Gensini, V. L. Gott, L. S. Griffith, et al., A reporting system on patients evaluated for coronary artery disease, Report of the Ad Hoc Committee for Grading of Coronary Artery Disease, Council on Cardiovascular Surgery, American Heart Association, Circulation, 51 (1975), 5–40. https://doi.org/10.1161/01.cir.51.4.5 doi: 10.1161/01.cir.51.4.5
|
| [24] |
Y. Geng, H. Liu, X. Wang, J. Zhang, Y. Gong, D. Zheng, et al., Effect of microcirculatory dysfunction on coronary hemodynamics: A pilot study based on computational fluid dynamics simulation, Comput. Biol. Med., 146 (2022), 105583. https://doi.org/10.1016/j.compbiomed.2022.105583 doi: 10.1016/j.compbiomed.2022.105583
|
| [25] | R. Gao, Z. Hou, J. Li, H. Han, B. Lu, S. K. Zhou, Joint coronary centerline extraction and lumen segmentation from Ccta using Cnntracker and vascular graph convolutional network, in 2021 IEEE 18th International Symposium on Biomedical Imaging, (2021), 1897–1901. https://doi.org/10.1109/isbi48211.2021.9433764 |
| [26] |
B. Jeon, Deep recursive bayesian tracking for fully automatic centerline extraction of coronary arteries in CT images, Sensors, 21 (2021), 6087. https://doi.org/10.3390/s21186087 doi: 10.3390/s21186087
|
| [27] |
P. A. L. Tonino, B. De Bruyne, N. H. J. Pijls, U. Siebert, F. Ikeno, M. vant Veer, et al., Fractional flow reserve versus angiography for guiding percutaneous coronary intervention, N. Engl. J. Med., 360 (2009), 213–224. https://doi.org/10.1056/NEJMoa0807611 doi: 10.1056/NEJMoa0807611
|
| [28] |
N. H. J. Pijls, B. de Bruyne, K. Peels, P. H. van der Voort, H. J. R. M. Bonnier, J. Bartunek, et al., Measurement of fractional flow reserve to assess the functional severity of coronary-artery stenoses, N. Engl. J. Med., 334 (1996), 1703–1708. https://doi.org/10.1056/nejm199606273342604 doi: 10.1056/nejm199606273342604
|
| [29] |
J. Knuuti, W. Wijns, A. Saraste, D. Capodanno, E. Barbato, C. Funck-Brentano, et al., 2019 ESC guidelines for the diagnosis and management of chronic coronary syndromes the task force for the diagnosis and management of chronic coronary syndromes of the European Society of Cardiology (ESC), Eur. Heart J., 41 (2020), 407–477. https://doi.org/10.1093/eurheartj/ehz425 doi: 10.1093/eurheartj/ehz425
|
| [30] | L. Yu, S. Wang, X. Li, C. W. Fu, P. A. Heng, Uncertainty-aware self-ensembling model for semi-supervised 3D left atrium segmentation, in International Conference on Medical Image Computing and Computer-assisted Intervention, (2019), 605–613. https://doi.org/10.1007/978-3-030-32245-8_67 |
| [31] | D. Nie, Y. Gao, L. Wang, D. Shen, ASDNet: Attention based semi-supervised deep networks for medical image segmentation, in International Conference on Medical Image Computing and Computer-assisted Intervention, (2018), 370–378. https://doi.org/10.1007/978-3-030-00937-3_43 |
| [32] |
A. Madani, J. R. Ong, A. Tibrewal, M. R. K. Mofrad, Deep echocardiography: data-efficient supervised and semi-supervised deep learning towards automated diagnosis of cardiac disease, NPJ Digital Med., 1 (2018), 59. https://doi.org/10.1038/s41746-018-0065-x doi: 10.1038/s41746-018-0065-x
|
| [33] |
V. Cheplygina, M. de Bruijne, J. P. W. Pluim, Not-so-supervised: A survey of semi-supervised, multi-instance, and transfer learning in medical image analysis, Med. Image Anal., 54 (2019), 280–296. https://doi.org/10.1016/j.media.2019.03.009 doi: 10.1016/j.media.2019.03.009
|
Figures(6) / Tables(4)

Xintong Wu, Yingyi Geng, Xinhong Wang, Jucheng Zhang, Ling Xia. Continuous extraction of coronary artery centerline from cardiac CTA images using a regression-based method[J]. Mathematical Biosciences and Engineering, 2023, 20(3): 4988-5003. doi: 10.3934/mbe.2023231


 DownLoad: