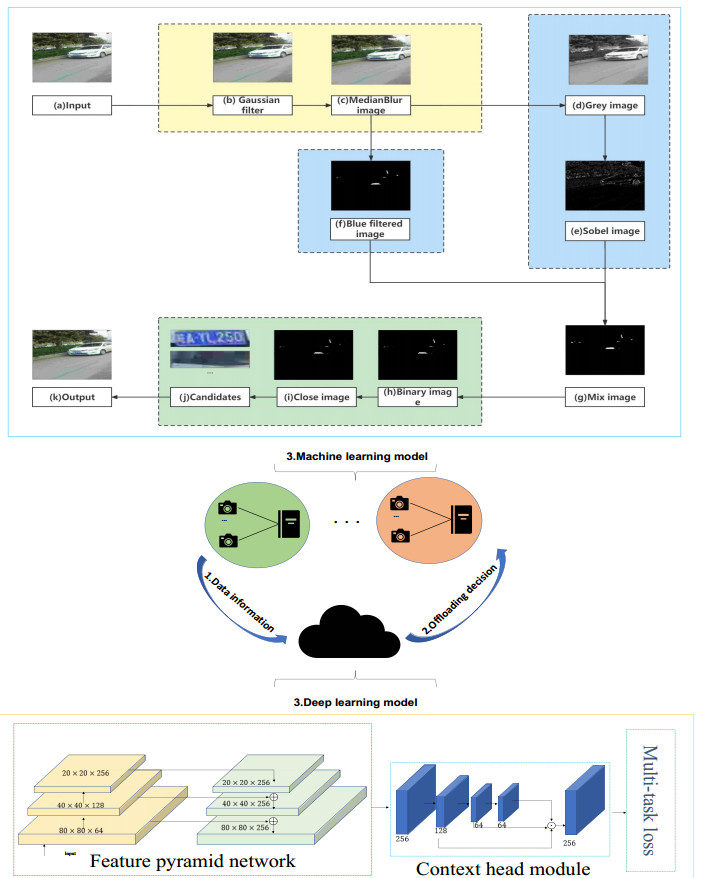
With the explosive growth of edge computing, huge amounts of data are being generated in billions of edge devices. It is really difficult to balance detection efficiency and detection accuracy at the same time for object detection on multiple edge devices. However, there are few studies to investigate and improve the collaboration between cloud computing and edge computing considering realistic challenges, such as limited computation capacities, network congestion and long latency. To tackle these challenges, we propose a new multi-model license plate detection hybrid methodology with the tradeoff between efficiency and accuracy to process the tasks of license plate detection at the edge nodes and the cloud server. We also design a new probability-based offloading initialization algorithm that not only obtains reasonable initial solutions but also facilitates the accuracy of license plate detection. In addition, we introduce an adaptive offloading framework by gravitational genetic searching algorithm (GGSA), which can comprehensively consider influential factors such as license plate detection time, queuing time, energy consumption, image quality, and accuracy. GGSA is helpful for Quality-of-Service (QoS) enhancement. Extensive experiments show that our proposed GGSA offloading framework exhibits good performance in collaborative edge and cloud computing of license plate detection compared with other methods. It demonstrate that when compared with traditional all tasks are executed on the cloud server (AC), the offloading effect of GGSA can be improved by 50.31%. Besides, the offloading framework has strong portability when making real-time offloading decisions.
Citation: Hong Zhang, Penghai Wang, Shouhua Zhang, Zihan Wu. An adaptive offloading framework for license plate detection in collaborative edge and cloud computing[J]. Mathematical Biosciences and Engineering, 2023, 20(2): 2793-2814. doi: 10.3934/mbe.2023131
With the explosive growth of edge computing, huge amounts of data are being generated in billions of edge devices. It is really difficult to balance detection efficiency and detection accuracy at the same time for object detection on multiple edge devices. However, there are few studies to investigate and improve the collaboration between cloud computing and edge computing considering realistic challenges, such as limited computation capacities, network congestion and long latency. To tackle these challenges, we propose a new multi-model license plate detection hybrid methodology with the tradeoff between efficiency and accuracy to process the tasks of license plate detection at the edge nodes and the cloud server. We also design a new probability-based offloading initialization algorithm that not only obtains reasonable initial solutions but also facilitates the accuracy of license plate detection. In addition, we introduce an adaptive offloading framework by gravitational genetic searching algorithm (GGSA), which can comprehensively consider influential factors such as license plate detection time, queuing time, energy consumption, image quality, and accuracy. GGSA is helpful for Quality-of-Service (QoS) enhancement. Extensive experiments show that our proposed GGSA offloading framework exhibits good performance in collaborative edge and cloud computing of license plate detection compared with other methods. It demonstrate that when compared with traditional all tasks are executed on the cloud server (AC), the offloading effect of GGSA can be improved by 50.31%. Besides, the offloading framework has strong portability when making real-time offloading decisions.

| [1] | I. Goodfellow, Y. Bengio, A. Courville, Deep learning, MIT press, Cambridge, 2016. |
| [2] | H. Xue, B. Huang, M. Qin, H. Zhou, H. Yang, Edge computing for internet of things: A survey, in 2020 International Conferences on Internet of Things (iThings) and IEEE Green Computing and Communications (GreenCom) and IEEE Cyber, Physical and Social Computing (CPSCom) and IEEE Smart Data (SmartData) and IEEE Congress on Cybermatics (Cybermatics), 2020,755–760. https://doi.org/10.1109/iThings-GreenCom-CPSCom-SmartData-Cybermatics50389.2020.00130 |
| [3] |
J. Shashirangana, H. Padmasiri, D. Meedeniya, C. Perera, Automated license plate recognition: a survey on methods and techniques, IEEE Access, 9 (2020), 11203–11225. https://doi.org/10.1109/ACCESS.2020.3047929 doi: 10.1109/ACCESS.2020.3047929

|
| [4] |
H. Padmasiri, J. Shashirangana, D. Meedeniya, O. Rana, C. Perera, Automated license plate recognition for resource-constrained environments, Sensors, 22 (2022), 1434. https://doi.org/10.3390/s22041434 doi: 10.3390/s22041434
|
| [5] |
M. Diamanti, P. Charatsaris, E. E. Tsiropoulou, S. Papavassiliou, Incentive mechanism and resource allocation for edge-fog networks driven by multi-dimensional contract and game theories, IEEE Open J. Commun. Soc., 3 (2022), 435–452. https://doi.org/10.1109/OJCOMS.2022.3154536 doi: 10.1109/OJCOMS.2022.3154536
|
| [6] |
X. Chen, H. Xu, G. Zhang, Y. Chen, R. Li, Unsupervised deep learning for binary offloading in mobile edge computation network, Wirel. Pers. Commun., 124 (2022), 1841–1860. https://doi.org/10.1007/s11277-021-09433-9 doi: 10.1007/s11277-021-09433-9
|
| [7] |
R. Chen, X. Wang, Maximization of value of service for mobile collaborative computing through situation aware task offloading, IEEE. Trans. Mob. Comput., 99 (2021), 1–1. https://doi.org/10.1109/TMC.2021.3086687 doi: 10.1109/TMC.2021.3086687
|
| [8] |
Y. Fu, X. Yang, P. Yang, A. K. Y. Wong, Z. Shi, H. Wang, et al., Energy-efficient offloading and resource allocation for mobile edge computing enabled mission-critical internet-of-things systems, EURASIP J. Wirel. Commun. Networking, 26 (2021), 1–16. https://doi.org/10.1186/s13638-021-01905-7 doi: 10.1186/s13638-021-01905-7
|
| [9] |
X. Li, L. Huang, H. Wang, S. Bi, Y. A. Zhang, An integrated optimization-learning framework for online combinatorial computation offloading in mec networks, IEEE Wirel. Commun., 29 (2022), 170–177. https://doi.org/10.1109/MWC.201.2100155 doi: 10.1109/MWC.201.2100155
|
| [10] |
C. Jiang, Y. Li, J. Su, Q. Chen, Research on new edge computing network architecture and task offloading strategy for internet of things, Wirel. Networks, (2021), 1–13. https://doi.org/10.1007/s11276-020-02516-8 doi: 10.1007/s11276-020-02516-8
|
| [11] |
Y. Mao, C. You, J. Zhang, K. Huang, K. B. Letaief, A survey on mobile edge computing: The communication perspective, IEEE Commun. Surv. Tutor., 19 (2017), 2322–2358. https://doi.org/10.1109/COMST.2017.2745201 doi: 10.1109/COMST.2017.2745201
|
| [12] |
D. Xu, H. Zhu, Legitimate surveillance of suspicious computation offloading in mobile edge computing networks, IEEE Trans. Commun., 70 (2022), 2648–2662. https://doi.org/10.1109/TCOMM.2022.3151767 doi: 10.1109/TCOMM.2022.3151767
|
| [13] |
V. D. Tuong, T. P. Truong, T. Nguyen, W. Noh, S. Cho, Partial computation offloading in noma-assisted mobile-edge computing systems using deep reinforcement learning, IEEE Internet Things J., 8 (2021), 13196–13208. https://doi.org/10.1109/JIOT.2021.3064995 doi: 10.1109/JIOT.2021.3064995
|
| [14] |
X. Deng, J. Yin, P. Guan, N. N. Xiong, L. Zhang, S. Mumtaz, Intelligent delay-aware partial computing task offloading for multi-user industrial internet of things through edge computing, IEEE Internet Things J., (2021), 1–1. https://doi.org/10.1109/JIOT.2021.3123406 doi: 10.1109/JIOT.2021.3123406
|
| [15] |
J. Baek, G. Kaddoum, Online partial offloading and task scheduling in sdn-fog networks with deep recurrent reinforcement learning, IEEE Internet Things J., 9 (2022), 11578–11589. https://doi.org/10.1109/JIOT.2021.3130474 doi: 10.1109/JIOT.2021.3130474
|
| [16] |
A. Yousafzai, A. Gani, R. M. Noor, A. Naveed, R. W. Ahmad, V. Chang, Computational offloading mechanism for native and android runtime based mobile applications, J. Syst. Softw., 121 (2016), 28–39. https://doi.org/10.1016/j.jss.2016.07.043 doi: 10.1016/j.jss.2016.07.043
|
| [17] |
H. Wu, Z. Zhang, C. Guan, K. Wolter, M. Xu Collaborate edge and cloud computing with distributed deep learning for smart city internet of things, IEEE Internet Things J., 7 (2020), 8099–8110. https://doi.org/10.1109/JIOT.2020.2996784 doi: 10.1109/JIOT.2020.2996784
|
| [18] |
F. Saeik, M. Avgeris, D. Spatharakis, N. Santi, D. Dechouniotis, J. Violos, et al., Task offloading in edge and cloud computing: A survey on mathematical, artificial intelligence and control theory solutions, IEEE Internet Things J., 195 (2021), 108177. https://doi.org/10.1016/j.comnet.2021.108177 doi: 10.1016/j.comnet.2021.108177
|
| [19] |
F. Wang, M. Zhang, X. Wang, X. Ma, J. Liu, Deep learning for edge computing applications: A state-of-the-art survey, IEEE Access, 8 (2020), 58322–58336. https://doi.org/10.1109/ACCESS.2020.2982411 doi: 10.1109/ACCESS.2020.2982411
|
| [20] |
L. Huang, X. Feng, A. Feng, Y. Huang, L. P. Qian, Distributed deep learning-based offloading for mobile edge computing networks, Mobile Networks Appl., 27 (2022), 1123–1130. https://doi.org/10.1007/s11036-018-1177-x doi: 10.1007/s11036-018-1177-x
|
| [21] |
L. Huang, S. Bi, Y. A. Zhang, Deep reinforcement learning for online computation offloading in wireless powered mobile-edge computing networks, IEEE. Trans. Mob. Comput., 19 (2019), 2581–2593. https://doi.org/10.1109/TMC.2019.2928811 doi: 10.1109/TMC.2019.2928811
|
| [22] |
A. Shakarami, A. Shahidinejad, M. Ghobaei-Arani, An autonomous computation offloading strategy in mobile edge computing: A deep learning-based hybrid approach, J. Network Comput. Appl., 178 (2021), 102974. https://doi.org/10.1016/j.jnca.2021.102974 doi: 10.1016/j.jnca.2021.102974
|
| [23] |
B. Mao, F. Tang, Y. Kawamoto, N. Kato, Optimizing computation offloading in satellite-uav-served 6G IoT: A deep learning approach, IEEE Network, 35 (2021), 102–108. https://doi.org/10.1109/MNET.011.2100097 doi: 10.1109/MNET.011.2100097
|
| [24] |
L. Kuang, T. Gong, S. OuYang, H. Gao, S. Deng, Offloading decision methods for multiple users with structured tasks in edge computing for smart cities, Future Gener. Comput. Syst., 105 (2020), 717–729. https://doi.org/10.1016/j.future.2019.12.039 doi: 10.1016/j.future.2019.12.039
|
| [25] |
Z. Liao, J. Peng, B. Xiong, J. Huang, Adaptive offloading in mobile-edge computing for ultradense cellular networks based on genetic algorithm, J. Cloud Comput., 10 (2021), 1–16. https://doi.org/10.1186/s13677-021-00232-y doi: 10.1186/s13677-021-00232-y
|
| [26] |
G. Peng, H. Wu, H. Wu, K. Wolter, Constrained multiobjective optimization for iot-enabled computation offloading in collaborative edge and cloud computing, IEEE Internet Things J., 8 (2021), 13723–13736. https://doi.org/10.1109/JIOT.2021.3067732 doi: 10.1109/JIOT.2021.3067732
|
| [27] |
X. Xu, Q. Liu, Y. Luo, K. Peng, X. Zhang, S. Meng, et al., A computation offloading method over big data for iot-enabled cloud-edge computing, Future Gener. Comput. Syst., 95 (2019), 522–533. https://doi.org/10.1016/j.future.2018.12.055 doi: 10.1016/j.future.2018.12.055
|
| [28] |
J. Bi, H. Yuan, S. Duanmu, M. Zhou, A. Abusorrah, Energy-optimized partial computation offloading in mobile-edge computing with genetic simulated-annealing-based particle swarm optimization, IEEE Internet Things J., 8 (2020), 3774–3785. https://doi.org/10.1109/JIOT.2020.3024223 doi: 10.1109/JIOT.2020.3024223
|
| [29] |
T. Alfakih, M. M. Hassan, M. Al-Razgan, Multi-objective accelerated particle swarm optimization with dynamic programing technique for resource allocation in mobile edge computing, IEEE Access, 9 (2021), 167503–167520. https://doi.org/10.1109/ACCESS.2021.3134941 doi: 10.1109/ACCESS.2021.3134941
|
| [30] |
M. O. Lawal, Tomato detection based on modified YOLOv3 framework, Sci. Rep., 11 (2021), 1–11. https://doi.org/10.1038/s41598-021-81216-5 doi: 10.1038/s41598-021-81216-5
|
| [31] |
A. M. Roy, J. Bhaduri, Real-time growth stage detection model for high degree of occultation using densenet-fused YOLOv4, Comput. Electron. Agric., 193 (2022), 106694. https://doi.org/10.1016/j.compag.2022.106694 doi: 10.1016/j.compag.2022.106694
|
| [32] |
A. M. Roy, R. Bose, J. Bhaduri, A fast accurate fine-grain object detection model based on yolov4 deep neural network, Neural Comput. Appl., 34 (2022), 3895–3921. https://doi.org/10.1007/s00521-021-06651-x doi: 10.1007/s00521-021-06651-x
|
| [33] |
Y. Yuan, W. Zou, Y. Zhao, X. Wang, X. Hu, N. Komodakis, A robust and efficient approach to license plate detection, IEEE Trans. Image Process., 26 (2016), 1102–1114. https://doi.org/10.1109/TIP.2016.2631901 doi: 10.1109/TIP.2016.2631901
|
| [34] |
M. R. Asif, Q. Chun, S. Hussain, M. S. Fareed, S. Khan, Multinational vehicle license plate detection in complex backgrounds, J. Vis. Commun. Image Represent., 46 (2017), 176–186. https://doi.org/10.1016/j.jvcir.2017.03.020 doi: 10.1016/j.jvcir.2017.03.020
|
| [35] |
U. Yousaf, A. Khan, H. Ali, F. G. Khan, Z. U. Rehman, S. Shah, et al., A deep learning based approach for localization and recognition of pakistani vehicle license plates, Sensors, 21 (2021), 76696. https://doi.org/10.3390/s21227696 doi: 10.3390/s21227696
|
| [36] |
Y. Yang, Y. Gong, Y. Wu, Intelligent reflecting surface aided mobile edge computing with binary offloading: Energy minimization for IoT devices, IEEE Internet Things J., 9 (2022), 12973–12983. https://doi.org/10.1109/JIOT.2022.3173027 doi: 10.1109/JIOT.2022.3173027
|
| [37] |
C. You, Y. Zeng, R. Zhang, K. Huang, Asynchronous mobile-edge computation offloading: Energy-efficient resource management, IEEE Trans. Wirel. Commun., 17 (2018), 7590–7605. https://doi.org/10.1109/TWC.2018.2868710 doi: 10.1109/TWC.2018.2868710
|
| [38] |
G. Zhang, F. Shen, Z. Liu, Y. Yang, K. Wang, M. Zhou, Femto: Fair and energy-minimized task offloading for fog-enabled iot networks, IEEE Internet Things J., 6 (2018), 4388–4400. https://doi.org/10.1109/JIOT.2018.2887229 doi: 10.1109/JIOT.2018.2887229
|
| [39] |
Y. Chen, N. Zhang, Y. Zhang, X. Chen, W. Wu, X. Shen, Energy efficient dynamic offloading in mobile edge computing for internet of things, IEEE Trans. Cloud Comput., 9 (2019), 1050–1060. https://doi.org/10.1109/TCC.2019.2898657 doi: 10.1109/TCC.2019.2898657
|
| [40] |
Y. Deng, Z. Chen, X. Yao, S. Hassan, A. M. Ibrahim, Parallel offloading in green and sustainable mobile edge computing for delay-constrained IoT system, IEEE Trans. Veh. Technol., 68 (2019), 12202–12214. https://doi.org/10.1109/TVT.2019.2944926 doi: 10.1109/TVT.2019.2944926
|
| [41] | J. Deng, J. Guo, E. Ververas, I. Kotsia, S. Zafeiriou, Retinaface: Single-shot multi-level face localisation in the wild, in Proceedings of the IEEE/CVF Conference on Computer Vision and Pattern Recognition (CVPR), (2020), 5203–5012. https://doi.org/10.1109/CVPR42600.2020.00525 |
| [42] |
Y. Wu, A survey on population-based meta-heuristic algorithms for motion planning of aircraft, Swarm Evol. Comput., 62 (2021), 100844. https://doi.org/10.1016/j.swevo.2021.100844 doi: 10.1016/j.swevo.2021.100844
|
| [43] |
T. X. Tran, D. Pompili, Joint task offloading and resource allocation for multi-server mobile-edge computing networks, IEEE Trans. Veh. Technol., 68 (2018), 856–868. https://doi.org/10.1109/TVT.2018.2881191 doi: 10.1109/TVT.2018.2881191
|
| [44] | X. Chu, D. Lopez-Perez, Y. Yang, F. Gunnarsson, Heterogeneous cellular networks: Theory, simulation and deployment, Cambridge University Press, Cambridge, 2013. |
| [45] | Z. Xu, W. Yang, A. Meng, N. Lu, H. Huang, C. Ying, et al. Towards end-to-end license plate detection and recognition: A large dataset and baseline, in European Conference on Computer Vision, (2018), 255–271. https://doi.org/10.1007/978-3-030-01261-8_16 |
| [46] |
N. Leite, F. Mel´ıcio, A. C. Rosa, A fast simulated annealing algorithm for the examination timetabling problem, Expert Syst. Appl., 122 (2019), 137–151. https://doi.org/10.1016/j.eswa.2018.12.048 doi: 10.1016/j.eswa.2018.12.048
|
| [47] |
S. Katoch, S. S. Chauhan, V. Kumar, A review on genetic algorithm: Past, present, and future, Multimed. Tools Appl., 80 (2021), 8091–8126. https://doi.org/10.1007/s11042-020-10139-6 doi: 10.1007/s11042-020-10139-6
|
| [48] |
E. H. Houssein, A. G. Gad, K. Hussain, P. N. Suganthan, Major advances in particle swarm optimization: theory, analysis, and application, Swarm Evol. Comput., 63 (2021), 100868. https://doi.org/10.1016/j.swevo.2021.100868 doi: 10.1016/j.swevo.2021.100868
|


Figures(10) / Tables(5)

Hong Zhang, Penghai Wang, Shouhua Zhang, Zihan Wu. An adaptive offloading framework for license plate detection in collaborative edge and cloud computing[J]. Mathematical Biosciences and Engineering, 2023, 20(2): 2793-2814. doi: 10.3934/mbe.2023131


 DownLoad: