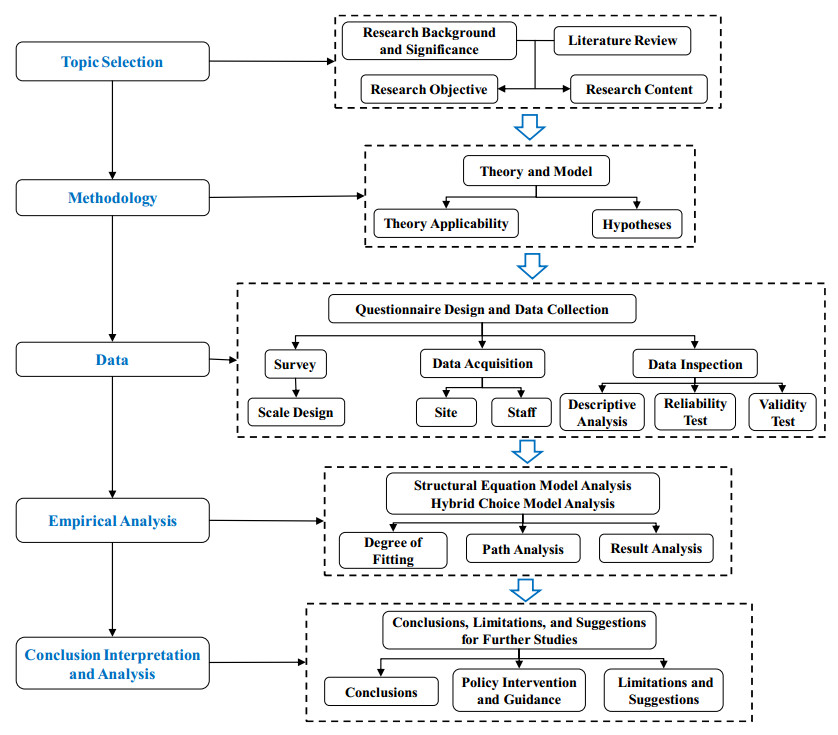
Based on the theory of planned behavior (TPB) and the protection motivation theory (PMT), this study examines the factors that influence parental choice of school travel mode during COVID-19. Structural equation modeling (SEM) and a hybrid choice model (HCM) are used to analyze this decision-making process. The results show that trust, perceived severity, perceived vulnerability, perceived built environment, attitude, subjective norm, and perceived behavioral control are significant factors. Perceived severity, perceived vulnerability, and the evaluation of pandemic risk, significantly impact the choice of public transit and private car, but not walking. Perceived built environment is the most critical factor influencing the choice of walking. The results provide a theoretical basis and reference for relevant government departments to formulate policies and measures during COVID-19.
Citation: Shuang Zhang, Peng Jing, Daibiao Yuan, Chenlu Yang. On parents' choice of the school travel mode during the COVID-19 pandemic[J]. Mathematical Biosciences and Engineering, 2022, 19(9): 9412-9436. doi: 10.3934/mbe.2022438
Based on the theory of planned behavior (TPB) and the protection motivation theory (PMT), this study examines the factors that influence parental choice of school travel mode during COVID-19. Structural equation modeling (SEM) and a hybrid choice model (HCM) are used to analyze this decision-making process. The results show that trust, perceived severity, perceived vulnerability, perceived built environment, attitude, subjective norm, and perceived behavioral control are significant factors. Perceived severity, perceived vulnerability, and the evaluation of pandemic risk, significantly impact the choice of public transit and private car, but not walking. Perceived built environment is the most critical factor influencing the choice of walking. The results provide a theoretical basis and reference for relevant government departments to formulate policies and measures during COVID-19.

| [1] |
P. Chen, J. F. Jiao, M. Y. Xu, X. Gao, C. Bischak, Promoting active student travel: A longitudinal study. J. Transp. Geogr., 70 (2018), 265–274. https://doi.org/10.1016/j.jtrangeo.2018.06.015 doi: 10.1016/j.jtrangeo.2018.06.015

|
| [2] |
E. Temkin, Extremely low prevalence of asymptomatic COVID-19 among healthcare workers caring for COVID-19 patients in Israeli hospitals: A cross-sectional study, Clin. Microbiol. Infect., 27 (2021), 1–4. https://doi.org/10.1016/j.cmi.2020.09.040 doi: 10.1016/j.cmi.2020.09.040
|
| [3] |
M. Wirth, L. Rauchenbach, B. Hurwitz, H. P. Schmiedebach, J. A. Herdt, The meaning of care and ethics to mitigate the harshness of triage in second-wave scenario planning during the COVID-19 pandemic, Am. J. Bioeth., 20 (2020), 17–19. https://doi.org/10.1080/15265161.2020.1777355 doi: 10.1080/15265161.2020.1777355
|
| [4] | A. Hubner, How did we get here? A framing and source analysis of early COVID-19 media coverage, Commun. Res. Rep., 38 (2021), 32–41. |
| [5] |
R. Barff, D. Mcackay, R. W. Olshavsky, A selective review of travel-mode choice models, J. Consumer Res., 8 (1982), 370–380. https://doi.org/10.1086/208877 doi: 10.1086/208877
|
| [6] |
P. V. Berg, E. O. D. Waygood, I. D. Craats, A. Kemperman, Factors affecting parental safety perception, satisfaction with school travel and mood in primary school children in the Netherlands, J. Transp. Health, 16 (2020), 137–149. https://doi.org/10.1016/j.jth.2020.100837 doi: 10.1016/j.jth.2020.100837
|
| [7] |
J. S. Mindell, E. Christina, D. Hopkins, S. Mandic, Taking the bus? Barriers and facilitators for adolescent use of public buses to school, Travel Behav. Soc., 22 (2021), 48–58. https://doi.org/10.1016/j.tbs.2020.08.006 doi: 10.1016/j.tbs.2020.08.006
|
| [8] |
S. Khaddar, M. R. Fatmi, COVID-19: Are you satisfied with traveling during the pandemic? Transp. Res. Interdiscipl. Perspect., 9 (2021), 10–29. https://doi.org/10.1016/j.trip.2020.100292 doi: 10.1016/j.trip.2020.100292
|
| [9] |
A. S. Bergantino, M. Intini, L. Tangari, Influencing factors for potential bike-sharing users: An empirical analysis during the COVID-19 pandemic, Res.Transp. Econom., 81 (2021), 128–144. https://doi.org/10.1016/j.retrec.2020.101028 doi: 10.1016/j.retrec.2020.101028
|
| [10] |
F. Mikki, P. Papadopoulou, Tackling mobility environmental impacts through the promotion of student active travel, Transp. Res. Proced., 24 (2017), 321–328. https://doi.org/10.1016/j.trpro.2017.05.104 doi: 10.1016/j.trpro.2017.05.104
|
| [11] |
M. J. Beck, D. A. Hensher, E. Wei, Slowly coming out of COVID-19 restrictions in Australia: Implications for working from home and commuting trips by car and public transit, J. Transp. Geography, 88 (2020), 186–201. https://doi.org/10.1016/j.jtrangeo.2020.102846 doi: 10.1016/j.jtrangeo.2020.102846
|
| [12] |
M. Scorrano, R. Danielis, Active mobility in an Italian city: Mode choice determinants and attitudes before and during the COVID-19 emergency, Res. Transp. Econom., 83 (2021), 31–55. https://doi.org/10.1016/j.retrec.2021.101031 doi: 10.1016/j.retrec.2021.101031
|
| [13] |
M. Vitale, H. Mollward, J. Spinney, School siting and mode choices for school travel: Rural–urban contrasts in Halifax, Nova Scotia, Canada, Case Studies Transp. Policy, 7 (2019), 64–72. https://doi.org/10.1016/j.cstp.2018.11.008 doi: 10.1016/j.cstp.2018.11.008
|
| [14] |
L. Law, N. Fong, Applying partial least squares structural equation modeling (PLS-SEM) in an investigation of undergraduate students' learning transfer of academic English, J. English Acad. Purp., 46 (2020), 84–103. https://doi.org/10.1016/j.jeap.2020.100884 doi: 10.1016/j.jeap.2020.100884
|
| [15] | J. H. Jiang, Research on taxi service mode choice behavior based on theory of planned behavior, PhD diss., Harbin Institute of Technology, 2017. |
| [16] |
E. Ikeda, S. Mavoa, A. Cavadino, P. Carroll, E. Hinckson, K. Witten, et al., Keeping kids safe for active travel to school: A mixed method examination of school policies and practices and children's school travel behaviour, Travel Behav. Soc., 21 (2020), 57–68. https://doi.org/10.1016/j.tbs.2020.05.008 doi: 10.1016/j.tbs.2020.05.008
|
| [17] |
A. Medeiros, A. Buttazzoni, S. E. Coen, A. F. Clark, K. Wilson, J. Gilliland, Review of gender, socioeconomic status, and ethnic background considerations reported in active school travel intervention studies, J. Transp. Health, 21 (2021), 35–49. https://doi.org/10.1016/j.jth.2021.101035 doi: 10.1016/j.jth.2021.101035
|
| [18] |
M. Keall, D. Hopkins, K.Coppell, S. Sandretto, G. B. Enrique, J. Spence, et al., Implications of attending the closest school on adolescents' physical activity and car travel in Dunedin, New Zealand, J. Transp. Health, 18 (2020), 19–35. https://doi.org/10.1016/j.jth.2020.100900 doi: 10.1016/j.jth.2020.100900
|
| [19] |
N. O. Rosen, K. Bärbel, A little uncertainty goes a long way: State and trait differences in uncertainty interact to increase information seeking but also increase worry, Health Commun., 24 (2009), 228–238. https://doi.org/10.1080/10410230902804125 doi: 10.1080/10410230902804125
|
| [20] |
M. Chao, D. Xue, T. Liu, H. Yang, B. J. Hall, Media use and acute psychological outcomes during COVID-19 outbreak in China, J. Anxiety Disord., 74 (2020), 214–223. https://doi.org/10.1016/j.janxdis.2020.102248 doi: 10.1016/j.janxdis.2020.102248
|
| [21] |
W. Zhou, A. Wang, F. Xia, Y. Xiao, S. Tang, Effects of media reporting on mitigating spread of COVID-19 in the early phase of the outbreak, Math. Biosci. Eng., 17 (2020), 2693–2707. https://doi.org/10.3934/mbe.2020147 doi: 10.3934/mbe.2020147
|
| [22] |
A. Keselman, L. Slaughter, V. L. Pater, Toward a framework for understanding lay public's comprehension of disaster and bioterrorism information, J. Biomed. Inform., 38 (2005), 331–344. https://doi.org/10.1016/j.jbi.2005.05.001 doi: 10.1016/j.jbi.2005.05.001
|
| [23] |
N. Mheidly, J. Fares, Leveraging media and health communication strategies to overcome the COVID-19 infodemic, J. Public Health Policy, 41 (2020), 410–420. https://doi.org/10.1057/s41271-020-00247-w doi: 10.1057/s41271-020-00247-w
|
| [24] |
F. B. Pereira, F. Nunes, Media choice and the polarization of public opinion about Covid-19 in Brazil, Revista Latinoamericana de Opinión Pública, 7 (2021), 1–19. https://doi.org/10.14201/rlop.23681 doi: 10.14201/rlop.23681
|
| [25] |
H. Dong, S. Ma, N. Jia, J. Tian, Understanding public transport satisfaction in post COVID-19 pandemic, Transp. Policy, 101 (2021), 81–88. https://doi.org/10.1016/j.tranpol.2020.12.004 doi: 10.1016/j.tranpol.2020.12.004
|
| [26] |
A. S. Kong, N. Burks, C. Conklin, C. Roldan, B. Skipper, S. Scott, et al., A pilot walking school bus program to prevent obesity in hispanic elementary school children: Role of physician involvement with the school community, Clin. Pediatr., 49 (2010), 989–991. https://doi.org/10.1177/0009922810370364 doi: 10.1177/0009922810370364
|


Figures(6) / Tables(10)

Shuang Zhang, Peng Jing, Daibiao Yuan, Chenlu Yang. On parents' choice of the school travel mode during the COVID-19 pandemic[J]. Mathematical Biosciences and Engineering, 2022, 19(9): 9412-9436. doi: 10.3934/mbe.2022438


 DownLoad: