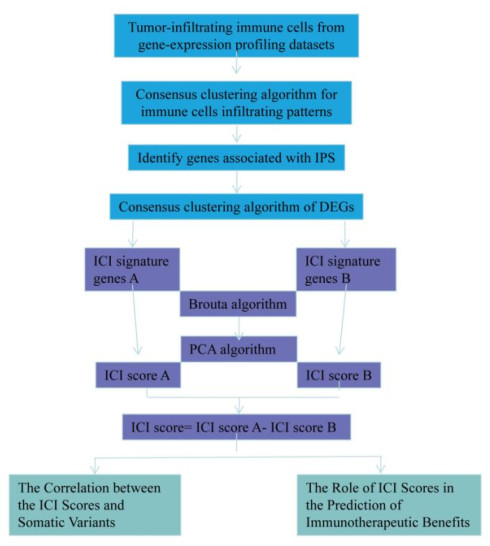
Hepatocellular carcinoma is a highly malignant tumor and patients yield limited benefits from the existing treatments. The application of immune checkpoint inhibitors is promising but the results described in the literature are not favorable. It is therefore urgent to systematically analyze the immune microenvironment of HCC and screen the population best suited for the application of immune checkpoint inhibitors to provide a basis for clinical treatment. In this study, we collected The Cancer Genome Atlas Liver Hepatocellular Carcinoma (TCGA-LIHC)-related data sets to evaluate the immune microenvironment and immune cell infiltration (ICI) in HCC. Three independent ICI subtypes showing significant differences in survival were identified. Further, TCGA-LIHC immunophenoscore (IPS) was used to identify the differentially expressed genes between high- and low-IPS in HCC, so as to identify the immune gene subtypes in HCC tumors. The ICI score model for HCC was constructed, whereby we divided HCC samples into high- and low-score groups based on the median ICI score. The differences between these groups in genomic mutation load and immunotherapy benefit in HCC were examined in detail to provide theoretical support for accurate immunotherapy strategy in HCC. Finally, four genes were screened, which could accurately predict the subtype based on the tumor immune infiltration score. The findings may provide a basis and simplify the process for screening clinical drugs suitable for relevant subgroups.
Citation: Yu Jiang, Lijuan Lin, Huiming Lv, He Zhang, Lili Jiang, Fenfen Ma, Qiuyue Wang, Xue Ma, Shengjin Yu. Immune cell infiltration and immunotherapy in hepatocellular carcinoma[J]. Mathematical Biosciences and Engineering, 2022, 19(7): 7178-7200. doi: 10.3934/mbe.2022339
Hepatocellular carcinoma is a highly malignant tumor and patients yield limited benefits from the existing treatments. The application of immune checkpoint inhibitors is promising but the results described in the literature are not favorable. It is therefore urgent to systematically analyze the immune microenvironment of HCC and screen the population best suited for the application of immune checkpoint inhibitors to provide a basis for clinical treatment. In this study, we collected The Cancer Genome Atlas Liver Hepatocellular Carcinoma (TCGA-LIHC)-related data sets to evaluate the immune microenvironment and immune cell infiltration (ICI) in HCC. Three independent ICI subtypes showing significant differences in survival were identified. Further, TCGA-LIHC immunophenoscore (IPS) was used to identify the differentially expressed genes between high- and low-IPS in HCC, so as to identify the immune gene subtypes in HCC tumors. The ICI score model for HCC was constructed, whereby we divided HCC samples into high- and low-score groups based on the median ICI score. The differences between these groups in genomic mutation load and immunotherapy benefit in HCC were examined in detail to provide theoretical support for accurate immunotherapy strategy in HCC. Finally, four genes were screened, which could accurately predict the subtype based on the tumor immune infiltration score. The findings may provide a basis and simplify the process for screening clinical drugs suitable for relevant subgroups.

| [1] |
S. F. Altekruse, S. J. Henley, J. E. Cucinelli, K. A. McGlynn, Changing hepatocellular carcinoma incidence and liver cancer mortality rates in the United States, Am. J. Gastroenterol., 4 (2014), 542-553. https://doi.org/10.1038/ajg.2014.11 doi: 10.1038/ajg.2014.11

|
| [2] |
L. A. Torre, F. Bray, R. L. Siegel, J. Ferlay, J. Lortet-Tieulent, A. Jemal, Global cancer statistics, CA Cancer J. Clin., 2 (2015), 87-108. https://doi.org/10.3322/caac.21262 doi: 10.3322/caac.21262
|
| [3] |
J. M. Llovet, S. Ricci, V. Mazzaferro, P. Hilgard, E. Gane, J. F. Blanc, et al., Sorafenib in advanced hepatocellular carcinoma, N. Engl. J. Med., 4 (2008), 378-390. https://doi.org/10.1056/NEJMoa0708857 doi: 10.1056/NEJMoa0708857
|
| [4] |
M. Kudo, R. S. Finn, S. Qin, K. H. Han, K. Ikeda, F. Piscaglia, et al., Lenvatinib versus sorafenib in first-line treatment of patients with unresectable hepatocellular carcinoma: a randomised phase 3 non-inferiority trial, Lancet, 10126 (2018), 1163-1173. https://doi.org/10.1016/S0140-6736(18)30207-1 doi: 10.1016/S0140-6736(18)30207-1
|
| [5] |
N. H. Bhayani, Y. Jiang, O. Hamed, E. T. Kimchi, K. F. Staveley-Ocarroll, N. J. Gusani, Advances in the pharmacologic treatment of hepatocellular carcinoma, Curr. Clin. Pharmacol., 4 (2015), 299-304. https://doi.org/10.2174/1574884710666151020100059 doi: 10.2174/1574884710666151020100059
|
| [6] |
D. Neureiter, S. Stintzing, T. Kiesslich, M. Ocker, Hepatocellular carcinoma: Therapeutic advances in signaling, epigenetic and immune targets, World J. Gastroenterol., 25 (2019), 3136-3150. https://doi.org/10.3748/wjg.v25.i25.3136 doi: 10.3748/wjg.v25.i25.3136
|
| [7] |
A. B. El-Khoueiry, B. Sangro, T. Yau, T. S. Crocenzi, M. Kudo, C. Hsu, et al., Nivolumab in patients with advanced hepatocellular carcinoma (CheckMate 040): an open-label, non-comparative, phase 1/2 dose escalation and expansion trial, Lancet, 10088 (2017), 2492-2502. https://doi.org/10.1016/S0140-6736(17)31046-2 doi: 10.1016/S0140-6736(17)31046-2
|
| [8] |
A. X. Zhu, R. S. Finn, J. Edeline, S. Cattan, S. Ogasawara, D. Palmer, et al., Pembrolizumab in patients with advanced hepatocellular carcinoma previously treated with sorafenib (KEYNOTE-224): a non-randomised, open-label phase 2 trial, Lancet Oncol., 7 (2018), 940-952. https://doi.org/10.1016/S1470-2045(18)30351-6 doi: 10.1016/S1470-2045(18)30351-6
|
| [9] |
P. Federico, A. Petrillo, P. Giordano, D. Bosso, A. Fabbrocini, M. Ottaviano, et al., Immune checkpoint inhibitors in hepatocellular carcinoma, current status and novel perspectives, Cancers, 10 (2020), 3025. https://doi.org/10.3390/cancers12103025 doi: 10.3390/cancers12103025
|
| [10] |
M. Binnewies, E. W. Roberts, K. Kersten, V. Chan, D. F. Fearon, M. Merad, et al., Understanding the tumor immune microenvironment (TIME) for effective therapy, Nat. Med., 5 (2018), 541-550. https://doi.org/10.1038/s41591-018-0014-x doi: 10.1038/s41591-018-0014-x
|
| [11] |
X. Tekpli, T. Lien, A. H. Røssevold, D. Nebdal, E. Borgen, H. O. Ohnstad, et al., An independent poor-prognosis subtype of breast cancer defined by a distinct tumor immune microenvironment, Nat. Commun., 1 (2019), 5499. https://doi.org/10.1038/s41467-019-13329-5 doi: 10.1038/s41467-019-13329-5
|
| [12] |
D. C. Lazăr, M. F. Avram, I. Romoșan, M. Cornianu, S. Tăban, A. Goldiș, Prognostic significance of tumor immune microenvironment and immunotherapy: Novel insights and future perspectives in gastric cancer, World J. Gastroenterol., 32 (2018), 3583-3616. https://doi.org/10.3748/wjg.v24.i32.3583 doi: 10.3748/wjg.v24.i32.3583
|
| [13] |
C. M. Balch, L. B. Riley, Y. J. Bae, M. A. Salmeron, C. D. Platsoucas, A. V. Eschenbach, et al., Patterns of human tumor-infiltrating lymphocytes in 120 human cancers, Arc. Surg., 2 (1990), 200-205. https://doi.org/10.1001/archsurg.1990.01410140078012 doi: 10.1001/archsurg.1990.01410140078012
|
| [14] |
R. A. Caruso, R. Bellocco, M. Pagano, G. Bertoli, L. Rigoli, C. Inferrera, Prognostic value of intratumoral neutrophils in advanced gastric carcinoma in a high-risk area in northern Italy, Mod. Pathol., 8 (2002), 831-837. https://doi.org/10.1097/01.MP.0000020391.98998.6B doi: 10.1097/01.MP.0000020391.98998.6B
|
| [15] |
R. D. Bense, C. Sotiriou, M. J. Piccart-Gebhart, J. Haanen, M. van Vugt, E. G. E. de Vries, et al., Relevance of tumor-infiltrating immune cell composition and functionality for disease outcome in breast cancer, J. Natl. Cancer Inst., 1 (2017), 192. https://doi.org/10.1093/jnci/djw192 doi: 10.1093/jnci/djw192
|
| [16] | S. C. Zhang, Z. Q. Hu, J. H. Long, G. M. Zhu, Y. Wang, Y. Jia, et al., Clinical implications of tumor-infiltrating immune cells in breast cancer, J. Cancer, 10 (2019), 6175-6184. https://doi.org/10.7150/jca.35901. eCollection 2019 |
| [17] |
M. Mroweh, T. Decaens, P. N. Marche, Z. M. Jilkova, F. Clément, Modulating the crosstalk between the tumor and its microenvironment using RNA interference: A treatment strategy for hepatocellular carcinoma, Int. J. Mol. Sci., 21 (2020), 5250. https://doi.org/10.3390/ijms21155250 doi: 10.3390/ijms21155250
|
| [18] |
T. Shiraki, E. Takayama, H. Magari, T. Nakata, T. Maekita, S. Enomoto, et al., Altered cytokine levels and increased CD4+CD57+ T cells in the peripheral blood of hepatitis C virus-related hepatocellular carcinoma patients, Oncol. Rep., 26 (2011), 201-208. https://doi.org/10.3892/or.2011.1258 doi: 10.3892/or.2011.1258
|
| [19] |
A. Mantovani, M. Locati, Tumor-associated macrophages as a paradigm of macrophage plasticity, diversity, and polarization: lessons and open questions, Arterioscler. Thromb. Vasc. Biol., 33 (2013), 1478-1483. https://doi.org/10.1161/ATVBAHA.113.300168 doi: 10.1161/ATVBAHA.113.300168
|
| [20] |
M. R. de Galarreta, E. Bresnahan, P. Molina-Sánchez, K. E. Lindblad, B. Maier, D. Sia, et al., β-catenin activation promotes immune escape and resistance to Anti-PD-1 therapy in hepatocellular carcinoma, Cancer Discov., 9 (2019), 1124-1141. https://doi.org/10.1158/2159-8290 doi: 10.1158/2159-8290.CD-19-0074
|
| [21] |
J. J. Harding, S. Nandakumar, J. Armenia, D. N. Khalil, M. Albano, M. Ly, et al., Prospective genotyping of hepatocellular carcinoma: Clinical implications of next-generation sequencing for matching patients to targeted and immune therapies, Clin. Cancer Res., 25 (2019), 2116-2126. https://doi.org/10.1158/1078-0432 doi: 10.1158/1078-0432.CCR-18-2293
|
| [22] |
R. S. Finn, B. Y. Ryoo, P. Merle, M. Kudo, M. Bouattour, H. Y. Lim, et al., Pembrolizumab as second-line therapy in patients with advanced hepatocellular carcinoma in KEYNOTE-240: A randomized, double-blind, phase Ⅲ trial, J. Clin. Oncol., 38 (2020), 193-202. https://doi.org/10.1200/JCO.19.01307 doi: 10.1200/JCO.19.01307
|
| [23] |
A. Dalessio, A. Cammarota, M. G. Prete, T. Pressiani, L. Rimassa, The evolving treatment paradigm of advanced hepatocellular carcinoma: putting all the pieces back together, Curr. Opin. Oncol., 33 (2021), 386-394. https://doi.org/10.1097/CCO.0000000000000744 doi: 10.1097/CCO.0000000000000744
|
| [24] |
R. C. Miksch, M. B. Schoenberg, M. Weniger, F. Bösch, S. Ormanns, B. Mayer, et al., Prognostic impact of tumor-infiltrating lymphocytes and neutrophils on survival of patients with upfront resection of pancreatic cancer, Cancers, 11 (2019), 39. https://doi.org/:10.3390/cancers11010039 doi: 10.3390/cancers11010039
|
| [25] |
S. Sousa, R. Brion, M. Lintunen, P. Kronqvist, J. Sandholm, J. Mönkkönen, et al., Human breast cancer cells educate macrophages toward the M2 activation status, Breast Cancer Res., 17 (2015), 101. https://doi.org/10.1186/s13058-015-0621-0 doi: 10.1186/s13058-015-0621-0
|
| [26] |
J. Lan, L. Sun, F. Xu, L. Liu, F. Hu, D. Song, et al., M2 macrophage-derived exosomes promote cell migration and invasion in colon cancer, Cancer Res., 79 (2019), 146-158. https://doi.org/10.1158/0008-5472 doi: 10.1158/0008-5472.CAN-18-0014
|
| [27] |
Y. Kurebayashi, H. Ojima, H. Tsujikawa, N. Kubota, J. Maehara, Y. Abe, et al., Landscape of immune microenvironment in hepatocellular carcinoma and its additional impact on histological and molecular classification, Hepatology, 68 (2018), 1025-1041. https://doi.org/10.1002/hep.29904 doi: 10.1002/hep.29904
|
| [28] |
Q. F. Chen, W. Li, P. H. Wu, L. J. Shen, Z. L. Huang, Significance of tumor-infiltrating immunocytes for predicting prognosis of hepatitis B virus-related hepatocellular carcinoma, World J. Gastroenterol., 25 (2019), 5266-5282. https://doi.org/10.3748/wjg.v25.i35.5266 doi: 10.3748/wjg.v25.i35.5266
|
| [29] |
N. Rohr-Udilova, F. Klinglmüller, R. Schulte-Hermann, J. Stift, M. Herac, M. Salzmann, et al., Deviations of the immune cell landscape between healthy liver and hepatocellular carcinoma, Sci. Rep., 8 (2018), 6220. https://doi.org/10.1038/s41598-018-24437-5 doi: 10.1038/s41598-018-24437-5
|
| [30] |
Y. Peng, C. Liu, M. Li, W. Li, M. Zhang, X. Jiang, et al., Identification of a prognostic and therapeutic immune signature associated with hepatocellular carcinoma, Cancer Cell. Int., 21 (2021), 98. https://doi.org/10.1186/s12935-021-01792-4 doi: 10.1186/s12935-021-01792-4
|
| [31] |
M. Morita, N. Nishida, K. Sakai, T. Aoki, H. Chishina, M. Takita, et al., Immunological microenvironment predicts the survival of the patients with hepatocellular carcinoma treated with anti-PD-1 antibody, Liver Cancer, 10 (2021), 380-393. https://doi.org/10.1159/000516899 doi: 10.1159/000516899
|
| [32] |
W. Ding, Y. Tan, Y. Qian, W. Xue, Y. Wang, P. Jiang, et al., Clinicopathologic and prognostic significance of tumor-associated macrophages in patients with hepatocellular carcinoma: A meta-analysis, Plos One, 14 (2019), e0223971. https://doi.org/10.1371/journal.pone.0223971 doi: 10.1371/journal.pone.0223971
|
| [33] |
O. W. Yeung, C. M. Lo, C. C. Ling, X. Qi, W. Geng, C. X. Li, et al., Alternatively activated (M2) macrophages promote tumour growth and invasiveness in hepatocellular carcinoma, J. Hepatol., 62 (2015), 607-616. https://doi.org/10.1016/j.jhep.2014.10.029 doi: 10.1016/j.jhep.2014.10.029
|
| [34] |
T. Flecken, N. Schmidt, S. Hild, E. Gostick, O. Drognitz, R. Zeiser, et al., Immunodominance and functional alterations of tumor-associated antigen-specific CD8+ T-cell responses in hepatocellular carcinoma, Hepatology, 59 (2014), 1415-1426. https://doi.org/10.1002/hep.26731 doi: 10.1002/hep.26731
|
| [35] |
A. M. van der Leun, D. S. Thommen, T. N. Schumacher, CD8(+) T cell states in human cancer: insights from single-cell analysis, Nat. Rev. Cancer, 20 (2020), 218-232. https://doi.org/10.1038/s41568-019-0235-4 doi: 10.1038/s41568-019-0235-4
|
| [36] |
H. Liao, W. Chen, Y. Dai, J. J. Richardson, J. Guo, K. Yuan, et al., Expression of programmed cell death-ligands in hepatocellular carcinoma: Correlation with immune microenvironment and survival outcomes, Front. Oncol., 9 (2019), 883. https://doi.org/10.3389/fonc.2019.00883 doi: 10.3389/fonc.2019.00883
|
| [37] |
Y. Zhou, Y. Zhang, G. Guo, X. Cai, H. Yu, Y. Cai, et al., Nivolumab plus ipilimumab versus pembrolizumab as chemotherapy-free, first-line treatment for PD-L1-positive non-small cell lung cancer, Clin. Transl. Med., 10 (2020), 107-115. https://doi.org/10.1002/ctm2.14 doi: 10.1002/ctm2.14
|
| [38] |
S. P. Patel, R. Kurzrock, PD-L1 expression as a predictive biomarker in cancer immunotherapy, Mol. Cancer Ther., 14 (2015), 847-856. https://doi.org/10.1158/1535-7163 doi: 10.1158/1535-7163.MCT-14-0983
|
| [39] |
C. Sun, R. Mezzadra, T. N. Schumacher, Regulation and function of the PD-L1 checkpoint, Immunity, 48 (2018), 434-452. https://doi.org/10.1016/j.immuni.2018.03.014 doi: 10.1016/j.immuni.2018.03.014
|
| [40] |
Z. Wang, Z. Lv, Q. Xu, L. Sun, Y. Yuan, Identification of differential proteomics in Epstein-Barr virus-associated gastric cancer and related functional analysis, Cancer Cell. Int., 21 (2021), 368. https://doi.org/10.1186/s12935-021-02077-6 doi: 10.1186/s12935-021-02077-6
|
| [41] |
S. W. Cheng, P. C. Chen, M. H. Lin, T. R. Ger, H. W. Chiu, Y. F. Lin, GBP5 repression suppresses the metastatic potential and PD-L1 expression in triple-negative breast cancer, Biomedicines, 9 (2021), 371. https://doi.org/10.3390/biomedicines9040371 doi: 10.3390/biomedicines9040371
|
| [42] |
M. Watanabe, M. Shibata, T. Inaishi, T. Ichikawa, I. Soeda, N. Miyajima, et al., MZB1 expression indicates poor prognosis in estrogen receptor-positive breast cancer, Oncol. Lett., 5 (2020), 198. https://doi.org/10.3892/ol.2020.12059 doi: 10.3892/ol.2020.12059
|
| [43] |
W. Wu, Z. Yang, F. Long, L. Luo, Q. Deng, J. Wu, et al., COL1A1 and MZB1 as the hub genes influenced the proliferation, invasion, migration and apoptosis of rectum adenocarcinoma cells by weighted correlation network analysis, Bioorg. Chem., 95 (2020), 103457. https://doi.org/10.1016/j.bioorg.2019 doi: 10.1016/j.bioorg.2019.103457
|
| [44] |
W. A. Freed-Pastor, L. J. Lambert, Z. A. Ely, N. B. Pattada, A. Bhutkar, G. Eng, et al., The CD155/TIGIT axis promotes and maintains immune evasion in neoantigen-expressing pancreatic cancer, Cancer Cell, 39 (2021), 1342-1360. https://doi.org/10.1016/j.ccell. 2021.07.007 doi: 10.1016/j.ccell.2021.07.007
|
| [45] |
Z. Ge, M. P. Peppelenbosch, D. Sprengers, J. Kwekkeboom, TIGIT, the next step towards successful combination immune checkpoint therapy in cancer, Front. Immunol., 12 (2021), 699895. https://doi.org/10.3389/fimmu.2021.699895 doi: 10.3389/fimmu.2021.699895
|
| [46] |
L. Mao, Y. Xiao, Q. C. Yang, S. C. Yang, L. L. Yang, Z. J. Sun, TIGIT/CD155 blockade enhances anti-PD-L1 therapy in head and neck squamous cell carcinoma by targeting myeloid-derived suppressor cells, Oral. Oncol., 121 (2021), 105472. https://doi.org/10.1016/j. oraloncology.2021.105472 doi: 10.1016/j.oraloncology.2021.105472
|
| [47] |
N. Li, B. Li, X. Zhan, Comprehensive analysis of tumor microenvironment identified prognostic immune-related gene signature in ovarian cancer, Front. Genet., 12 (2021), 616073. https://doi.org/10.3389/fgene.2021.616073 doi: 10.3389/fgene.2021.616073
|
| [48] |
S. A. Bhat, S. F. Walton, T. Ventura, X. Liu, J. S. McCarthy, S. T. G. Burgess, et al., Early immune suppression leads to uncontrolled mite proliferation and potent host inflammatory responses in a porcine model of crusted versus ordinary scabies, Plos Negl. Trop. Dis., 9 (2020), e0008601. https://doi.org/10.1371/journal.pntd.0008601 doi: 10.1371/journal.pntd.0008601
|
| [49] |
N. E. Ready, P. A. Ott, M. D. Hellmann, J. Zugazagoitia, C. L. Hann, F. de Braud, et al., Nivolumab monotherapy and nivolumab plus ipilimumab in recurrent small cell lung cancer: Results from the checkMate 032 randomized cohort, J. Thorac. Oncol., 3 (2020), 426-435. https://doi.org/10.1016/j.jtho.2019.10.004 doi: 10.1016/j.jtho.2019.10.004
|
| [50] |
R. M. Samstein, C. H. Lee, A. N. Shoushtari, M. D. Hellmann, R. Shen, Y. Y. Janjigian, et al., Tumor mutational load predicts survival after immunotherapy across multiple cancer types. Nat. Genet., 2 (2019), 202-206. https://doi.org/10.1038/s41588-018-0312-8 doi: 10.1038/s41588-018-0312-8
|
| [51] |
L. Liu, X. Bai, J. Wang, X. R. Tang, D. H. Wu, S. S. Du, et al., Combination of TMB and CNA stratifies prognostic and predictive responses to immunotherapy across metastatic cancer, Clin. Cancer Res., 24 (2019), 7413-7423. https://doi.org/10.1158/1078-0432 doi: 10.1158/1078-0432
|
| [52] |
R. Cristescu, R. Mogg, M. Ayers, A. Albright, E. Murphy, J. Yearley, et al., Pan-tumor genomic biomarkers for PD-1 checkpoint blockade-based immunotherapy, Science, 6411 (2018), 3593. https://doi.org/10.1126/science.aar3593 doi: 10.1126/science.aar3593
|


Figures(12) / Tables(1)

Yu Jiang, Lijuan Lin, Huiming Lv, He Zhang, Lili Jiang, Fenfen Ma, Qiuyue Wang, Xue Ma, Shengjin Yu. Immune cell infiltration and immunotherapy in hepatocellular carcinoma[J]. Mathematical Biosciences and Engineering, 2022, 19(7): 7178-7200. doi: 10.3934/mbe.2022339


 DownLoad: