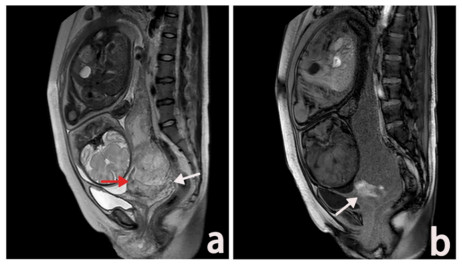
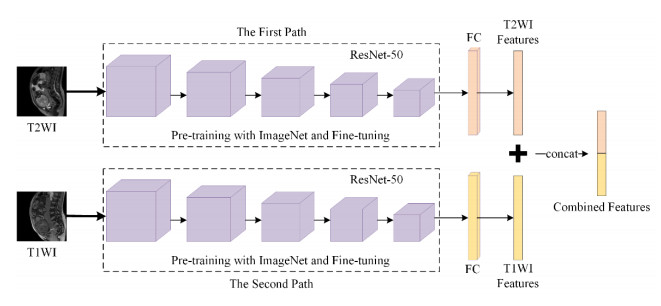
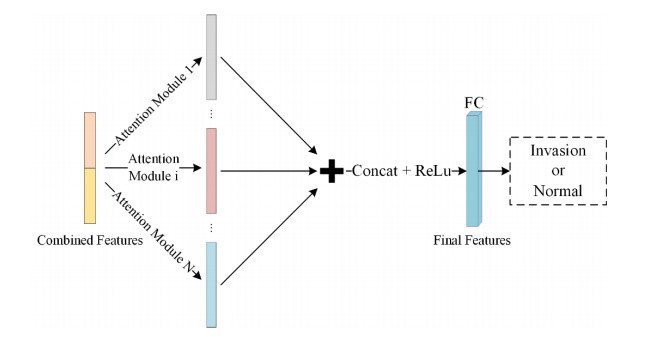
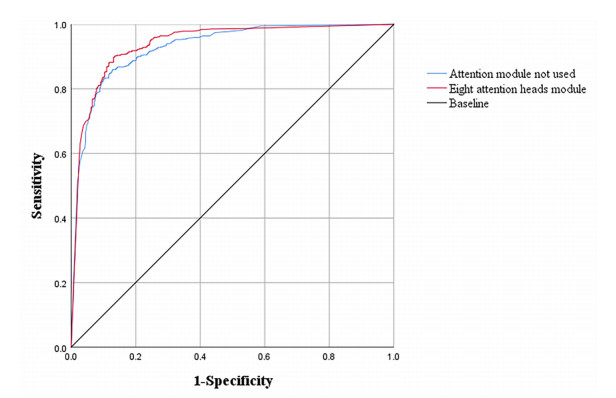
With the increase of various risk factors such as cesarean section and abortion, placenta accrete spectrum (PAS) disorder is happening more frequently year by year. Therefore, prenatal prediction of PAS is of crucial practical significance. Magnetic resonance imaging (MRI) quality will not be affected by fetal position, maternal size, amniotic fluid volume, etc., which has gradually become an important means for prenatal diagnosis of PAS. In clinical practice, T2-weighted imaging (T2WI) magnetic resonance (MR) images are used to reflect the placental signal and T1-weighted imaging (T1WI) MR images are used to reflect bleeding, both plays a key role in the diagnosis of PAS. However, it is difficult for traditional MR image analysis methods to extract multi-sequence MR image features simultaneously and assign corresponding weights to predict PAS according to their importance. To address this problem, we propose a dual-path neural network fused with a multi-head attention module to detect PAS. The model first uses a dual-path neural network to extract T2WI and T1WI MR image features separately, and then combines these features. The multi-head attention module learns multiple different attention weights to focus on different aspects of the placental image to generate highly discriminative final features. The experimental results on the dataset we constructed demonstrate a superior performance of the proposed method over state-of-the-art techniques in prenatal diagnosis of PAS. Specifically, the model we trained achieves 88.6% accuracy and 89.9% F1-score on the independent validation set, which shows a clear advantage over methods that only use a single sequence of MR images.
Citation: Jian Xu, Qian Shao, Ruo Chen, Rongrong Xuan, Haibing Mei, Yutao Wang. A dual-path neural network fusing dual-sequence magnetic resonance image features for detection of placenta accrete spectrum (PAS) disorder[J]. Mathematical Biosciences and Engineering, 2022, 19(6): 5564-5575. doi: 10.3934/mbe.2022260
With the increase of various risk factors such as cesarean section and abortion, placenta accrete spectrum (PAS) disorder is happening more frequently year by year. Therefore, prenatal prediction of PAS is of crucial practical significance. Magnetic resonance imaging (MRI) quality will not be affected by fetal position, maternal size, amniotic fluid volume, etc., which has gradually become an important means for prenatal diagnosis of PAS. In clinical practice, T2-weighted imaging (T2WI) magnetic resonance (MR) images are used to reflect the placental signal and T1-weighted imaging (T1WI) MR images are used to reflect bleeding, both plays a key role in the diagnosis of PAS. However, it is difficult for traditional MR image analysis methods to extract multi-sequence MR image features simultaneously and assign corresponding weights to predict PAS according to their importance. To address this problem, we propose a dual-path neural network fused with a multi-head attention module to detect PAS. The model first uses a dual-path neural network to extract T2WI and T1WI MR image features separately, and then combines these features. The multi-head attention module learns multiple different attention weights to focus on different aspects of the placental image to generate highly discriminative final features. The experimental results on the dataset we constructed demonstrate a superior performance of the proposed method over state-of-the-art techniques in prenatal diagnosis of PAS. Specifically, the model we trained achieves 88.6% accuracy and 89.9% F1-score on the independent validation set, which shows a clear advantage over methods that only use a single sequence of MR images.

| [1] |
K. E. Fitzpatrick, S. Sellers, P. Spark, J. J. Kurinczuk, P. Brocklehurst, M. Knight, Incidence and risk factors for placenta accreta/increta/percreta in the UK: a national casecontrol study, PLoS One, 7 (2012), 1–6. https://doi.org/10.1371/journal.pone.0052893 doi: 10.1371/journal.pone.0052893

|
| [2] |
Y. Oyelese, J. C Smulian, Placenta previa, placenta accreta, and vasa previa, Obstet. Gynecol., 107 (2006), 927–941. https://doi.org/10.1097/01.AOG.0000207559.15715.98 doi: 10.1097/01.AOG.0000207559.15715.98
|
| [3] |
A. Kilcoyne, A. S. Shenoy-Bhangle, D. J. Roberts, R. C. Sicodia, S. I. Lee, MRI of placenta accreta, placenta increta, and placenta percreta: pearls and pitfalls, Am. J. Roentgenol., 208 (2017), 214–221. https://doi.org/10.2214/AJR.16.16281 doi: 10.2214/AJR.16.16281
|
| [4] |
T. Y. Khong, The pathology of placenta accreta, a worldwide epidemic, J. Clin. Pathol., 61 (2008), 1243–1246. https://doi.org/10.1136/jcp.2008.055202 doi: 10.1136/jcp.2008.055202
|
| [5] |
Z. S. Bowman, A. G. Eller, T. R. Bardsley, T. Greene, M. W. Varner, R. M. Silver, Risk factors for placenta accreta: a large prospective cohort, Am. J. Perinatol., 31 (2014), 799–804. https://doi.org/10.1055/s-0033-1361833 doi: 10.1055/s-0033-1361833
|
| [6] |
G. Garmi, R. Salim, Epidemiology, etiology, diagnosis, and management of placenta accrete, Obstet. Gynecol. Int., 2012 (2012), 1–7. https://doi.org/10.1155/2012/873929 doi: 10.1155/2012/873929
|
| [7] |
Z. S. Bowman, T. A. Manuck, A. G. Eller, M. Simons, R. M. Silver, Risk factors for unscheduled delivery in patients with placenta accreta, Am. J. Obstet. Gynecol., 210 (2013), 241.e1–241.e6. https://doi.org/10.1016/j.ajog.2013.09.044 doi: 10.1016/j.ajog.2013.09.044
|
| [8] |
E. Jauniaux, A. Bhide, Prenatal ultrasound diagnosis and outcome of placenta previa accreta after cesarean delivery: a systematic review and metaanalysis, Am. J. Obstet. Gynecol., 217 (2017), 27–36. https://doi.org/10.1016/j.ajog.2017.02.050 doi: 10.1016/j.ajog.2017.02.050
|
| [9] |
P. Lumbiganon, M. Laopaiboon, A. M. Gülmezoglu, J. Souza, S. Taneepanichskul, P. Ruyan, et al., Method of delivery and pregnancy outcomes in asia: the who global survey on maternal and perinatal health 2007-08, Lancet, 375 (2010), 490–499. https://doi.org/10.1016/S0140-6736(09)61870-5 doi: 10.1016/S0140-6736(09)61870-5
|
| [10] |
H. Sun, H. Qu, L. Chen, W. Wang, Y. Liao, L. Zou, et al., Identification of suspicious invasive placentation based on clinical mri data using textural features and automated machine learning, Eur. Radiol., 29 (2019), 6152–6162. https://doi.org/10.1007/s00330-019-06372-9 doi: 10.1007/s00330-019-06372-9
|
| [11] |
L. Alamo, A. Anaye, J. Rey, A. Denys, G. Bongartz, S. Terraz, et al., Detection of suspected placental invasion by MRI: do the results depend on observer' experience?, Eur. J. Radiol., 82 (2013), 51–57. https://doi.org/10.1016/j.ejrad.2012.08.022 doi: 10.1016/j.ejrad.2012.08.022
|
| [12] |
Y. Ueno, K. Kitajima, F. Kawakami, T. Maeda, Y. Suenaga, S. Takahashi, et al., Novel MRI finding for diagnosis of invasive placenta praevia: evaluation of findings for 65 patients using clinical and histopathological correlations, Eur. Radiol., 24 (2014), 881–888. https://doi.org/10.1007/s00330-013-3076-7 doi: 10.1007/s00330-013-3076-7
|
| [13] |
V. Romeo, C. Ricciardi, R. Cuocolo, A. Stanzione, F. Verde, L. Sarno, et al., Machine learning analysis of MRI-derived texture features to predict placenta accreta spectrum in patients with placenta previa, Magn. Reson. Imaging, 64 (2019), 71–76. https://doi.org/10.1016/j.mri.2019.05.017 doi: 10.1016/j.mri.2019.05.017
|
| [14] |
Q. N. Do, M. A. Lewis, Y. Xin, A. J. Madhuranthakam, S. K. Happe, J. S. Dashe, et al., MRI of the placenta accreta spectrum (PAS) disorder: radiomics analysis correlates with surgical and pathological outcome, J. Magn. Reson. Imaging, 51 (2019), 936–946. https://doi.org/10.1002/jmri.26883 doi: 10.1002/jmri.26883
|
| [15] |
R. R. Xuan, T. Li, Y. T. Wang, J. Xu, W. Jin, Prenatal prediction and typing of placenta invasion using MRI deep and radiomic features, BioMed. Eng. OnLine, 20 (2021), 1–18. https://doi.org/10.1186/s12938-021-00893-5 doi: 10.1186/s12938-021-00893-5
|
| [16] |
M. R. Kocher, D. H. Sheafor, E. Bruner, C. Newman, J. F. M. Nino, Diagnosis of abnormally invasive posterior placentation: the role of MR imaging, Radiol. Case Rep., 12 (2017), 295–299. https://doi.org/10.1016/j.radcr.2017.01.014 doi: 10.1016/j.radcr.2017.01.014
|
| [17] |
D. Pizzi, A. Tavoletta, R. Narciso, D. Mastrodicasa, S. Trebeschi, C. Celentano, et al., Prenatal planning of placenta previa: diagnostic accuracy of a novel MRI-based prediction model for placenta accreta spectrum (PAS) and clinical outcome, Abdom. Radiol., 44 (2019), 1873–1882. https://doi.org/10.1007/s00261-018-1882-8 doi: 10.1007/s00261-018-1882-8
|
| [18] | A. D. C. Malita, C. Saracin, C. Dan, R. Prejbeanu, The added value of using Fusion-DWI technique in day to day practice for appreciating placental invasion of the myometrium, in 2017 E-Health and Bioengineering Conference (EHB), (2017), 305–308. https://doi.org/10.1109/EHB.2017.7995422 |
| [19] |
X. L. Zheng, J. M. Xu, M. J. Yang, MRI diagnosis and classification of placenta increta in the third trimester of pregnancy, Radiol. Pract., 30 (2015), 264–268. https://doi.org/10.4103/0971-3026.125592 doi: 10.4103/0971-3026.125592
|
| [20] | K. He, X. Zhang, S. Ren, J. Sun, Deep residual learning for image recognition, in Proceedings of the IEEE conference on computer vision and pattern recognition, (2016), 770–778. |
| [21] |
B. D. de Vos, F. F. Berendsen, M. A. Viergever, H. Sokooti, M. Staring, I. Išgum, A deep learning framework for unsupervised affine and deformable image registration, Med. Image Anal., 52 (2019), 128–143. https://doi.org/10.1016/j.media.2018.11.010 doi: 10.1016/j.media.2018.11.010
|
| [22] |
M. Hatt, C. Parmar, J. Y. Qi, I. E. Naqa, Machine (deep) learning methods for image processing and radiomics, IEEE Trans. Radiat. Plasma Med. Sci., 3 (2019), 104–108. https://doi.org/10.1109/TRPMS.2019.2899538 doi: 10.1109/TRPMS.2019.2899538
|
| [23] | M. Zhu, M. Yao, Y. He, B. Wu, Studies on high-resolution remote sensing sugarcane field extraction based on deep learning, in IOP conference series: earth and environmental science, 237 (2019), 1–8. https://doi.org/10.1088/1755-1315/237/3/032046 |
| [24] | S. Guo, T. Li, K. Wang, C. Zhang, H. Kang, A lightweight neural network for hard exudate segmentation of fundus image, in International Conference on Artificial Neural Networks, 11729 (2019), 189–199. https://doi.org/10.1007/978-3-030-30508-6_16 |
| [25] | S. Ioffe, C. Szegedy, Batch normalization: Accelerating deep network training by reducing internal covariate shift, in International Conference on Machine Learning, 37 (2015), 448–456. |
Figures(4) / Tables(6)

Jian Xu, Qian Shao, Ruo Chen, Rongrong Xuan, Haibing Mei, Yutao Wang. A dual-path neural network fusing dual-sequence magnetic resonance image features for detection of placenta accrete spectrum (PAS) disorder[J]. Mathematical Biosciences and Engineering, 2022, 19(6): 5564-5575. doi: 10.3934/mbe.2022260


 DownLoad: