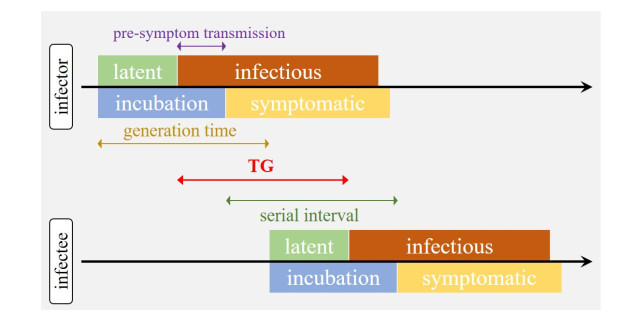
The coronavirus disease 2019 (COVID-19) emerged in Wuhan, China in the end of 2019, and soon became a serious public health threat globally. Due to the unobservability, the time interval between transmission generations (TG), though important for understanding the disease transmission patterns, of COVID-19 cannot be directly summarized from surveillance data. In this study, we develop a likelihood framework to estimate the TG and the pre-symptomatic transmission period from the serial interval observations from the individual transmission events. As the results, we estimate the mean of TG at 4.0 days (95%CI: 3.3-4.6), and the mean of pre-symptomatic transmission period at 2.2 days (95%CI: 1.3-4.7). We approximate the mean latent period of 3.3 days, and 32.2% (95%CI: 10.3-73.7) of the secondary infections may be due to pre-symptomatic transmission. The timely and effectively isolation of symptomatic COVID-19 cases is crucial for mitigating the epidemics.
Citation: Shi Zhao. Estimating the time interval between transmission generations when negative values occur in the serial interval data: using COVID-19 as an example[J]. Mathematical Biosciences and Engineering, 2020, 17(4): 3512-3519. doi: 10.3934/mbe.2020198
The coronavirus disease 2019 (COVID-19) emerged in Wuhan, China in the end of 2019, and soon became a serious public health threat globally. Due to the unobservability, the time interval between transmission generations (TG), though important for understanding the disease transmission patterns, of COVID-19 cannot be directly summarized from surveillance data. In this study, we develop a likelihood framework to estimate the TG and the pre-symptomatic transmission period from the serial interval observations from the individual transmission events. As the results, we estimate the mean of TG at 4.0 days (95%CI: 3.3-4.6), and the mean of pre-symptomatic transmission period at 2.2 days (95%CI: 1.3-4.7). We approximate the mean latent period of 3.3 days, and 32.2% (95%CI: 10.3-73.7) of the secondary infections may be due to pre-symptomatic transmission. The timely and effectively isolation of symptomatic COVID-19 cases is crucial for mitigating the epidemics.

| [1] | A. R. Tuite, D. N. Fisman, Reporting, Epidemic Growth, and Reproduction Numbers for the 2019 Novel Coronavirus (2019-nCoV) Epidemic, Ann. Intern. Med., (2020). |
| [2] | S. Zhao, P. Cao, D. Gao, Z. Zhuang, Y. Cai, J. Ran, et al., Serial interval in determining the estimation of reproduction number of the novel coronavirus disease (COVID-19) during the early outbreak, J. Travel Med., (2020), taaa033. |
| [3] | J. Riou, C. L. Althaus, Pattern of early human-to-human transmission of Wuhan 2019 novel coronavirus (2019-nCoV), December 2019 to January 2020, Euro. Surveill., 25 (2020), 2000058. |
| [4] |
P. E. M. Fine, The Interval between Successive Cases of an Infectious Disease, Am. J. Epidemiol., 158 (2003), 1039-1047. doi: 10.1093/aje/kwg251

|
| [5] |
L. F. White, J. Wallinga, L. Finelli, C. Reed, S. Riley, M. Lipsitch, et al., Estimation of the reproductive number and the serial interval in early phase of the 2009 influenza A/H1N1 pandemic in the USA, Influenza Other Respir. Viruses, 3 (2009), 267-276. doi: 10.1111/j.1750-2659.2009.00106.x
|
| [6] | R. Milwid, A. Steriu, J. Arino, J. Heffernan, A. Hyder, D. Schanzer, et al., Toward Standardizing a Lexicon of Infectious Disease Modeling Terms, Front. Public Health, 4 (2016), 213. |
| [7] |
M. A. Vink, M. C. J. Bootsma, J. Wallinga, Serial Intervals of Respiratory Infectious Diseases: A Systematic Review and Analysis, Am. J. Epidemiol., 180 (2014), 865-875. doi: 10.1093/aje/kwu209
|
| [8] | J. Wallinga, M. Lipsitch, How generation intervals shape the relationship between growth rates and reproductive numbers, P. Roy. Soc. B, 274 (2007), 599-604. |
| [9] |
C. Huang, Y. Wang, X. Li, L. Ren, J. Zhao, Y. Hu, et al., Clinical features of patients infected with 2019 novel coronavirus in Wuhan, China, Lancet, 395 (2020), 497-506. doi: 10.1016/S0140-6736(20)30183-5
|
| [10] |
Q. Li, X. Guan, P. Wu, X. Wang, L. Zhou, Y. Tong, et al., Early Transmission Dynamics in Wuhan, China, of Novel Coronavirus-Infected Pneumonia, New Engl. J. Med., 382 (2020), 1199-1207. doi: 10.1056/NEJMoa2001316
|
| [11] |
S. Zhao, S. S. Musa, Q. Lin, J. Ran, G. Yang, W. Wang, et al., Estimating the Unreported Number of Novel Coronavirus (2019-nCoV) Cases in China in the First Half of January 2020: A Data-Driven Modelling Analysis of the Early Outbreak, J. Clin. Med., 9 (2020), 388. doi: 10.3390/jcm9020388
|
| [12] |
J. T. Wu, K. Leung, G. M. Leung, Nowcasting and forecasting the potential domestic and international spread of the 2019-nCoV outbreak originating in Wuhan, China: a modelling study, Lancet, 395 (2020), 689-697. doi: 10.1016/S0140-6736(20)30260-9
|
| [13] | S. Zhao, Z. Zhuang, P. Cao, J. Ran, D. Gao, Y. Lou, et al., Quantifying the association between domestic travel and the exportation of novel coronavirus (2019-nCoV) cases from Wuhan, China in 2020: a correlational analysis, J. Travel Med., 27 (2020), taaa022. |
| [14] | World Health Organization, Statement on the second meeting of the International Health Regulations (2005) Emergency Committee regarding the outbreak of novel coronavirus (2019-nCoV), 2020. |
| [15] | World Health Organization, Novel Coronavirus (2019-nCoV) situation reports, 3. 2020. |
| [16] | Z. Du, X. Xu, Y. Wu, L. Wang, B. J. Cowling, L. A. Meryers, Serial Interval of COVID-19 among Publicly Reported Confirmed Cases, Emerg. Infecti. Dis., 26 (2020). |
| [17] | S. Ma, J. Zhang, M. Zeng, Q. Yun, W. Guo, Y. Zheng, et al., Epidemiological parameters of coronavirus disease 2019: a pooled analysis of publicly reported individual data of 1155 cases from seven countries, medRxiv (2020), 2020.03.21.20040329. |
| [18] | C. You, Y. Deng, W. Hu, J. Sun, Q. Lin, F. Zhou, et al., Estimation of the Time-Varying Reproduction Number of COVID-19 Outbreak in China, medRxiv (2020), 2020.02.08.20021253. |
| [19] |
B. J. Cowling, V. J. Fang, S. Riley, J. M. Peiris, G. M. Leung, Estimation of the serial interval of influenza, Epidemiol., 20 (2009), 344. doi: 10.1097/EDE.0b013e31819d1092
|
| [20] |
H. Nishiura, N. M. Linton, A. R. Akhmetzhanov, Serial interval of novel coronavirus (COVID-19) infections, Int. J. Infect. Dis., 93 (2020), 284-286. doi: 10.1016/j.ijid.2020.02.060
|
| [21] | S. Zhao, D. Gao, Z. Zhuang, M. Chong, Y. Cai, J. Ran, et al., Estimating the serial interval of the novel coronavirus disease (COVID-19): A statistical analysis using the public data in Hong Kong from January 16 to February 15, 2020, medRxiv (2020), 2002.02.21.20026559. |
| [22] | J. Fan, T. Huang, Profile likelihood inferences on semiparametric varying-coefficient partially linear models, Bernoulli, 11 (2005), 1031-1057. |
| [23] |
S. Zhao, Q. Lin, J. Ran, S. S. Musa, G. Yang, W. Wang, et al., Preliminary estimation of the basic reproduction number of novel coronavirus (2019-nCoV) in China, from 2019 to 2020: A data-driven analysis in the early phase of the outbreak, Int. J. Infect. Dis., 92 (2020), 214-217. doi: 10.1016/j.ijid.2020.01.050
|
| [24] | J. A. Backer, D. Klinkenberg, J. Wallinga, Incubation period of 2019 novel coronavirus (2019-nCoV) infections among travellers from Wuhan, China, 20-28 January 2020, Euro. Surveill., 25 (2020), 2000062. |
| [25] |
W. J. Guan, Z. Y. Ni, Y. Hu, W. H. Liang, C. Q. Ou, J. X. He, et al., Clinical Characteristics of Coronavirus Disease 2019 in China, N. Engl. J. Med., 382 (2020), 1708-1720. doi: 10.1056/NEJMoa2002032
|
| [26] | S. A. Lauer, K. H. Grantz, Q. Bi, F. K. Jones, Q. Zheng, H. R. Meredith, et al., The incubation period of coronavirus disease 2019 (COVID-19) from publicly reported confirmed cases: estimation and application, Ann. Intern. Med., (2020). |
| [27] | L. Ferretti, C. Wymant, M. Kendall, L. Zhao, A. Nurtay, L. Abeler-Dorner, et al., Quantifying SARS-CoV-2 transmission suggests epidemic control with digital contact tracing, Science, 368 (2020), eabb6936. |
| [28] | X. He, E. H. Y. Lau, P. Wu, X. Deng, J. Wang, X. Hao, et al., Temporal dynamics in viral shedding and transmissibility of COVID-19, Nat. Med., (2020), 1-4. |
| [29] | Y. Liu, A. A. Gayle, A. Wilder-Smith, J. Rocklov, The reproductive number of COVID-19 is higher compared to SARS coronavirus, J. Travel. Med., 27 (2020), taaa021. |
| [30] |
R. Li, S. Pei, B. Chen, Y. Song, T. Zhang, W. Yang, et al., Substantial undocumented infection facilitates the rapid dissemination of novel coronavirus (SARS-CoV2), Science, 368 (2020), 489-493. doi: 10.1126/science.abb3221
|
| [31] |
Z. Zhuang, S. Zhao, Q. Lin, P. Cao, Y. Lou, L. Yang, et al., Preliminary estimation of the novel coronavirus disease (COVID-19) cases in Iran: A modelling analysis based on overseas cases and air travel data, Int. J. Infect. Dis., 94 (2020), 29-31. doi: 10.1016/j.ijid.2020.03.019
|
Figures(3)

Shi Zhao. Estimating the time interval between transmission generations when negative values occur in the serial interval data: using COVID-19 as an example[J]. Mathematical Biosciences and Engineering, 2020, 17(4): 3512-3519. doi: 10.3934/mbe.2020198


 DownLoad: