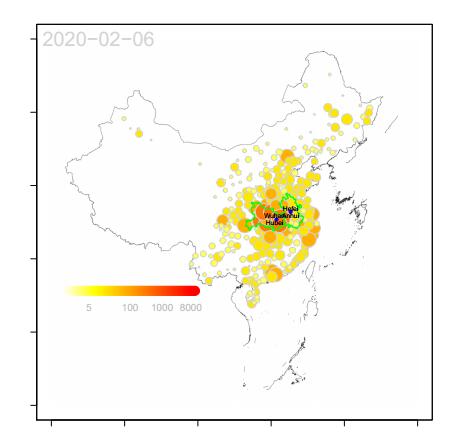
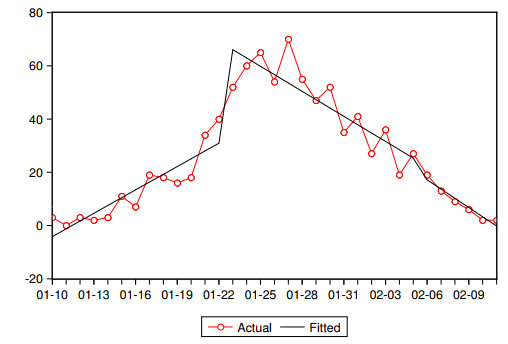
Since the first case of coronavirus disease (COVID-19) in Wuhan Hubei, China, was reported in December 2019, COVID-19 has spread rapidly across the country and overseas. The first case in Anhui, a province of China, was reported on January 10, 2020. In the field of infectious diseases, modeling, evaluating and predicting the rate of disease transmission is very important for epidemic prevention and control. Different intervention measures have been implemented starting from different time nodes in the country and Anhui, the epidemic may be divided into three stages for January 10 to February 11, 2020, namely. We adopted interrupted time series method and develop an SEI/QR model to analyse the data. Our results displayed that the lockdown of Wuhan implemented on January 23, 2020 reduced the contact rate of epidemic transmission in Anhui province by 48.37%, and centralized quarantine management policy for close contacts in Anhui reduced the contact rate by an additional 36.97%. At the same time, the estimated basic reproduction number gradually decreased from the initial 2.9764 to 0.8667 and then to 0.5725. We conclude that the Wuhan lockdown and the centralized quarantine management policy in Anhui played a crucial role in the timely and effective mitigation of the epidemic in Anhui. One merit of this work is the adoption of morbidity data which may reflect the epidemic more accurately and promptly. Our estimated parameters are largely in line with the World Health Organization estimates and previous studies.
Citation: Jingjing Tian, Jiabing Wu, Yunting Bao, Xiaoyu Weng, Lei Shi, Binbin Liu, Xinya Yu, Longxing Qi, Zhirong Liu. Modeling analysis of COVID-19 based on morbidity data in Anhui, China[J]. Mathematical Biosciences and Engineering, 2020, 17(4): 2842-2852. doi: 10.3934/mbe.2020158
Since the first case of coronavirus disease (COVID-19) in Wuhan Hubei, China, was reported in December 2019, COVID-19 has spread rapidly across the country and overseas. The first case in Anhui, a province of China, was reported on January 10, 2020. In the field of infectious diseases, modeling, evaluating and predicting the rate of disease transmission is very important for epidemic prevention and control. Different intervention measures have been implemented starting from different time nodes in the country and Anhui, the epidemic may be divided into three stages for January 10 to February 11, 2020, namely. We adopted interrupted time series method and develop an SEI/QR model to analyse the data. Our results displayed that the lockdown of Wuhan implemented on January 23, 2020 reduced the contact rate of epidemic transmission in Anhui province by 48.37%, and centralized quarantine management policy for close contacts in Anhui reduced the contact rate by an additional 36.97%. At the same time, the estimated basic reproduction number gradually decreased from the initial 2.9764 to 0.8667 and then to 0.5725. We conclude that the Wuhan lockdown and the centralized quarantine management policy in Anhui played a crucial role in the timely and effective mitigation of the epidemic in Anhui. One merit of this work is the adoption of morbidity data which may reflect the epidemic more accurately and promptly. Our estimated parameters are largely in line with the World Health Organization estimates and previous studies.

| [1] |
J. S. Kahn, K. Mcintosh, History and recent advances in coronavirus discovery, Pediatr. Infect. Dis. J., 24 (2005), S223-S227. doi: 10.1097/01.inf.0000188166.17324.60

|
| [2] | Z. A. Memish, N. Nishra, K. J. Olival, S. F. Fagbo, V. Kapoor, J. H. Epstein, et al., Middle east respiratory syndrome coronavirus in bats, Saudi Arabia, Emerg. Infect. Dis., 19 (2013), 1819-1823. |
| [3] |
M. E. Killerby, H. M. Biggs, C. M. Midgley, S. I. Gerber, J. T. Watson, Middle east respiratory syndrome coronavirus transmission, Emerg. Infect. Dis., 26 (2020), 191-198. doi: 10.3201/eid2602.190697
|
| [4] |
J. Cohen, D. Normile, New SARS-like virus in China triggers alarm, Science, 367 (2020), 234-235. doi: 10.1126/science.367.6475.234
|
| [5] |
D. S. Hui, E. I. Azhar, T. A. Madani, F. Ntoumi, R. Kock, O. Dar, et al., The continuing 2019-nCoV epidemic threat of novel coronaviruses to global health-The latest 2019 novel coronavirus outbreak in Wuhan, China, Int. J. Infect. Dis., 91 (2020), 264-266. doi: 10.1016/j.ijid.2020.01.009
|
| [6] | World Health Organization (WHO), Coronavirus. Available from: https://www.who.int/healthtopics/coronavirus. |
| [7] |
K. O. Kwok, A. Tang, V. W. I. Wei, W. H. Park, E. K. Yeoh, S. Riley, Epidemic Models of Contact Tracing: Systematic Review of Transmission Studies of Severe Acute Respiratory Syndrome and Middle East Respiratory Syndrome, Comput. Struct. Biotechnol. J., 17 (2019), 186-194. doi: 10.1016/j.csbj.2019.01.003
|
| [8] |
C. Castillo-Chavez, C. W. Castillo-Garsowa, A. Yakubu, Mathematical Models of Isolation and Quarantine, J. Am. Med. Assoc., 290 (2003), 2876-2877. doi: 10.1001/jama.290.21.2876
|
| [9] | B. Tang, Estimation of the transmission risk of the 2019-ncov and its implication for public health interventions, J. Clin. Med., 9 (2020), 1-13. |
| [10] | T. Chen, J. Rui, Q. Wang, Z. ZHao, J. Cui, L. Yin, A mathematical model for simulating the transmission of Wuhan novel Coronavirus, bioRxiv, (2020). |
| [11] | G. M. Leung, K. Leug, Crowdsourcing data to mitigate epidemics, Lancent Dig. Health, (2020). |
| [12] | M. Chinazzi, J. T. Davis, M. Ajelli, C. Gioannini, M. Litvinova, S. Merler, et al., The effect of travel restrictions on the spread of the 2019 novel cornavirus(2019-nCov) outbreak, Science, (2020), 1-12. |
| [13] |
S. Zhao, S. S. Musa, Q. Lin, J. Ran, G. Yang, W. Wang, et al., Estimating the unreported number of novel coronavirus (2019-nCov) cases in China in the first half of January 2020: a data-driven modelling analysis of the early outbreak, J. Clin. Med., 9 (2020), 388. doi: 10.3390/jcm9020388
|
| [14] |
C. Huang, Y. Wang, X. Li, L. Ren, J. Zhao, Y. Hu, et al., Clinical features of patients infected with 2019 novel coronavirus in Wuhan, China, Lancet, 395 (2020), 497-506. doi: 10.1016/S0140-6736(20)30183-5
|
| [15] | P. Wu, X. Hao, E. H. Y. Lau, J. Y. Wong, K. S. Leung, J. T. Wu, et al., Teal-time tentative assessment of the epidemiological characteristics of novel coronavirus infections in Wuhan China, as at 22 January 2020, Euro. Surveill., 25 (2020). |
| [16] |
R. Kozma, N. K. Kasabov, J. S. Kim, A. Cohen, Integration of connectionist methods and chaotic time-series analysis for the prediction of process data, Int. J. Intell. Syst., 13 (1998), 519-538. doi: 10.1002/(SICI)1098-111X(199806)13:6<519::AID-INT7>3.0.CO;2-O
|
| [17] |
A. K. Wagner, S. B. Soumerai, F. Zhang, D. Ross-Degnan, Segmented Regression Analysis of Interrupted Time Series Studies in Medication Use Research, J. Clin. Pharm. Ther., 27 (2002), 299-309. doi: 10.1046/j.1365-2710.2002.00430.x
|

Figures(9) / Tables(2)

Jingjing Tian, Jiabing Wu, Yunting Bao, Xiaoyu Weng, Lei Shi, Binbin Liu, Xinya Yu, Longxing Qi, Zhirong Liu. Modeling analysis of COVID-19 based on morbidity data in Anhui, China[J]. Mathematical Biosciences and Engineering, 2020, 17(4): 2842-2852. doi: 10.3934/mbe.2020158


 DownLoad: