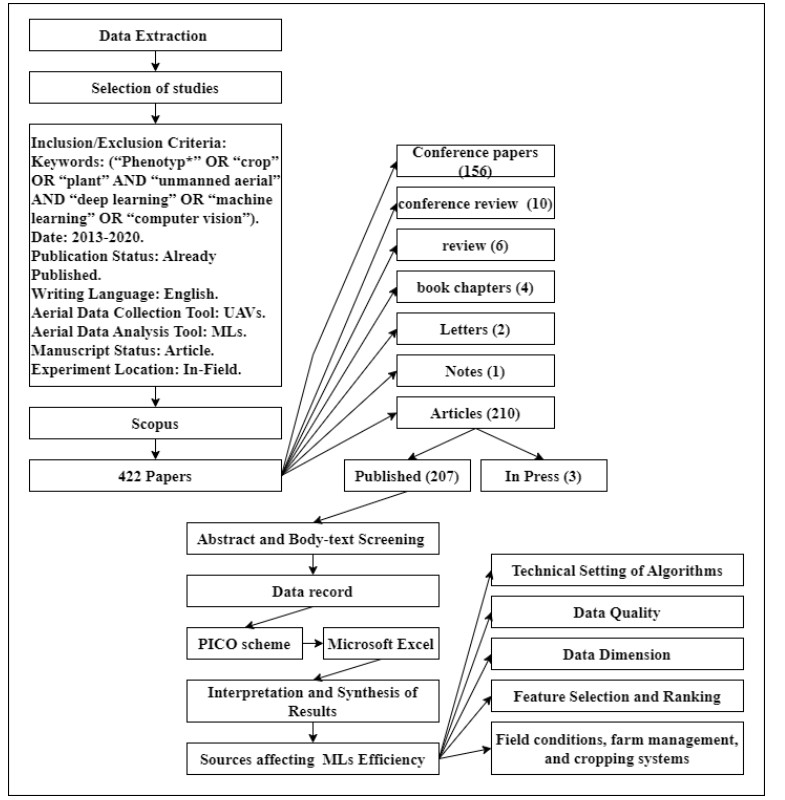
Conventional methods of data sampling in agriculture are time consuming, labor intensive, destructive, subject to human error and affected by field conditions. Thus, remote sensing technologies such as unmanned aerial vehicles (UAVs) became widely used as an alternative for data collection. Nevertheless, the big data captured by the UAVs is challenging to interpret. Therefore, machine learning algorithms (MLs) are used to interpret this data. However, the operational efficiency of those MLs is yet to be improved due to different sources affecting their modeling certainty. Therefore, this study aims to review different sources affecting the accuracy of MLs regression and classification interventions in precision agriculture. In this regard, 109 articles were identified in the Scopus database. The search was restricted to articles written in English, published during 2013–2020, and used UAVs as in-field data collection tools and ML algorithms for data analysis and interpretation. This systematic review will be the point of review for researchers to recognize the possible sources affecting the certainty of regression and classification results associated with MLs use. The recognition of those sources points out areas for improvement of MLs performance in precision agriculture. In this review, the performance of MLs is still evaluated in general, which opens the road for further detailed research.
Citation: Radhwane Derraz, Farrah Melissa Muharam, Noraini Ahmad Jaafar. Uncertainty sources affecting operational efficiency of ML algorithms in UAV-based precision agriculture: A 2013–2020 systematic review[J]. AIMS Agriculture and Food, 2023, 8(2): 687-719. doi: 10.3934/agrfood.2023038
Conventional methods of data sampling in agriculture are time consuming, labor intensive, destructive, subject to human error and affected by field conditions. Thus, remote sensing technologies such as unmanned aerial vehicles (UAVs) became widely used as an alternative for data collection. Nevertheless, the big data captured by the UAVs is challenging to interpret. Therefore, machine learning algorithms (MLs) are used to interpret this data. However, the operational efficiency of those MLs is yet to be improved due to different sources affecting their modeling certainty. Therefore, this study aims to review different sources affecting the accuracy of MLs regression and classification interventions in precision agriculture. In this regard, 109 articles were identified in the Scopus database. The search was restricted to articles written in English, published during 2013–2020, and used UAVs as in-field data collection tools and ML algorithms for data analysis and interpretation. This systematic review will be the point of review for researchers to recognize the possible sources affecting the certainty of regression and classification results associated with MLs use. The recognition of those sources points out areas for improvement of MLs performance in precision agriculture. In this review, the performance of MLs is still evaluated in general, which opens the road for further detailed research.

| [1] | UN FAO (2019) Tracking Progress on Food and Agriculture-related SDG Indicators. Available from: http://www.fao.org/sdg-progress-report/en/#chapeau. |
| [2] | United Nations, Department of Economic and Social Affairs, Population Division (2019) World population prospects 2019: Highlights. Available from: https://population.un.org/wpp/publications/files/wpp2019_highlights.pdf. |
| [3] |
Delanka-Pedige HMK, Cheng X, Munasinghe-Arachchige SP, et al. (2020) Conventional vs. algal wastewater technologies: Reclamation of microbially safe water for agricultural reuse. Algal Res 51: 102022. https://doi.org/10.1016/j.algal.2020.102022 doi: 10.1016/j.algal.2020.102022

|
| [4] |
Singh R, Singh GS (2017) Traditional agriculture: a climate-smart approach for sustainable food production. Energ Ecol Environ 2: 296–316. https://doi.org/10.1007/s40974-017-0074-7 doi: 10.1007/s40974-017-0074-7
|
| [5] | Singh P, Pandey PC, Petropoulos GP, et al. (2020) Hyperspectral remote sensing in precision agriculture: present status, challenges, and future trends, In: Pandey PC, Srivastava PK, Balzter H, et al., (Eds.), Hyperspectral remote sensing: Theory and applications, Amsterdam: Elsevier. https://doi.org/10.1016/b978-0-08-102894-0.00009-7 |
| [6] |
Liu S, Baret F, Andrieu B, et al. (2017) Estimation of wheat plant density at early stages using high resolution imagery. Front Plant Sci 8: 739. https://doi.org/10.3389/fpls.2017.00739 doi: 10.3389/fpls.2017.00739
|
| [7] |
Archontoulis SV, Miguez FE (2015) Nonlinear regression models and applications in agricultural research. Agron J 107: 786–798. https://doi.org/10.2134/agronj2012.0506 doi: 10.2134/agronj2012.0506
|
| [8] | Bishop CM (2006) Pattern recognition and machine learning. New York: Springer. |
| [9] |
Tilly N, Aasen H, Bareth G (2015) Fusion of plant height and vegetation indices for the estimation of barley biomass. Remote Sens 7: 11449–11480. https://doi.org/10.3390/rs70911449 doi: 10.3390/rs70911449
|
| [10] |
Tilly N, Hoffmeister D, Cao Q, et al. (2013) Precise plant height monitoring and biomass estimation with Terrestrial Laser Scanning in paddy rice. ISPRS Ann Photogramm Remote Sens Spatial Inf Sci Ⅱ-5/W2: 295–300. https://doi.org/10.5194/isprsannals-Ⅱ-5-W2-295-2013 doi: 10.5194/isprsannals-Ⅱ-5-W2-295-2013
|
| [11] |
Boursianis AD, Papadopoulou MS, Diamantoulakis P, et al. (2020) Internet of Things (IoT) and Agricultural Unmanned Aerial Vehicles (UAVs) in smart farming: A comprehensive review. Internet Things 18: 100187. https://doi.org/10.1016/j.iot.2020.100187 doi: 10.1016/j.iot.2020.100187
|
| [12] |
Chlingaryan A, Sukkarieh S, Whelan B (2018) Machine learning approaches for crop yield prediction and nitrogen status estimation in precision agriculture: A review. Comput Electron Agric 151: 61–69. https://doi.org/10.1016/j.compag.2018.05.012 doi: 10.1016/j.compag.2018.05.012
|
| [13] |
Cust EE, Sweeting AJ, Ball K, et al. (2019) Machine and deep learning for sport-specific movement recognition: A systematic review of model development and performance. J Sports Sci 37: 568–600. https://doi.org/10.1080/02640414.2018.1521769 doi: 10.1080/02640414.2018.1521769
|
| [14] |
García R, Aguilar J, Toro M, et al. (2020) A systematic literature review on the use of machine learning in precision livestock farming. Comput Electron Agric 179: 105826. https://doi.org/10.1016/j.compag.2020.105826 doi: 10.1016/j.compag.2020.105826
|
| [15] |
Sharma R, Kamble SS, Gunasekaran A, et al. (2020) A systematic literature review on machine learning applications for sustainable agriculture supply chain performance. Comput Oper Res 119: 104926. https://doi.org/10.1016/j.cor.2020.104926 doi: 10.1016/j.cor.2020.104926
|
| [16] |
Colorado JD, Cera-Bornacelli N, Caldas JS, et al. (2020) Estimation of nitrogen in rice crops from UAV-captured images. Remote Sens 12: 3396. https://doi.org/10.3390/rs12203396 doi: 10.3390/rs12203396
|
| [17] |
She B, Yang YY, Zhao ZG, et al. (2020) Identification and mapping of soybean and maize crops based on Sentinel-2 data. Int J Agric Biol Eng 13: 171–182. https://doi.org/10.25165/j.ijabe.20201306.6183 doi: 10.25165/j.ijabe.20201306.6183
|
| [18] |
Calvario G, Sierra B, Alarcón TE, et al. (2017) A multi-disciplinary approach to remote sensing through low-cost UAVs. Sensors 17: 1411. https://doi.org/10.3390/s17061411 doi: 10.3390/s17061411
|
| [19] |
Viljanen N, Honkavaara E, Näsi R, et al. (2018) A novel machine learning method for estimating biomass of grass swards using a photogrammetric canopy height model, images and vegetation indices captured by a drone. Agriculture 8: 70. https://doi.org/10.3390/agriculture8050070 doi: 10.3390/agriculture8050070
|
| [20] |
Ndikumana E, Minh DHT, Thu DNH, et al. (2018) Estimation of rice height and biomass using multitemporal SAR Sentinel-1 for Camargue, Southern France. Remote Sens 10: 1394. https://doi.org/10.3390/rs10091394 doi: 10.3390/rs10091394
|
| [21] |
Xu JX, Ma J, Tang YN, et al. (2020) Estimation of sugarcane yield using a machine learning approach based on uav-lidar data. Remote Sens 12: 2823. https://doi.org/10.3390/rs12172823 doi: 10.3390/rs12172823
|
| [22] |
Parreiras TC, Lense GHE, Moreira RS, et al. (2020) Using unmanned aerial vehicle and machine learning algorithm to monitor leaf nitrogen in coffee. Coffee Sci 15: 151736. https://doi.org/10.25186/.v15i.1736 doi: 10.25186/.v15i.1736
|
| [23] |
Jiang J, Cai W, Zheng H, et al. (2019) Using digital cameras on an unmanned aerial vehicle to derive optimum color vegetation indices for leaf nitrogen concentration monitoring in winter wheat. Remote Sens 11: 2667. https://doi.org/10.3390/rs11222667 doi: 10.3390/rs11222667
|
| [24] |
Chen Z, Miao Y, Lu J, et al. (2019) In-season diagnosis of winter wheat nitrogen status in smallholder farmer fields across a village using unmanned aerial vehicle-based remote sensing. Agronomy 9: 619. https://doi.org/10.3390/agronomy9100619 doi: 10.3390/agronomy9100619
|
| [25] |
Wang X, Miao Y, Dong R, et al. (2021) Machine learning-based in-season nitrogen status diagnosis and side-dress nitrogen recommendation for corn. Eur J Agron 123: 126193. https://doi.org/10.1016/j.eja.2020.126193 doi: 10.1016/j.eja.2020.126193
|
| [26] |
Maimaitijiang M, Sagan V, Sidike P, et al. (2020) Crop monitoring using satellite/UAV data fusion and machine learning. Remote Sens 12: 1357. https://doi.org/10.3390/RS12091357 doi: 10.3390/RS12091357
|
| [27] |
Nevavuori P, Narra N, Linna P, et al. (2020) Crop yield prediction using multitemporal UAV data and spatio-temporal deep learning models. Remote Sens 12: 4000. https://doi.org/10.3390/rs12234000 doi: 10.3390/rs12234000
|
| [28] | Goemans MX (1994) Advanced algorithms. Cambridge: Massachusetts Inst Technol. |
| [29] | Pandey D, Niwaria K, Chourasia B (2019) Machine learning algorithms: A review. IRJET 6: 916–922. |
| [30] |
Ha JG, Moon H, Kwak JT, et al. (2017) Deep convolutional neural network for classifying Fusarium wilt of radish from unmanned aerial vehicles. J Appl Remote Sens 11: 042621. https://doi.org/10.1117/1.jrs.11.042621 doi: 10.1117/1.jrs.11.042621
|
| [31] |
Kerkech M, Hafiane A, Canals R (2020) VddNet : Vine disease detection network based on multispectral images and depth map. Remote Sens 12: 3305. https://doi.org/10.3390/rs12203305 doi: 10.3390/rs12203305
|
| [32] |
Kwak GH, Park NW (2019) Impact of texture information on crop classification with machine learning and UAV images. Appl Sci 9: 643. https://doi.org/10.3390/app9040643 doi: 10.3390/app9040643
|
| [33] |
Lin Z, Guo W (2020) Sorghum panicle detection and counting using unmanned aerial system images and deep learning. Front Plant Sci 11: 534853. https://doi.org/10.3389/fpls.2020.534853 doi: 10.3389/fpls.2020.534853
|
| [34] |
Yang Q, Liu M, Zhang Z, et al. (2019) Mapping plastic mulched farmland for high resolution images of unmanned aerial vehicle using deep semantic segmentation. Remote Sens 11: 2008. https://doi.org/10.3390/rs11172008 doi: 10.3390/rs11172008
|
| [35] |
Chew R, Rineer J, Beach R, et al. (2020) Deep neural networks and transfer learning for food crop identification in UAV images. Drones 4: 7. https://doi.org/10.3390/drones4010007 doi: 10.3390/drones4010007
|
| [36] |
Gomez Selvaraj M, Vergara A, Montenegro F, et al. (2020) Detection of banana plants and their major diseases through aerial images and machine learning methods: A case study in DR Congo and Republic of Benin. ISPRS J Photogramm Remote Sens 169: 110–124. https://doi.org/10.1016/j.isprsjprs.2020.08.025 doi: 10.1016/j.isprsjprs.2020.08.025
|
| [37] |
Grüner E, Wachendorf M, Astor T (2020) The potential of UAV-borne spectral and textural information for predicting aboveground biomass and N fixation in legume-grass mixtures. PLoS One 15: 0234703. https://doi.org/10.1371/journal.pone.0234703 doi: 10.1371/journal.pone.0234703
|
| [38] |
Lambert JPT, Childs DZ, Freckleton RP (2019) Testing the ability of unmanned aerial systems and machine learning to map weeds at subfield scales: A test with the weed Alopecurus myosuroides (Huds). Pest Manag Sci 75: 2283–2294. https://doi.org/10.1002/ps.5444 doi: 10.1002/ps.5444
|
| [39] |
Malambo L, Popescu S, Ku N, et al. (2019) A deep learning semantic segmentation-based approach for field-level sorghum panicle counting. Remote Sens 11: 2939. https://doi.org/10.3390/rs11242939 doi: 10.3390/rs11242939
|
| [40] |
Osco LP, Junior M, Paula A, et al. (2020) Leaf nitrogen concentration and plant height prediction for maize using UAV-based multispectral imagery and machine learning techniques. Remote Sens 12: 3273. https://doi.org/10.3390/rs12193237 doi: 10.3390/rs12193237
|
| [41] |
Trevisan R, Pérez O, Schmitz N, et al. (2020) High-throughput phenotyping of soybean maturity using time series UAV imagery and convolutional neural networks. Remote Sens 12: 3617. https://doi.org/10.3390/rs12213617 doi: 10.3390/rs12213617
|
| [42] |
Wang T, Thomasson JA, Yang C, et al. (2020) Automatic classification of cotton root rot disease based on UAV remote sensing. Remote Sens 12: 1310. https://doi.org/10.3390/RS12081310 doi: 10.3390/RS12081310
|
| [43] |
Zha H, Miao Y, Wang T, et al. (2020) Improving unmanned aerial vehicle remote sensing-based rice nitrogen nutrition index prediction with machine learning. Remote Sens 12: 215. https://https://doi.org/10.3390/rs12020215 doi: 10.3390/rs12020215
|
| [44] |
Abdulridha J, Ampatzidis Y, Qureshi J, et al. (2020) Laboratory and UAV-based identification and classification of tomato yellow leaf curl, bacterial spot, and target spot diseases in tomato utilizing hyperspectral imaging and machine learning. Remote Sens 12: 2732. https://doi.org/10.3390/RS12172732 doi: 10.3390/RS12172732
|
| [45] |
Cao Y, Jiang K, Wu J, et al. (2020) Inversion modeling of japonica rice canopy chlorophyll content with UAV hyperspectral remote sensing. PLoS One 15: e0238530. https://doi.org/10.1371/journal.pone.0238530 doi: 10.1371/journal.pone.0238530
|
| [46] |
de Castro AI, Torres-Sánchez J, Peña JM, et al. (2018) An automatic random forest-OBIA algorithm for early weed mapping between and within crop rows using UAV imagery. Remote Sens 10: 285. https://doi.org/10.3390/rs10020285 doi: 10.3390/rs10020285
|
| [47] |
Durfee N, Ochoa CG, Mata-Gonzalez R (2019) The use of low-altitude UAV imagery to assess western juniper density and canopy cover in treated and untreated stands. Forests 10: 296. https://doi.org/10.3390/f10040296 doi: 10.3390/f10040296
|
| [48] |
Jin X, Liu S, Baret F, et al. (2017) Estimates of plant density of wheat crops at emergence from very low altitude UAV imagery. Remote Sens Environ 198: 105–114. https://doi.org/10.1016/j.rse.2017.06.007 doi: 10.1016/j.rse.2017.06.007
|
| [49] |
Karami A, Crawford M, Delp EJ (2020) Automatic plant counting and location based on a few-shot learning technique. IEEE J Sel Top Appl Earth Obs Remote Sens 13: 5872–5886. https://doi.org/10.1109/JSTARS.2020.3025790 doi: 10.1109/JSTARS.2020.3025790
|
| [50] |
Khan Z, Rahimi-Eichi V, Haefele S, et al. (2018) Estimation of vegetation indices for high-throughput phenotyping of wheat using aerial imaging. Plant Methods 14: 20. https://doi.org/10.1186/s13007-018-0287-6 doi: 10.1186/s13007-018-0287-6
|
| [51] |
Mart J, Apolo-apolo OE, Pe M (2020) A cloud-based environment for generating yield estimation maps from apple orchards using UAV imagery and a deep learning technique. Front Plant Sci 11: 1086. https://doi.org/10.3389/fpls.2020.01086 doi: 10.3389/fpls.2020.01086
|
| [52] |
Moeckel T, Dayananda S, Nidamanuri RR, et al. (2018) Estimation of vegetable crop parameter by multi-temporal UAV-borne images. Remote Sens 10: 805. https://doi.org/10.3390/rs10050805 doi: 10.3390/rs10050805
|
| [53] |
Moghimi A, Yang C, Anderson JA (2020) Aerial hyperspectral imagery and deep neural networks for high-throughput yield phenotyping in wheat. Comput Electron Agric 172: 105299. https://doi.org/10.1016/j.compag.2020.105299 doi: 10.1016/j.compag.2020.105299
|
| [54] |
Sapkota B, Singh V, Neely C, et al. (2020) Detection of Italian ryegrass in wheat and prediction of competitive interactions using remote-sensing and machine-learning techniques. Remote Sens 12: 2977. https://doi.org/10.3390/RS12182977 doi: 10.3390/RS12182977
|
| [55] |
Su J, Liu C, Coombes M, et al. (2018) Wheat yellow rust monitoring by learning from multispectral UAV aerial imagery. Comput Electron Agric 155: 157–166. https://doi.org/10.1016/j.compag.2018.10.017 doi: 10.1016/j.compag.2018.10.017
|
| [56] |
Wang T, Thomasson JA, Isakeit T, et al. (2020) A plant-by-plant method to identify and treat cotton root rot based on UAV remote sensing. Remote Sens 12: 2453. https://doi.org/10.3390/RS12152453 doi: 10.3390/RS12152453
|
| [57] |
Colorado JD, Francisco C, Mendez D, et al. (2020) A novel NIR-image segmentation method for the precise estimation of above-ground biomass in rice crops. PLoS ONE 15: e0239591. https://doi.org/10.1371/journal.pone.0239591 doi: 10.1371/journal.pone.0239591
|
| [58] |
Kerkech M, Hafiane A, Canals R (2020) Vine disease detection in UAV multispectral images using optimized image registration and deep learning segmentation approach. Comput Electron Agric 174: 105446. https://doi.org/10.1016/j.compag.2020.105446 doi: 10.1016/j.compag.2020.105446
|
| [59] | Lillesand T, Kiefer RW, Chipman J (2015) Remote sensing and image interpretation, 7th Eds., Hoboken: John Wiley & Sons. https://doi.org/10.14358/pers.81.8.615 |
| [60] |
El Bilali A, Taleb A (2020) Prediction of irrigation water quality parameters using machine learning models in a semi-arid environment. J Saudi Soc Agric Sci 19: 439–451. https://doi.org/10.1016/j.jssas.2020.08.001 doi: 10.1016/j.jssas.2020.08.001
|
| [61] |
Sadeghi-tehran P, Virlet N, Ampe EM, et al. (2019) DeepCount : In-Field automatic quantification of wheat spikes using simple linear iterative clustering and deep convolutional neural networks. Front Plant Sci 10: 1176. https://doi.org/10.3389/fpls.2019.01176 doi: 10.3389/fpls.2019.01176
|
| [62] |
Han L, Yang G, Dai H, et al. (2019) Modeling maize above-ground biomass based on machine learning approaches using UAV remote-sensing data. Plant Methods 15: 10. https://doi.org/10.1186/s13007-019-0394-z doi: 10.1186/s13007-019-0394-z
|
| [63] |
Näsi R, Viljanen N, Kaivosoja J, et al. (2018) Estimating biomass and nitrogen amount of barley and grass using UAV and aircraft based spectral and photogrammetric 3D features. Remote Sens 10: 1082. https://doi.org/10.3390/rs10071082 doi: 10.3390/rs10071082
|
| [64] |
Ballesteros R, Ortega JF, Hernández D, et al. (2015) Characterization of vitis vinifera l. Canopy using unmanned aerial vehicle-based remote sensing and photogrammetry techniques. Am J Enol Vitic 66: 120–129. https://doi.org/10.5344/ajev.2014.14070 doi: 10.5344/ajev.2014.14070
|
| [65] |
Zhou C, Ye H, Xu Z, et al. (2019) Estimating maize-leaf coverage in field conditions by applying a machine learning algorithm to UAV remote sensing images. Appl Sci 9: 2389. https://doi.org/10.3390/app9112389 doi: 10.3390/app9112389
|
| [66] |
Csillik O, Cherbini J, Johnson R, et al. (2018) Identification of citrus trees from unmanned aerial vehicle imagery using convolutional neural networks. Drones 2: 39. https://doi.org/10.3390/drones2040039 doi: 10.3390/drones2040039
|
| [67] |
Dyson J, Mancini A, Frontoni E, et al. (2019) Deep learning for soil and crop segmentation from remotely sensed data. Remote Sens 11: 1859. https://doi.org/10.3390/rs11161859 doi: 10.3390/rs11161859
|
| [68] |
Cao F, Liu F, Guo H, et al. (2018) Fast detection of sclerotinia sclerotiorum on oilseed rape leaves using low-altitude remote sensing technology. Sensors 18: 4464 https://doi.org/10.3390/s18124464 doi: 10.3390/s18124464
|
| [69] |
Kawamura K, Asai H, Yasuda T, et al. (2020) Discriminating crops/weeds in an upland rice field from UAV images with the SLIC-RF algorithm. Plant Prod Sci 24: 198–215. https://doi.org/10.1080/1343943X.2020.1829490 doi: 10.1080/1343943X.2020.1829490
|
| [70] | Kitchenham B, Charters S (2007) Guidelines for performing Systematic Literature Reviews in Software Engineering: Version 2.3. Available from: https://www.researchgate.net/publication/302924724_Guidelines_for_performing_Systematic_Literature_Reviews_in_Software_Engineering. |
| [71] | Cumpston M, Chandler J (2019) Planning a cochrane review, In: Higgins JPT, Thomas J, Chandler J, et al., (Eds.), Cochrane handbook for systematic reviews of interventions, Chichester: John Wiley & Sons. |
| [72] | Li T, Higgins JPT, Deeks JJ (2019) Collecting data, In: Higgins JPT, Thomas J, Chandler J, et al., (Eds.), Cochrane handbook for systematic reviews of interventions, Chichester: John Wiley & Sons. |
| [73] |
Moghimi A, Pourreza A, Zuniga-ramirez G, et al. (2020) A novel machine learning approach to estimate grapevine leaf nitrogen concentration using aerial multispectral imagery. Remote Sens 12: 3515. https://doi.org/10.3390/rs12213515 doi: 10.3390/rs12213515
|
| [74] |
Zhu W, Sun Z, Peng J, et al. (2019) Estimating maize above-ground biomass using 3D point clouds of multi-source unmanned aerial vehicle data at multi-spatial scales. Remote Sens 11: 2678. https://doi.org/10.3390/rs11222678 doi: 10.3390/rs11222678
|
| [75] |
Lu N, Zhou J, Han Z, et al. (2019) Improved estimation of aboveground biomass in wheat from RGB imagery and point cloud data acquired with a low-cost unmanned aerial vehicle system. Plant Methods 15: 17. https://doi.org/10.1186/s13007-019-0402-3 doi: 10.1186/s13007-019-0402-3
|
| [76] |
Lee H, Wang J, Leblon B (2020) Using linear regression, random forests, and support vector machine with unmanned aerial vehicle multispectral images to predict canopy nitrogen weight in corn. Remote Sens 12: 2071. https://doi.org/10.3390/rs12132071 doi: 10.3390/rs12132071
|
| [77] |
Zhang X, Han L, Dong Y, et al. (2019) A deep learning-based approach for automated yellow rust disease detection from high-resolution hyperspectral UAV images. Remote Sens 11: 1554. https://doi.org/10.3390/rs11131554 doi: 10.3390/rs11131554
|
| [78] |
Valente J, Sari B, Kooistra L, et al. (2020) Automated crop plant counting from very high-resolution aerial imagery. Precis Agric 21: 1366–1384. https://doi.org/10.1007/s11119-020-09725-3 doi: 10.1007/s11119-020-09725-3
|
| [79] |
Zhang J, Xie T, Yang C, et al. (2020) Segmenting purple rapeseed leaves in the field from UAV RGB imagery using deep learning as an auxiliary means for nitrogen stress detection. Remote Sens 12: 1403. https://doi.org/10.3390/RS12091403 doi: 10.3390/RS12091403
|
| [80] |
Zhou C, Hongbao Y, Jun H, et al. (2019) Automated counting of rice panicle by applying deep learning model to images from unmanned aerial vehicle platform. Sensors 19: 3106. https://doi.org/doi:10.3390/s19143106 doi: 10.3390/s19143106
|
| [81] |
Zhou X, Kono Y, Win A, et al. (2021) Predicting within-field variability in grain yield and protein content of winter wheat using UAV-based multispectral imagery and machine learning approaches. Plant Prod Sci 24: 137–151. https://doi:10.1080/1343943X.2020.1819165 doi: 10.1080/1343943X.2020.1819165
|
| [82] |
Gomez Selvaraj M, Valderrama M, Guzman D, et al. (2020) Machine learning for high-throughput field phenotyping and image processing provides insight into the association of above and below-ground traits in cassava (Manihot esculenta Crantz). Plant Methods 16: 87. https://doi.org/10.1186/s13007-020-00625-1 doi: 10.1186/s13007-020-00625-1
|
| [83] |
Zhou J, Tian Y, Yuan C, et al. (2019) Improved UAV opium poppy detection using an updated YOLOV3 model. Sensors 19: 4851. https://doi.org/10.3390/s19224851 doi: 10.3390/s19224851
|
| [84] |
Bah MD, Hafiane A, Canals R (2020) CRowNet: Deep network for crop row detection in UAV images. IEEE Access 8: 5189–5200. https://doi:10.1109/ACCESS.2019.2960873 doi: 10.1109/ACCESS.2019.2960873
|
| [85] |
Ampatzidis Y, Partel V, Costa L (2020) Agroview: Cloud-based application to process, analyze and visualize UAV-collected data for precision agriculture applications utilizing artificial intelligence. Comput Electron Agric 174: 105457. https://doi.org/10.1016/j.compag.2020.105457 doi: 10.1016/j.compag.2020.105457
|
| [86] |
Zhang D, Zhou X, Zhang J, et al. (2018) Detection of rice sheath blight using an unmanned aerial system with high-resolution color and multispectral imaging. PLoS One 13: e0187470. https://doi.org/10.1371/journal.pone.0187470 doi: 10.1371/journal.pone.0187470
|
| [87] |
Revill A, Florence A, MacArthur A, et al. (2019) The value of Sentinel-2 spectral bands for the assessment of winter wheat growth and development. Remote Sens 11: 2050. https://doi.org/10.3390/rs11172050 doi: 10.3390/rs11172050
|
| [88] |
Bareth G, Juliane B, Nora T, et al. (2016) A Comparison of UAV- and TLS-derived plant height for crop monitoring : Using polygon grids for the analysis of crop surface models (CSMs). PFG 2: 85–94. https://doi.org/10.1127/pfg/2016/0289 doi: 10.1127/pfg/2016/0289
|
| [89] |
Guo Y, Wang H, Wu Z, et al. (2020) Modified red blue vegetation index for chlorophyll estimation and yield prediction of maize from visible images captured by UAV. Sensors 20: 5055. https://doi.org/10.3390/s20185055 doi: 10.3390/s20185055
|
| [90] |
Di Nisio A, Adamo F, Acciani G, et al. (2020) Fast detection of olive trees affected by xylella fastidiosa from uavs using multispectral imaging. Sensors 20: 4915. https://doi.org/10.3390/s20174915 doi: 10.3390/s20174915
|
| [91] |
Zhang C, Craine WA, McGee RJ, et al. (2020) Image-based phenotyping of flowering intensity in cool-season crops. Sensors 20: 1450. https://doi.org/10.3390/s20051450 doi: 10.3390/s20051450
|
| [92] |
Kattenborn T, Eichel J, Wiser S, et al. (2020) Convolutional Neural Networks accurately predict cover fractions of plant species and communities in Unmanned Aerial Vehicle imagery. Remote Sens Ecol Conserv 6: 472–486. https://doi.org/10.1002/rse2.146 doi: 10.1002/rse2.146
|
| [93] |
Yamamoto K, Togami T, Yamaguchi N (2017) Super-resolution of plant disease images for the acceleration of image-based phenotyping and vigor diagnosis in agriculture. Sensors 17: 2557. https://doi.org/10.3390/s17112557 doi: 10.3390/s17112557
|
| [94] |
Zhou J, Yungbluth D, Vong CN, et al. (2009) Estimation of the maturity date of soybean breeding lines using UAV-based multispectral imagery. Remote Sens 11: 2075. https://doi.org/10.3390/rs11182075 doi: 10.3390/rs11182075
|
| [95] |
Pérez-Ortiz M, Peña JM, Gutiérrez PA, et al. (2016) Selecting patterns and features for between- and within- crop-row weed mapping using UAV-imagery. Expert Syst Appl 47: 85–94. https://doi.org/10.1016/j.eswa.2015.10.043 doi: 10.1016/j.eswa.2015.10.043
|
| [96] | Kuhn M, Johnson K (2013) Applied predictive modeling, New York: Springer. https://doi.org/10.1007/978-1-4614-6849-3 |
| [97] |
Li J, Oswald C, Graef GL, et al. (2020) Improving model robustness for soybean iron de fi ciency chlorosis rating by unsupervised pre-training on unmanned aircraft system derived images. Comput Electron Agric 175: 105557. https://doi.org/10.1016/j.compag.2020.105557 doi: 10.1016/j.compag.2020.105557
|
| [98] |
Lu H, Cao Z (2020) TasselNetV2 + : A fast implementation for high-throughput plant counting from high-resolution RGB imagery. Front Plant Sci 11: 541960. https://doi.org/10.3389/fpls.2020.541960 doi: 10.3389/fpls.2020.541960
|
| [99] |
Freeman D, Gupta S, Hudson Smith D, et al. (2019) Watson on the farm: Using cloud-based artificial intelligence to identify early indicators of water stress. Remote Sens 11: 2645. https://doi.org/10.3390/rs11222645 doi: 10.3390/rs11222645
|
| [100] |
Ma J, Li Y, Du K, et al. (2020) Segmenting ears of winter wheat at flowering stage using digital images and deep learning. Comput Electron Agric 168: 105159. https://doi.org/10.1016/j.compag.2019.105159 doi: 10.1016/j.compag.2019.105159
|
| [101] |
Yang Q, Shi L, Han J, et al. (2020) A near real-time deep learning approach for detecting rice phenology based on UAV images. Agric Forest Meteorol 287: 107938. https://doi.org/10.1016/j.agrformet.2020.107938 doi: 10.1016/j.agrformet.2020.107938
|
| [102] |
Dian Bah M, Hafiane A, Canals R (2018) Deep learning with unsupervised data labeling for weed detection in line crops in UAV images. Remote Sens 10: 1690. https://doi.org/10.3390/rs10111690 doi: 10.3390/rs10111690
|
| [103] |
Su J, Coombes M, Liu C, et al. (2020) Machine learning-based crop drought mapping system by UAV remote sensing RGB imagery. Unmanned Syst 8: 71–83. https://doi.org/10.1142/S2301385020500053 doi: 10.1142/S2301385020500053
|
| [104] |
Yang M, Boubin JG, Ping H, et al. (2020) Adaptive autonomous UAV scouting for rice lodging assessment using edge computing with deep learning EDANet. Comput Electron Agric 179: 105817. https://doi.org/10.1016/j.compag.2020.105817 doi: 10.1016/j.compag.2020.105817
|
| [105] |
Jiang Q, Fang S, Peng Y, et al. (2019) UAV-based biomass estimation for rice-combining spectral, TIN-based structural and meteorological features. Remote Sens 11: 890. https://doi.org/10.3390/RS11070890 doi: 10.3390/RS11070890
|
| [106] |
Duarte-Carvajalino JM, Alzate DF, Ramirez AA, et al. (2018) Evaluating late blight severity in potato crops using unmanned aerial vehicles and machine learning algorithms. Remote Sens 10: 1513. https://doi.org/10.3390/rs10101513 doi: 10.3390/rs10101513
|
| [107] |
Qi G, Zhao G, Xi X (2020) Soil salinity inversion of winter wheat areas based on satellite-unmanned aerial vehicle-ground collaborative system in coastal of the Yellow River Delta. Sensors 20: 6521. https://doi.org/10.3390/s20226521 doi: 10.3390/s20226521
|
| [108] |
Fu Z, Jiang J, Gao Y, et al. (2020) Wheat growth monitoring and yield estimation based on multi-rotor unmanned aerial vehicle. Remote Sens 12: 508. https://doi.org/10.3390/rs12030508 doi: 10.3390/rs12030508
|
| [109] |
Niu Y, Zhang L, Zhang H, et al. (2019) Estimating above-ground biomass of maize using features derived from UAV-based RGB imagery. Remote Sens 11: 1261. https://doi.org/10.3390/rs11111261 doi: 10.3390/rs11111261
|
| [110] |
Dash JP, Watt MS, Paul TS, et al. (2019) Early detection of invasive exotic trees using UAV and manned aircraft multispectral and LiDAR Data. Remote Sens 11: 1812. https://doi.org/10.3390/rs11151812 doi: 10.3390/rs11151812
|
| [111] |
Wiesner-hanks T, Wu H, Stewart E, et al. (2019) Millimeter-level plant disease detection from aerial photographs via deep learning and crowdsourced data. Front Plant Sci 10: 1550. https://doi.org/10.3389/fpls.2019.01550 doi: 10.3389/fpls.2019.01550
|
| [112] |
Ampatzidis Y, Partel V (2019) UAV-based high throughput phenotyping in citrus utilizing multispectral imaging and artificial intelligence. Remote Sens 11: 410. https://doi.org/10.3390/rs11040410 doi: 10.3390/rs11040410
|
| [113] |
Dang LM, Wang H, Li Y, et al. (2020) Fusarium wilt of radish detection using rgb and near infrared images from unmanned aerial vehicles. Remote Sens 12: 2863. https://doi.org/10.3390/rs12172863 doi: 10.3390/rs12172863
|
| [114] |
Poblete T, Ortega-Farías S, Ryu D (2018) Automatic coregistration algorithm to remove canopy shaded pixels in UAV-borne thermal images to improve the estimation of crop water stress index of a drip-irrigated cabernet sauvignon vineyard. Sensors 18: 397. https://doi.org/10.3390/s18020397 doi: 10.3390/s18020397
|
| [115] |
Feng L, Zhang Z, Ma Y, et al. (2020) Alfalfa yield prediction using UAV-based hyperspectral imagery and ensemble learning. Remote Sens 12: 2028. https://doi.org/10.3390/rs12122028 doi: 10.3390/rs12122028
|
| [116] |
Qi G, Zhao G, Xi X (2020) Soil salinity inversion of winter wheat areas based on satellite-unmanned aerial vehicle-ground collaborative system in coastal of the Yellow River Delta. Sensors 20: 6521. https://doi.org/10.3390/s20226521 doi: 10.3390/s20226521
|
| [117] |
Wen D, Tongyu X, Fenghua Y, et al. (2018) Measurement of nitrogen content in rice by inversion of hyperspectral reflectance data from an unmanned aerial vehicle. Cienc Rural 48: e20180008. https://doi.org/10.1590/0103-8478cr20180008 doi: 10.1590/0103-8478cr20180008
|
| [118] |
Neupane B, Horanont T, Hung ND (2019) Deep learning based banana plant detection and counting using high-resolution red-green-blue (RGB) images collected from unmanned aerial vehicle (UAV). PLoS One 14: e0223906. https://doi.org/10.1371/journal.pone.0223906 doi: 10.1371/journal.pone.0223906
|
| [119] |
Predrag R, Đordevic V, Milic S, et al. (2020) Prediction of soybean plant density using a machine learning model and vegetation indices extracted from rgb images taken with a UAV. Agronomy 10: 1108. https://doi.org/10.3390/agronomy10081108 doi: 10.3390/agronomy10081108
|
| [120] |
Ampatzidis Y, Partel V, Meyering B, et al. (2019) Citrus rootstock evaluation utilizing UAV-based remote sensing and artificial intelligence. Comput Electron Agric 164: 104900. https://doi.org/10.1016/j.compag.2019.104900 doi: 10.1016/j.compag.2019.104900
|
| [121] |
Oh S, Chang A, Ashapure A, et al. (2020) Plant counting of cotton from UAS imagery using deep learning-based object detection framework. Remote Sens 12: 2981. https://doi.org/doi.org/10.3390/rs12182981 doi: 10.3390/rs12182981
|
| [122] |
Revill A, Florence A, Macarthur A, et al. (2020) Quantifying uncertainty and bridging the scaling gap in the retrieval of leaf area index by coupling sentinel-2 and UAV observations. Remote Sens 12: 1843. https://doi.org/10.3390/rs12111843 doi: 10.3390/rs12111843
|
| [123] |
Xu J-X, Ma J, Tang YN, et al. (2020) Estimation of sugarcane yield using a machine learning approach based on uav-lidar data. Remote Sens 12: 2823. https://doi.org/10.3390/rs12172823 doi: 10.3390/rs12172823
|
| [124] |
Carl C, Lehmann JRK, Landgraf D, et al. (2019) Robinia pseudoacacia L. in short rotation coppice: Seed and stump shoot reproduction as well as UAS-based spreading analysis. Forests 10: 235. https://doi.org/10.3390/f10030235 doi: 10.3390/f10030235
|
| [125] |
Mazzia V, Comba L, Khaliq A, et al. (2020) UAV and machine learning based refinement of a satellite-driven vegetation index for precision agriculture. Sensors 20: 2530. https://doi.org/10.3390/s20092530 doi: 10.3390/s20092530
|
| [126] |
Yao L, Van De Zedde R, Kowalchuk G (2021) Recent developments and potential of robotics in plant eco-phenotyping. Emerg Top Life Sci 5: 289–300. https://doi.org/10.1042/ETLS20200275 doi: 10.1042/ETLS20200275
|
| [127] |
Lakhiar IA, Jianmin G, Syed TN, et al. (2018) Monitoring and control systems in agriculture using intelligent sensor techniques: A review of the aeroponic system. J Sensors 2018: 8672769. https://doi.org/10.1155/2018/8672769 doi: 10.1155/2018/8672769
|
| [128] | Hägg L, Sandberg J (2021) The Engineer's Guide to Tank Gauging. Available from: https://www.emerson.com/documents/automation/-engineer-s-guide-to-tank-gauging-en-175314.pdf. |
| [129] |
Adão T, Hruška J, Pádua L, et al. (2017) Hyperspectral imaging: A review on UAV-based sensors, data processing and applications for agriculture and forestry. Remote Sens 9: 1110. https://doi.org/10.3390/rs9111110 doi: 10.3390/rs9111110
|
| [130] |
Atefi A, Ge Y, Pitla S, et al. (2021) Robotic technologies for high-throughput plant phenotyping: Contemporary reviews and future perspectives. Front Plant Sci 12: 611940. https://doi.org/10.3389/fpls.2021.611940 doi: 10.3389/fpls.2021.611940
|
| [131] | Sharifi M, Sevier S, Zhang H, et al. (2021) Mechatronics for a LiDAR-based mobile robotic platform for pasture biomass measurement. In: Billingsley J., Brett P. (Eds.), Mechatronics and machine vision in Practice 4. Cham: Springer, 71–80. https://doi.org/10.1007/978-3-030-43703-9_6 |
| [132] |
Azeta J, Bolu CA, Alele F, et al. (2019) Application of mechatronics in agriculture: A review. J Phys Conf Ser 1378: 032006. https://doi.org/10.1088/1742-6596/1378/3/032006 doi: 10.1088/1742-6596/1378/3/032006
|
| [133] |
Sharma A, Vans E, Shigemizu D, et al. (2019) DeepInsight: A methodology to transform a non-image data to an image for convolution neural network architecture. Sci Rep 9: 11399. https://doi.org/10.1038/s41598-019-47765-6 doi: 10.1038/s41598-019-47765-6
|
| [134] |
Zhu Y, Brettin T, Xia F, et al. (2021) Converting tabular data into images for deep learning with convolutional neural networks. Sci Rep 11: 11325. https://doi.org/10.1038/s41598-021-90923-y doi: 10.1038/s41598-021-90923-y
|
| [135] | Buturović L, Miljković D (2020) A novel method for classification of tabular data using convolutional neural networks. BioRxiv. https://doi.org/10.1101/2020.05.02.074203 |

Figures(2) / Tables(2)

Radhwane Derraz, Farrah Melissa Muharam, Noraini Ahmad Jaafar. Uncertainty sources affecting operational efficiency of ML algorithms in UAV-based precision agriculture: A 2013–2020 systematic review[J]. AIMS Agriculture and Food, 2023, 8(2): 687-719. doi: 10.3934/agrfood.2023038


 DownLoad: