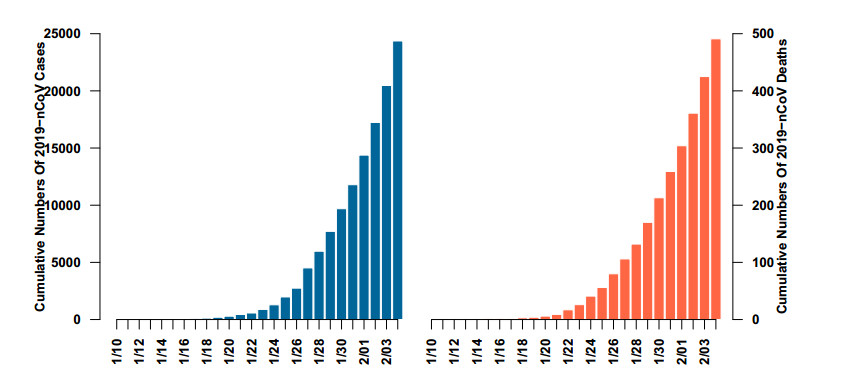
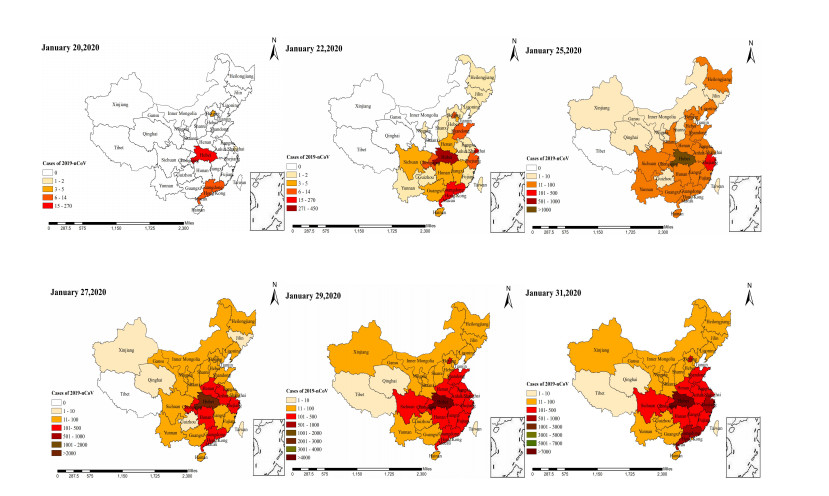
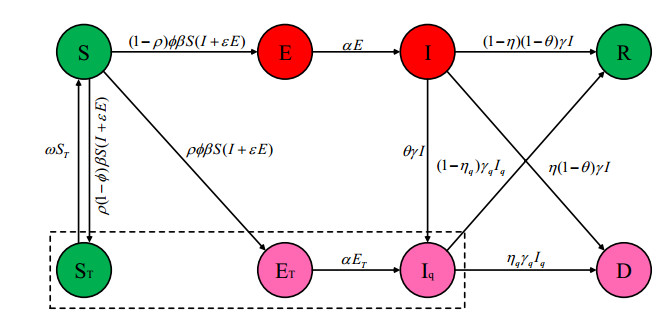
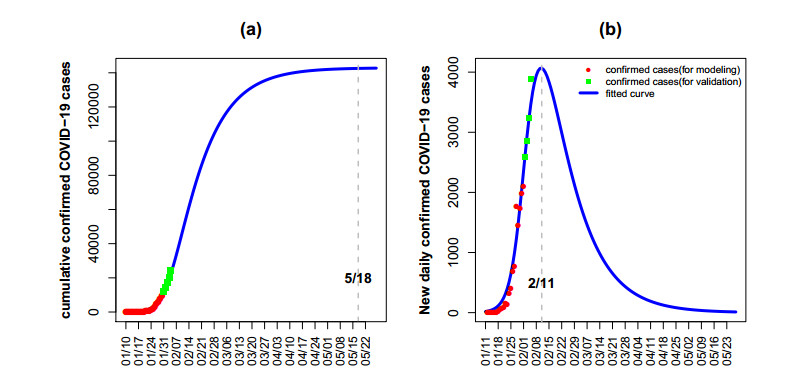
The novel coronavirus disease 2019 (COVID-19) infection broke out in December 2019 in Wuhan, and rapidly overspread 31 provinces in mainland China on 31 January 2020. In the face of the increasing number of daily confirmed infected cases, it has become a common concern and worthy of pondering when the infection will appear the turning points, what is the final size and when the infection would be ultimately controlled. Based on the current control measures, we proposed a dynamical transmission model with contact trace and quarantine and predicted the peak time and final size for daily confirmed infected cases by employing Markov Chain Monte Carlo algorithm. We estimate the basic reproductive number of COVID-19 is 5.78 (95%CI: 5.71–5.89). Under the current intervention before 31 January, the number of daily confirmed infected cases is expected to peak on around 11 February 2020 with the size of 4066 (95%CI: 3898–4472). The infection of COVID-19 might be controlled approximately after 18 May 2020. Reducing contact and increasing trace about the risk population are likely to be the present effective measures.
Citation: Kai Wang, Zhenzhen Lu, Xiaomeng Wang, Hui Li, Huling Li, Dandan Lin, Yongli Cai, Xing Feng, Yateng Song, Zhiwei Feng, Weidong Ji, Xiaoyan Wang, Yi Yin, Lei Wang, Zhihang Peng. Current trends and future prediction of novel coronavirus disease (COVID-19) epidemic in China: a dynamical modeling analysis[J]. Mathematical Biosciences and Engineering, 2020, 17(4): 3052-3061. doi: 10.3934/mbe.2020173
The novel coronavirus disease 2019 (COVID-19) infection broke out in December 2019 in Wuhan, and rapidly overspread 31 provinces in mainland China on 31 January 2020. In the face of the increasing number of daily confirmed infected cases, it has become a common concern and worthy of pondering when the infection will appear the turning points, what is the final size and when the infection would be ultimately controlled. Based on the current control measures, we proposed a dynamical transmission model with contact trace and quarantine and predicted the peak time and final size for daily confirmed infected cases by employing Markov Chain Monte Carlo algorithm. We estimate the basic reproductive number of COVID-19 is 5.78 (95%CI: 5.71–5.89). Under the current intervention before 31 January, the number of daily confirmed infected cases is expected to peak on around 11 February 2020 with the size of 4066 (95%CI: 3898–4472). The infection of COVID-19 might be controlled approximately after 18 May 2020. Reducing contact and increasing trace about the risk population are likely to be the present effective measures.

| [1] | Chinese Center for Disease Control and Prevention, Report about 2019-nCoV, 2020. Available from: http://www.chinacdc.cn/yyrdgz/202001/P020200128523354919292.pdf. |
| [2] |
C. I. Paules, H. D. Marston, A. S. Fauci, Coronavirus infections-more than just the common cold, JAMA., 323 (2020), 707-708. doi: 10.1001/jama.2020.0757

|
| [3] |
J. F. Chan, K. H. Kok, Z. Zhu, H. CHu, K. K. To, S. Yuan, et al., Genomic characterization of the 2019 novel human-pathogenic coronavirus isolated from a patient with atypical pneumonia after visiting Wuhan, Emerg. Microbes Infec., 9 (2020), 221-236. doi: 10.1080/22221751.2020.1719902
|
| [4] |
N. Zhu, D. Y. Zhang, W. L. Wang, X. W. Li, B. Yang, J. Song, et al., A novel coronavirus from patients with pneumonia in China, 2019, N. Engl. J. Med., 382 (2020), 727-733. doi: 10.1056/NEJMoa2001017
|
| [5] |
C. Wang, P. W. Horby, F. G. Hayden, G. Gao, A novel coronavirus outbreak of global health concern, Lancet., 395 (2020), 470-473. doi: 10.1016/S0140-6736(20)30185-9
|
| [6] |
Q. Li, X. H. Guan, P. Wu, X. Wang, L. Zhou, Y. Tong, et al., Early transmission dynamics in Wuhan, China, of novel coronavirus infected pneumonia, N. Engl. J. Med., 382 (2020), 1199-1207. doi: 10.1056/NEJMoa2001316
|
| [7] |
J. F. Chan, S. F. Yuan, K. H. Kok, K. K. To, H. Chu, J. Yang, et al., A familial cluster of pneumonia associated with the 2019 novel coronavirus indicating person-to-person transmission: a study of a family cluster, Lancet., 395 (2020), 514-523. doi: 10.1016/S0140-6736(20)30154-9
|
| [8] |
H. Nishiura, S. M. Jung, N. M. Linton, R. Kinoshita, Y. Yang, K. Hayashi, et al., The Extent of Transmission of Novel Coronavirus in Wuhan, J. Clin. Med., 9 (2020), 330. doi: 10.3390/jcm9020330
|
| [9] | J. T. Wu, K. Leung, G. M. Leung, Nowcasting and forecasting the potential domestic and international spread of the 2019-nCoV outbreak originating in Wuhan, China: a modelling study, Lancet., 395 (2020), 689-697. |
| [10] |
S. Zhao, S. S. Musa, Q. Lin, J. Ran, G. Yang, W. Wang, et al., Estimating the Unreported Number of Novel Coronavirus 2019-nCoV Cases in China in the First Half of January 2020: A Data-Driven Modelling Analysis of the Early Outbreak, J. Clin. Med., 9 (2020), 388. doi: 10.3390/jcm9020388
|
| [11] | Situation report of the pneumonia cases caused by the novel coronavirus, released on January 31, 2020 by the National Health Commission of the People's Republic of China (in Chinese), 2020. Available from: http://www.nhc.gov.cn/xcs/yqtb/202002/84faf71e096446fdb1ae44939ba5c528.shtml. |
| [12] | O. Diekmann, J. A. P. Heesterbeek, J. A. J. Metz, On the definition and the computation of the basic reproduction ratio R0, in models for infectious diseases in heterogeneous populations, J. Math. Biol., 28 (1990), 365-382. |
| [13] |
P. Driessche, J. Watmough, Reproduction numbers and sub-threshold endemic equilibria for compartmental models of disease transmission, Math. Biosci., 180 (2002), 29-48. doi: 10.1016/S0025-5564(02)00108-6
|
| [14] | Central People's Government of the People's Republic of China, Available from: http://www.gov.cn/xinwen/2020-02/01/content$_$5473742.htm. |
| [15] | National Health Commission of the People's Republic of China, Available from: http://www.nhc.gov.cn/xcs/kpzs/202001/a4499dd30c484457b1c05e3590fae794.shtml. |
| [16] |
P. H. Boersch-Supan, S. J. Ryan, L. R. Johnson, deBInfer: Bayesian inference for dynamical models of biological systems in R, Methods Ecol. Evol., 8 (2017), 511-518. doi: 10.1111/2041-210X.12679
|
| [17] |
B. Tang, X. Wang, Q. Li, N. L. Bragazzi, S. Tang, Y. xiao, et al., Estimation of the Transmission Risk of the 2019-nCoV and Its Implication for Public Health Interventions, J. Clin. Med., 9 (2020), 462. doi: 10.3390/jcm9020462
|
Figures(5) / Tables(1)

Kai Wang, Zhenzhen Lu, Xiaomeng Wang, Hui Li, Huling Li, Dandan Lin, Yongli Cai, Xing Feng, Yateng Song, Zhiwei Feng, Weidong Ji, Xiaoyan Wang, Yi Yin, Lei Wang, Zhihang Peng. Current trends and future prediction of novel coronavirus disease (COVID-19) epidemic in China: a dynamical modeling analysis[J]. Mathematical Biosciences and Engineering, 2020, 17(4): 3052-3061. doi: 10.3934/mbe.2020173


 DownLoad: