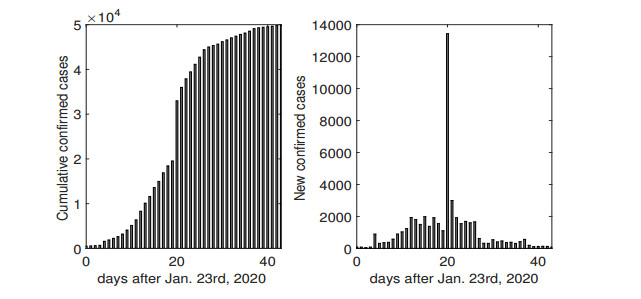
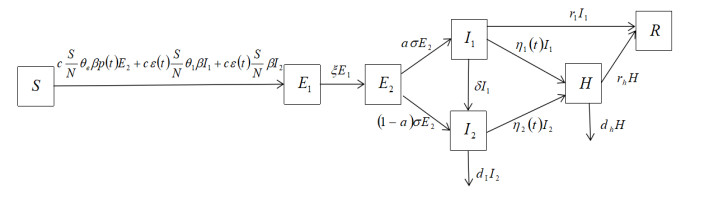
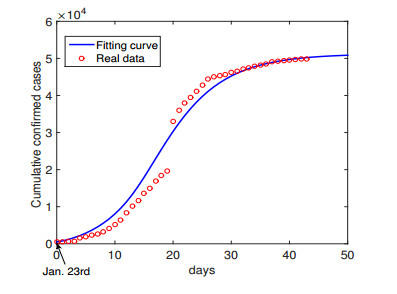
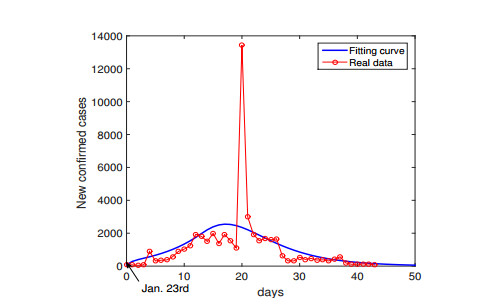
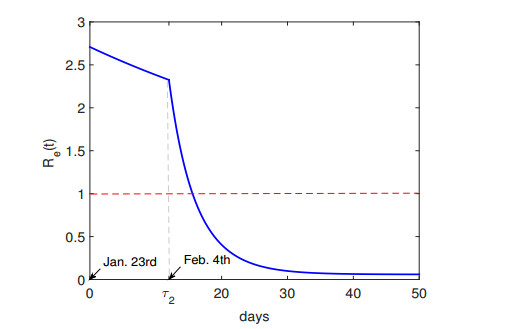
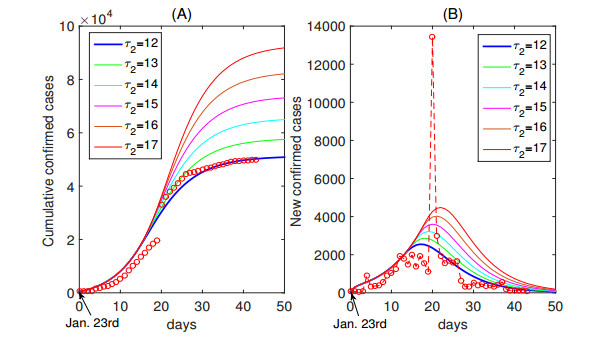
The coronavirus disease 2019 (COVID-2019), a newly emerging disease in China, posed a public health emergency of China. Wuhan is the most serious affected city. Some measures have been taken to control the transmission of COVID-19. From Jan. 23rd, 2020, gradually increasing medical resources (such as health workforce, protective clothing, essential medicines) were sent to Wuhan from other provinces, and the government has established the hospitals to quarantine and treat infected individuals. Under the condition of sufficient medical resources in Wuhan, late-stage of epidemic showed a downward trend. Assessing the effectiveness of medical resources is of great significance for the future response to similar disease. Based on the transmission mechanisms of COVID-19 and epidemic characteristics of Wuhan, by using time-dependent rates for some parameters, we establish a dynamical model to reflect the changes of medical resources on transmission of COVID-19 in Wuhan. Our model is applied to simulate the reported data on cumulative and new confirmed cases in Wuhan from Jan. 23rd to Mar. 6th, 2020. We estimate the basic reproduction number R0 = 2.71, which determines whether the disease will eventually die out or not under the absence of effective control measures. Moreover, we calculate the effective daily reproduction ratio Re(t), which is used to measure the 'daily reproduction number'. We obtain that Re(t) drops less than 1 since Feb. 8th. Our results show that delayed opening the 'Fire God Hill' hospital will greatly increase the magnitude of the outbreak. This shows that the government's timely establishment of hospitals and effective quarantine via quick detection prevent a larger outbreak.
Citation: Liping Wang, Jing Wang, Hongyong Zhao, Yangyang Shi, Kai Wang, Peng Wu, Lei Shi. Modelling and assessing the effects of medical resources on transmission of novel coronavirus (COVID-19) in Wuhan, China[J]. Mathematical Biosciences and Engineering, 2020, 17(4): 2936-2949. doi: 10.3934/mbe.2020165
The coronavirus disease 2019 (COVID-2019), a newly emerging disease in China, posed a public health emergency of China. Wuhan is the most serious affected city. Some measures have been taken to control the transmission of COVID-19. From Jan. 23rd, 2020, gradually increasing medical resources (such as health workforce, protective clothing, essential medicines) were sent to Wuhan from other provinces, and the government has established the hospitals to quarantine and treat infected individuals. Under the condition of sufficient medical resources in Wuhan, late-stage of epidemic showed a downward trend. Assessing the effectiveness of medical resources is of great significance for the future response to similar disease. Based on the transmission mechanisms of COVID-19 and epidemic characteristics of Wuhan, by using time-dependent rates for some parameters, we establish a dynamical model to reflect the changes of medical resources on transmission of COVID-19 in Wuhan. Our model is applied to simulate the reported data on cumulative and new confirmed cases in Wuhan from Jan. 23rd to Mar. 6th, 2020. We estimate the basic reproduction number R0 = 2.71, which determines whether the disease will eventually die out or not under the absence of effective control measures. Moreover, we calculate the effective daily reproduction ratio Re(t), which is used to measure the 'daily reproduction number'. We obtain that Re(t) drops less than 1 since Feb. 8th. Our results show that delayed opening the 'Fire God Hill' hospital will greatly increase the magnitude of the outbreak. This shows that the government's timely establishment of hospitals and effective quarantine via quick detection prevent a larger outbreak.

| [1] |
W. Tan, X. Zhao, X. Ma, W. Wang, P. Niu, W. Xu, et al., A novel coronavirus genome identified in a cluster of pneumonia cases-Wuhan, China 2019-2020, China CDC Weekly, 2 (2020), 61-62. doi: 10.46234/ccdcw2020.017

|
| [2] | E. Martin, Update: 'A bit chaotic.' Christening of new coronavirus and its disease name create confusion. Sciencemag, 2020. Available from: https://www.sciencemag.org/news/2020/02/bit-chaotic-christening-new-coronavirus-and-its-disease-name-create-confusion. |
| [3] | World Health Organization, Novel Coronavirus, 2020. Available from: https://www.who.int/new-sroom/detail/30-01-2020-statement-on-the-second-meeting-of-the-international-health-regulations-(2005)-emergency-committee-regarding-the-outbreak-of-novel-coronavirus-(2019-ncov). |
| [4] | T. Chen, J. Rui, Q. Wang, Z. Zhao, J. A. Cui, L. Yin, A mathematical model for simulating the transmission of Wuhan novel Coronavirus, bioRxiv, (2020). |
| [5] |
B. Tang, X. Wang, Q. Li, N. L. Bragazzi, S. Tang, Y. Xiao, et al., Estimation of the transmission risk of the 2019-nCoV and its implication for public health interventions, J. Clin. Med., 9 (2020), 462. doi: 10.3390/jcm9020462
|
| [6] | P. Shao, Y. Shan, Beware of asymptomatic transmission: Study on 2019-nCoV prevention and control measures based on extended SEIR model, bioRxiv, (2020). |
| [7] | M. Shen, Z. Peng, Y. Xiao, L. Zhang, Modelling the epidemic trend of the 2019 novel coronavirus outbreak in China, bioRxiv, (2020). |
| [8] | S. Funk, R. M. Eggo, Early dynamics of transmission and control of 2019-nCoV: a mathematical modelling study, medRxiv, (2020). |
| [9] | B. J. Quilty, S. Clifford, Effectiveness of airport screening at detecting travellers infected with novel coronavirus (2019-nCoV), Euro. Surveill., 25 (2020). |
| [10] |
B. Tang, N. L. Bragazzi, Q. Li, S. Tang, Y. Xiao, J. Wu, An updated estimation of the risk of transmission of the novel coronavirus (2019-nCov), Infect. Disease Model., 5 (2020), 248-255. doi: 10.1016/j.idm.2020.02.001
|
| [11] | M. Shen, Z. Peng, Y. Xiao, L. Zhang, Modelling the epidemic trend of the 2019 novel coronavirus outbreak in China, bioRxiv, (2020). |
| [12] | W. Ming, J. Huang, C. J. Zhang, Breaking down of healthcare system: Mathematical modelling for controlling the novel coronavirus (2019-nCoV) outbreak in Wuhan, China, bioRxiv, (2020). |
| [13] | National Health Commission of the People's Republic of China. Update on pneumonia in new coronavirus, 2020. Available from: http://www.nhc.gov.cn/xcs/xxgzbd/gzbd index.shtml. |
| [14] | Health Commission of Hubei Province. Update on pneumonia in new coronavirus, 2020. Available from: http://wjw.hubei.gov.cn/fbjd/tzgg/. |
| [15] | O. Diekmann, J. A. P. Heesterbeek, J. A. Metz, On the definition and the computation of the basic reproduction ratio R0 in models for infectious diseases in heterogeneous populations, J. Math. Biol., 28 (1990), 365-382. |
| [16] |
P. Van den Driessche, J. Watmough, Reproduction numbers and sub-threshold endemic equilibria for compartmental models of disease transmission, Math. Biosci., 180 (2002), 29-48. doi: 10.1016/S0025-5564(02)00108-6
|
| [17] | Q. Li, X. Guan, P. Wu, X. Wang, L. Zhou, Y. Tong, et al., Early transmission dynamics in Wuhan, China, of novel coronavirus-infected pneumonia, N. Engl. J. Med., (2020). |
| [18] |
S. Zhao, S. S. Musa, Q. Lin, J. Ran, G. Yang, W. Wang, et al., Estimating the unreported number of novel coronavirus (2019-nCoV) cases in China in the first half of January 2020: A data-driven modelling analysis of the early outbreak, J. Clin. Med., 9 (2020), 388. doi: 10.3390/jcm9020388
|
| [19] |
S. Zhao, Q. Lin, J. Ran, S. S. Musa, G. Yang, W. Wang, et al., Preliminary estimation of the basic reproduction number of novel coronavirus (2019-nCoV) in China, from 2019 to 2020: A data-driven analysis in the early phase of the outbreak, Int. J. Infect. Dis., 92 (2020), 214-217. doi: 10.1016/j.ijid.2020.01.050
|
Figures(9) / Tables(1)

Liping Wang, Jing Wang, Hongyong Zhao, Yangyang Shi, Kai Wang, Peng Wu, Lei Shi. Modelling and assessing the effects of medical resources on transmission of novel coronavirus (COVID-19) in Wuhan, China[J]. Mathematical Biosciences and Engineering, 2020, 17(4): 2936-2949. doi: 10.3934/mbe.2020165


 DownLoad: