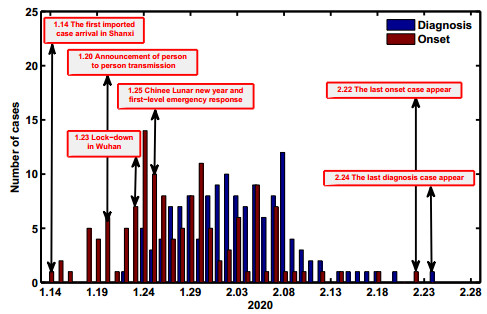
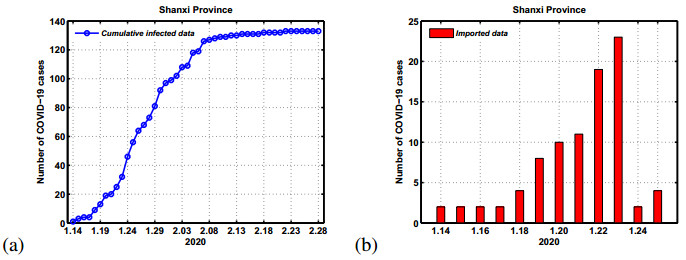
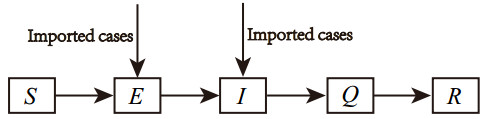
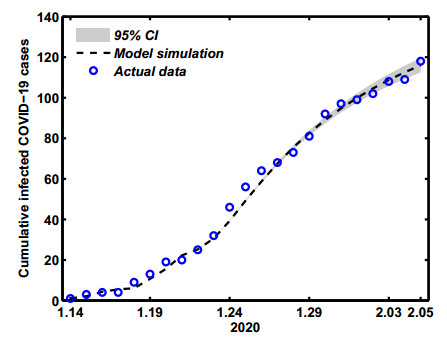
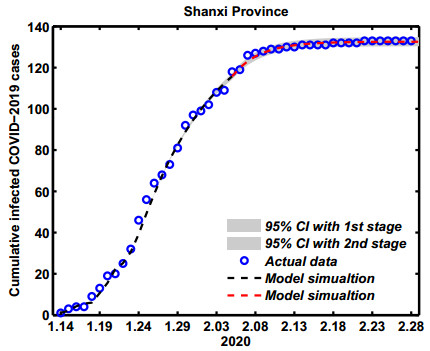
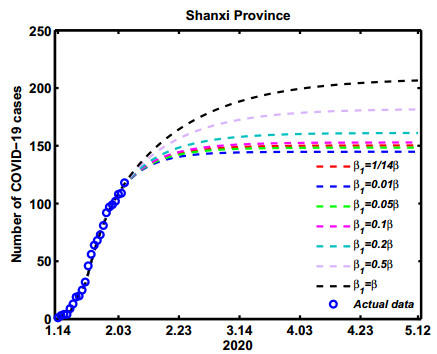
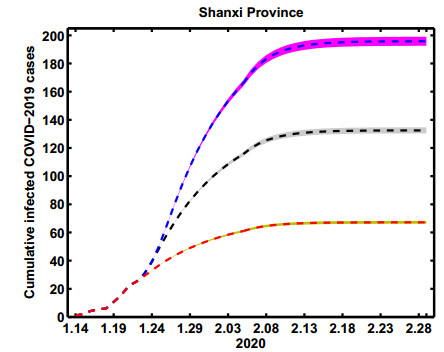
Since December 2019, an outbreak of a novel coronavirus pneumonia (WHO named COVID-19) swept across China. In Shanxi Province, the cumulative confirmed cases finally reached 133 since the first confirmed case appeared on January 22 2020, and most of which were imported cases from Hubei Province. Reasons for this ongoing surge in Shanxi province, both imported and autochthonous infected cases, are currently unclear and demand urgent investigation. In this paper, we developed a SEIQR difference-equation model of COVID-19 that took into account the transmission with discrete time imported cases, to perform assessment and risk analysis. Our findings suggest that if the lock-down date in Wuhan is earlier, the infectious cases are fewer. Moreover, we reveal the effects of city lock-down date on the final scale of cases: if the date is advanced two days, the cases may decrease one half (67, 95% CI: 66–68); if the date is delayed for two days, the cases may reach about 196 (95% CI: 193–199). Our investigation model could be potentially helpful to study the transmission of COVID-19, in other provinces of China except Hubei. Especially, the method may also be used in countries with the first confirmed case is imported.
Citation: Ming-Tao Li, Gui-Quan Sun, Juan Zhang, Yu Zhao, Xin Pei, Li Li, Yong Wang, Wen-Yi Zhang, Zi-Ke Zhang, Zhen Jin. Analysis of COVID-19 transmission in Shanxi Province with discrete time imported cases[J]. Mathematical Biosciences and Engineering, 2020, 17(4): 3710-3720. doi: 10.3934/mbe.2020208
Since December 2019, an outbreak of a novel coronavirus pneumonia (WHO named COVID-19) swept across China. In Shanxi Province, the cumulative confirmed cases finally reached 133 since the first confirmed case appeared on January 22 2020, and most of which were imported cases from Hubei Province. Reasons for this ongoing surge in Shanxi province, both imported and autochthonous infected cases, are currently unclear and demand urgent investigation. In this paper, we developed a SEIQR difference-equation model of COVID-19 that took into account the transmission with discrete time imported cases, to perform assessment and risk analysis. Our findings suggest that if the lock-down date in Wuhan is earlier, the infectious cases are fewer. Moreover, we reveal the effects of city lock-down date on the final scale of cases: if the date is advanced two days, the cases may decrease one half (67, 95% CI: 66–68); if the date is delayed for two days, the cases may reach about 196 (95% CI: 193–199). Our investigation model could be potentially helpful to study the transmission of COVID-19, in other provinces of China except Hubei. Especially, the method may also be used in countries with the first confirmed case is imported.

| [1] |
Q. Li, X. Guan, P. Wu, X. Wang, L. Zhou, Y. Tong, et al., Early Transmission Dynamics in Wuhan, China, of Novel Coronavirus-Infected Pneumonia, N. Engl. J. Med., 382 (2020), 1199-1207. doi: 10.1056/NEJMoa2001316

|
| [2] | A. Pan, L. Liu, C. Wang, H. Guo, X. Hao, Q. Wang, et al., Association of Public Health Interventions With the Epidemiology of the COVID-19 Outbreak inWuhan, China, JAMA-J Am. Med. Assoc., (2020), e206130. |
| [3] |
M. Chinazzi, J. T. Davis, M. Ajelli, C. Gioannini, M. Litvinova, S. Merler, et al., The effect of travel restrictions on the spread of the 2019 novel coronavirus (2019-nCoV) outbreak, Science, 368 (2020), 395-400. doi: 10.1126/science.aba9757
|
| [4] | J. Zhang, G. Q. Sun, M. T. Li, W. Zhang, L. Chang, Z. Jia, et al., 2019 coronavirus disease (COVID-19) propagation prediction and assessment method with imported cases and generations: Shanxi province as a case, (2020), Submitted. |
| [5] | Health Commission of Shanxi province. Available from: http://wjw.shanxi.gov.cn/ |
| [6] | B. Tang, X. Wang, Q. Li, N. L. Bragazzi, S. Y. Tang, Y. N. Xiao, et al., Estimation of the transmission risk of the 2019-nCoV and its implication for public health interventions, J. Clin. Med., 9 (2020), 462. |
| [7] | B. Tang, F. Xia, S. Tang, N. L. Bragazzi, Q. Li, X. Sun, et al., The Evolution of Quarantined and Suspected Cases Determines the Final Trend of the 2019-nCoV Epidemics Based on Multi-Source Data Analyses, Available at SSRN 3537099, 2020. |
| [8] | L. Danon, E. Brooks-Pollock, M. Bailey, M. J. Keeling, A spatial model of CoVID-19 transmission in England and Wales: early spread and peak timing, medRxiv, (2020). |
| [9] |
J. T. Wu, K. Leung, G. M. Leung, Nowcasting and forecasting the potential domestic and international spread of the 2019-nCoV outbreak originating in Wuhan, China: a modelling study, Lancet, 395 (2020), 689-697. doi: 10.1016/S0140-6736(20)30260-9
|
| [10] |
Z. Du, L. Wang, S. Cauchemez, X. Xu, X. Wang, B. J. Cowling, et al., Risk for transportation of 2019 novel coronavirus disease from Wuhan to other cities in China, Emerg. Infect. Dis., 26 (2020), 1049-1052. doi: 10.3201/eid2605.200146
|
| [11] | Z. F. Yang, Z. Q. Zeng, K. Wang, S. S. Wong, W. Liang, M. Zanin, et al., Modified SEIR and AI prediction of the epidemics trend of COVID-19 in China under public health interventions, J. Thorac. Dis., 12 (2020), 165-174. |
| [12] |
T. M. Chen, J. Rui, Q. P. Wang, Z. Y. Zhao, J. A. Cui, L. Yin, A mathematical model for simulating the phase-based transmissibility of a novel coronavirus, Infect. Dis. Poverty., 9 (2020), 1-8. doi: 10.1186/s40249-019-0617-6
|
| [13] | S. Zhao, S. Musa, Q. Lin, J. Ran, G. Yang, W. Wang, et al., Estimating the unreported number of novel coronavirus (2019-nCoV) vases in China in the first half of January 2020: a data-driven modelling analysis of the early outbreak, J. Clin. Med., 9 (2020), 388. |
| [14] | M. T. Li, G. Q. Sun, J. Zhang, Z. Jin, Transmission dynamics of a multi-group brucellosis model with mixed cross infection in public farm, Appl. Math. Comput., 237 (2014), 582-594. |
| [15] |
M. T. Li, Z. Jin, G. Q. Sun, J. Zhang, Modeling direct and indirect disease transmission using multi-group model, J. Math. Anal. Appl., 446 (2017), 1292-1309. doi: 10.1016/j.jmaa.2016.09.043
|
| [16] | J. Geweke, Evaluating the accuracy of sampling-based approaches to the calculation of posterior moments. In: J.M. Bernardo, J. Berger, A.P. Dawid, A.F.M. Smith (Eds.), Bayesian Statistics, Oxford University Press, Oxford, 4 (1992), 169-193. |
| [17] | China population & employment statistics yearbook. Beijing: China Statistics Press, (2019). |
| [18] | H. Haario, M. Laine, A. Mira, E. Saksman, Dram: Efficient adaptive mcmc, Stat. Comput., 16 (2006), 339-354. |
| [19] | D. Gamerman, H. F. Lopes, Markov chain monto carlo: stochastic simulation for bayesian inference, 2nd ed. Taylor and Francis Group, London New York, 2006. |
Figures(8) / Tables(3)

Ming-Tao Li, Gui-Quan Sun, Juan Zhang, Yu Zhao, Xin Pei, Li Li, Yong Wang, Wen-Yi Zhang, Zi-Ke Zhang, Zhen Jin. Analysis of COVID-19 transmission in Shanxi Province with discrete time imported cases[J]. Mathematical Biosciences and Engineering, 2020, 17(4): 3710-3720. doi: 10.3934/mbe.2020208


 DownLoad: