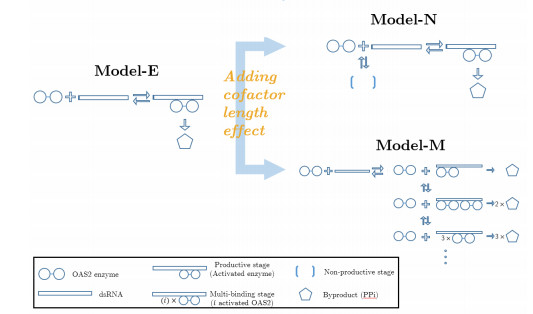
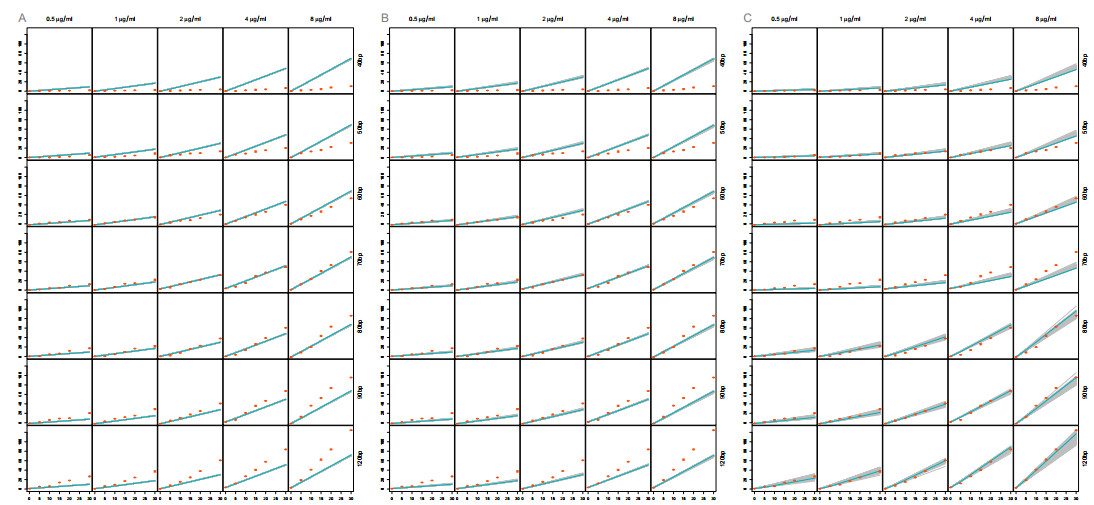
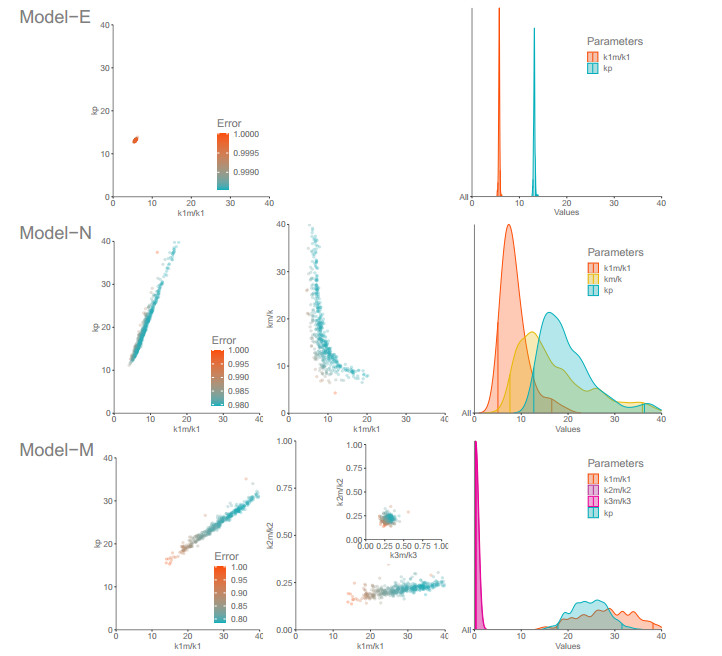
The activation of 2'-5'-oligoadenylate synthetase (OAS) enzymes by direct interaction with viral double-stranded RNA (dsRNA) is a key part of the innate immune response to viral infection. A downstream effect of the OAS-dsRNA interaction is to degrade the single-stranded RNA to prevent the spread of the virus. The activation of OAS2, one of the members of the OAS family, depends on dsRNA length. Combining in vitro experiments and mathematical modelling, we test different hypotheses for the OAS2 activation mechanisms by its cofactor dsRNA. After model calibration and selection, the cooperative binding of multiple OAS2 to a single dsRNA is shown to best represent the effect of its cofactor length on enzyme activity.
Citation: Deokro Lee, Amit Koul, Nikhat Lubna, Sean A. McKenna, Stéphanie Portet. Mathematical modelling of OAS2 activation by dsRNA and effects of dsRNA lengths[J]. AIMS Mathematics, 2021, 6(6): 5924-5941. doi: 10.3934/math.2021351
The activation of 2'-5'-oligoadenylate synthetase (OAS) enzymes by direct interaction with viral double-stranded RNA (dsRNA) is a key part of the innate immune response to viral infection. A downstream effect of the OAS-dsRNA interaction is to degrade the single-stranded RNA to prevent the spread of the virus. The activation of OAS2, one of the members of the OAS family, depends on dsRNA length. Combining in vitro experiments and mathematical modelling, we test different hypotheses for the OAS2 activation mechanisms by its cofactor dsRNA. After model calibration and selection, the cooperative binding of multiple OAS2 to a single dsRNA is shown to best represent the effect of its cofactor length on enzyme activity.

| [1] |
A. Karpala, T. Doran, B. Andrew, Immune responses to dsrna: implications for gene silencing technologies, Immunol. Cell Biol., 83 (2005), 211–216. doi: 10.1111/j.1440-1711.2005.01331.x

|
| [2] |
C. E. Samuel, Antiviral actions of interferons, Clin. Microbiol. Rev., 14 (2001), 778–809. doi: 10.1128/CMR.14.4.778-809.2001
|
| [3] |
B. Dauber, G. Heins, T. Wolff, The influenza b virus nonstructural ns1 protein is essential for efficient viral growth and antagonizes beta interferon induction, J. Virol., 78 (2004), 1865–1872. doi: 10.1128/JVI.78.4.1865-1872.2004
|
| [4] |
A. G. Hovanessian, J. Justesen, The human 2'-5'oligoadenylate synthetase family: unique interferon-inducible enzymes catalyzing 2'-5' instead of 3'-5' phosphodiester bond formation, Biochimie, 89 (2007), 779–788. doi: 10.1016/j.biochi.2007.02.003
|
| [5] |
J. Donovan, M. Dufner, A. Korennykh, Structural basis for cytosolic double-stranded rna surveillance by human oligoadenylate synthetase 1, P. Natl. Acad. Sci. USA, 110 (2013), 1652–1657. doi: 10.1073/pnas.1218528110
|
| [6] |
A. Koul, S. Deo, E. P. Booy, G. Orriss, M. Genung, S. A. McKenna, Impact of double-stranded RNA characteristics on the activation of human 2'-5'-oligoadenylate synthetase 2 (OAS2), Biochem. Cell Biol., 98 (2020), 70–82. doi: 10.1139/bcb-2019-0060
|
| [7] |
J. Donovan, G. Whitney, S. Rath, A. Korennykh, Structural mechanism of sensing long dsrna via a noncatalytic domain in human oligoadenylate synthetase 3, P. Natl. Acad. Sci. USA, 112 (2015), 3949–3954. doi: 10.1073/pnas.1419409112
|
| [8] |
A. Koul, D. Gemmill, N. Lubna, M. Meier, N. Krahn, E. P. Booy, et al. Structural and hydrodynamic characterization of dimeric human oligoadenylate synthetase 2, Biophys. J., 118 (2020), 2726–2740. doi: 10.1016/j.bpj.2020.04.025
|
| [9] |
J. G. Olsen, K. Teilum, B. B. Kragelund, Behaviour of intrinsically disordered proteins in protein-protein complexes with an emphasis on fuzziness, Cell. Mol. Life Sci., 74 (2017), 3175–3183. doi: 10.1007/s00018-017-2560-7
|
| [10] | D. Lee, Mathematical modelling of oas2 activation by dsrna and effects of dsrna lengths, Master's thesis, University of Manitoba, Winnipeg, Manitoba, Canada, 2020. |
| [11] |
C. M. Hurvich, C.-L. Tsai, Regression and time series model selection in small samples, Biometrika, 76 (1989), 297–307. doi: 10.1093/biomet/76.2.297
|
| [12] |
N. Sugiura, Further analysis of the data by Akaike's Information Criterion and the finite corrections, Commun. Stat.-Theor. M., 7 (1978), 13–26. doi: 10.1080/03610927808827599
|
| [13] | L. Scrucca, GA: A package for genetic algorithms in R, J. Stat. Softw., 53 (2013), 1–37. |
| [14] |
L. Scrucca, On some extensions to GA package: hybrid optimisation, parallelisation and islands evolution, The R Journal, 9 (2017), 187–206. doi: 10.32614/RJ-2017-008
|
| [15] |
S. Portet, A primer on model selection using the Akaike information criterion, Infectious Disease Modelling, 5 (2020), 111–128. doi: 10.1016/j.idm.2019.12.010
|
| [16] | K. P. Burnham, D. R. Anderson, Model selection and multimodel inference: a practical information-theoretic approach, Springer, second edition, 2002. |
| [17] |
S. Portet, A. Madzvamuse, A. Chung, R. E. Leube, R. Windoffer, Keratin dynamics: modeling the interplay between turnover and transport, PLOS ONE, 10 (2015), e0121090. doi: 10.1371/journal.pone.0116884
|
| [18] | M. Jacquier, S. Kuriakose, A. Bhardwaj, Y. Zhang, A. Shrivastav, S. Portet, et al. Investigation of novel regulation of n-myristoyltransferase by mammalian target of rapamycin in breast cancer cells, Scientific Reports, 8 (2018), 1–11. |
| [19] |
J. Goyette, C. S. Salas, N. Coker-Gordon, M. Bridge, S. A. Isaacson, J. Allard, et al. Biophysical assay for tethered signaling reactions reveals tether-controlled activity for the phosphatase SHP-1, Sci. Adv., 3 (2017), e1601692. doi: 10.1126/sciadv.1601692
|
| [20] |
S. Portet, Dynamics of in vitro intermediate filament length distributions, J. Theor. Biol., 332 (2013), 20–29. doi: 10.1016/j.jtbi.2013.04.004
|
Figures(6) / Tables(2)

Deokro Lee, Amit Koul, Nikhat Lubna, Sean A. McKenna, Stéphanie Portet. Mathematical modelling of OAS2 activation by dsRNA and effects of dsRNA lengths[J]. AIMS Mathematics, 2021, 6(6): 5924-5941. doi: 10.3934/math.2021351


 DownLoad: