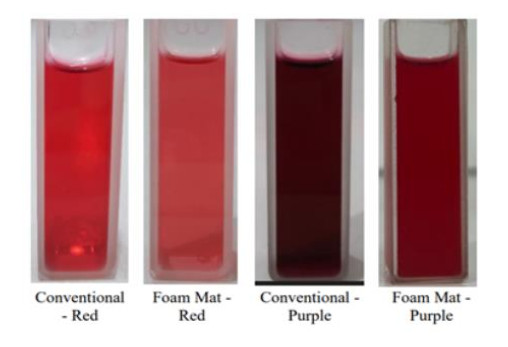
This study evaluated the color stability, bioactive compounds, and antioxidant activity of roselle calyx powders dissolved at different pHs. The results showed that purple roselle calyx powders revealed better color than red roselle, and foam-mat dried powders were better than the conventionally dried powder. The best solution without pH adjustment was found in foam-mat dried purple calyces. pH values significantly affected color stability and quality, bioactive compounds, and antioxidant activity of roselle powder solutions. The lightness, redness, and yellowness of the solutions at different pH values ranged from 27.00 to 74.45, from 0.70 to 52.20, and from 3.9 to 47.50, respectively. The non-adjusted pH solution had a lightness of 33.80–49.05, redness of 19.15–42.45, and yellowness of 7.10–18.35. The color quality, indicated by color intensity at different pHs, ranged from 0.03 to 15.24; the non-adjusted pH solution had a color intensity of 1.37–33.48, revealing that pH decreased color quality. Retention of phenolics and flavonoids was 8.02%–99.69% and 0.00%–81.05%, respectively, indicating the instability of bioactive compounds. Roselle antioxidant activity was observed at different pHs, ranging from 0.00 to 1.11 mg Trolox equivalent (TE)/g for DPPH (2, 2-diphenyl-1-picrylhydrazyl) scavenging activity and 0.46–104.16 mg TE/g for the ABTS [2, 2'-azino-bis(3-ethylbenzothiazoline-6-sulfonic acid)] assay. Acidic pHs preserved better all dependent parameters. In practice, the pH value should be considered when using roselle calyx powders in food products. This study used a solution as a model for a watery food system. Suitable products to use roselle calyx powders are water-based products with an acidic pH, such as syrups, yogurts and yogurt-based products, fermented milk, and sour-taste beverages. Roselle calyx powders are suitable to use as coloring agents or as bioactive compounds to provide healthy functional properties. The use of foam-mat dried powders is suggested due to the better antioxidant activity and color preservation than conventionally dried powder.
Citation: Teti Estiasih, Jatmiko Eko Witoyo, Khofifah Putri Wulandari, Fadhillah Dwi Juniati, Widiastuti Setyaningsih, Hanifah Nuryani Lioe, Miguel Palma, Kgs Ahmadi, Hamidie Ronald Daniel Ray, Elya Mufidah. Stability comparison of conventional and foam-mat red and purple dried roselle calyces powder as a function of pH[J]. AIMS Agriculture and Food, 2025, 10(1): 177-198. doi: 10.3934/agrfood.2025010
This study evaluated the color stability, bioactive compounds, and antioxidant activity of roselle calyx powders dissolved at different pHs. The results showed that purple roselle calyx powders revealed better color than red roselle, and foam-mat dried powders were better than the conventionally dried powder. The best solution without pH adjustment was found in foam-mat dried purple calyces. pH values significantly affected color stability and quality, bioactive compounds, and antioxidant activity of roselle powder solutions. The lightness, redness, and yellowness of the solutions at different pH values ranged from 27.00 to 74.45, from 0.70 to 52.20, and from 3.9 to 47.50, respectively. The non-adjusted pH solution had a lightness of 33.80–49.05, redness of 19.15–42.45, and yellowness of 7.10–18.35. The color quality, indicated by color intensity at different pHs, ranged from 0.03 to 15.24; the non-adjusted pH solution had a color intensity of 1.37–33.48, revealing that pH decreased color quality. Retention of phenolics and flavonoids was 8.02%–99.69% and 0.00%–81.05%, respectively, indicating the instability of bioactive compounds. Roselle antioxidant activity was observed at different pHs, ranging from 0.00 to 1.11 mg Trolox equivalent (TE)/g for DPPH (2, 2-diphenyl-1-picrylhydrazyl) scavenging activity and 0.46–104.16 mg TE/g for the ABTS [2, 2'-azino-bis(3-ethylbenzothiazoline-6-sulfonic acid)] assay. Acidic pHs preserved better all dependent parameters. In practice, the pH value should be considered when using roselle calyx powders in food products. This study used a solution as a model for a watery food system. Suitable products to use roselle calyx powders are water-based products with an acidic pH, such as syrups, yogurts and yogurt-based products, fermented milk, and sour-taste beverages. Roselle calyx powders are suitable to use as coloring agents or as bioactive compounds to provide healthy functional properties. The use of foam-mat dried powders is suggested due to the better antioxidant activity and color preservation than conventionally dried powder.

| [1] | El Bayani GF, Marpaung NLE, Simorangkir DAS, et al. (2018) Anti-inflammatory effects of Hibiscus sabdariffa Linn. on the IL-1β/IL-1ra ratio in plasma and hippocampus of overtrained rats and correlation with spatial memory. Kobe J Med Sci 64: E73–E83. |
| [2] |
Izquierdo-Vega JA, Arteaga-Badillo DA, Sánchez-Gutiérrez M, et al.(2020) Organic acids from Roselle (Hibiscus sabdariffa L.)-A brief review of its pharmacological effects. Biomedicines 8: 1–16. https://doi.org/10.3390/biomedicines8050100 doi: 10.3390/biomedicines8050100

|
| [3] |
Sapian S, Ibrahim Mze AA, Jubaidi FF, et al. (2023) Therapeutic Potential of Hibiscus sabdariffa Linn. in attenuating cardiovascular risk factors. Pharmaceuticals 16: 1–25. https://doi.org/10.3390/ph16060807 doi: 10.3390/ph16060807
|
| [4] | Islam A, Jamini TS, Islam M, et al. (2016) Roselle: A functional food with high nutritional and medicinal values. Fundam Appl Agric 1: 44–49. |
| [5] |
Tan SL, Sulaiman R (2020) Color and rehydration characteristics of natural red colorant of foam-mat dried Hibiscus sabdariffa L. powder. Int J Fruit Sci 20: 89–105. https://doi.org/10.1080/15538362.2019.1605557 doi: 10.1080/15538362.2019.1605557
|
| [6] |
Hamrouni-Sellami I, Rahali FZ, Rebey IB, et al. (2013) Total phenolics, flavonoids, and antioxidant activity of sage (Salvia officinalis L.) plants as affected by different drying methods. Food Bioprocess Technol 6: 806–817. https://doi.org/10.1007/s11947-012-0877-7 doi: 10.1007/s11947-012-0877-7
|
| [7] |
Roshanak S, Rahimmalek M, Goli SAH (2016) Evaluation of seven different drying treatments in respect to total flavonoid, phenolic, vitamin C content, chlorophyll, antioxidant activity and color of green tea (Camellia sinensis or C. assamica) leaves. J Food Sci Technol 53: 721–729. https://doi.org/10.1007/s13197-015-2030-x doi: 10.1007/s13197-015-2030-x
|
| [8] |
Tajudin NHA, Tasirin SM, Ang WL, et al. (2019) Comparison of drying kinetics and product quality from convective heat pump and solar drying of Roselle calyx. Food Bioprod Process 118: 40–49. https://doi.org/10.1016/j.fbp.2019.08.012 doi: 10.1016/j.fbp.2019.08.012
|
| [9] |
Djaeni M, Kumoro AC, Sasongko SB, et al. (2018) Drying rate and product quality evaluation of roselle (Hibiscus sabdariffa L.) calyces extract dried with foaming agent under different temperatures. Int J Food Sci 2018: 9243549. https://doi.org/10.1155/2018/9243549 doi: 10.1155/2018/9243549
|
| [10] |
Liu Y, Liu Y, Tao C, et al. (2018) Effect of temperature and pH on stability of anthocyanin obtained from blueberry. J Food Meas Charact 12: 1744–1753. https://doi.org/10.1007/s11694-018-9789-1 doi: 10.1007/s11694-018-9789-1
|
| [11] |
Sasongko SB, Djaeni M, Utari FD (2019) Kinetic of anthocyanin degradation in roselle extract dried with foaming agent at different temperatures. Bull Chem React Eng Catal 14: 320–325. https://doi.org/10.9767/bcrec.14.2.2875.320-325 doi: 10.9767/bcrec.14.2.2875.320-325
|
| [12] |
Wu HY, Yang KM, Chiang PY (2018) Roselle anthocyanins: antioxidant properties and stability to heat and pH. Molecules 23: 1357. https://doi.org/10.3390/molecules23061357 doi: 10.3390/molecules23061357
|
| [13] |
Estiasih T, Witoyo JE, Runtung GKM, et al. (2024) The characteristics of foam-mat dried red and purple roselle calyces powder prepared with commercial emulsifiers as the foaming agents. CYTA-J Food 22: 2356847. https://doi.org/10.1080/19476337.2024.2356847 doi: 10.1080/19476337.2024.2356847
|
| [14] |
Enaru B, Drețcanu G, Pop TD, et al. (2021) Anthocyanins: Factors affecting their stability and degradation. Antioxidants 10: 1967. https://doi.org/10.3390/antiox10121967 doi: 10.3390/antiox10121967
|
| [15] |
Friedman M, Jürgens HS (2000) Effect of pH on the stability of plant phenolic compounds. J Agric Food Chem 48: 2101–2110. https://doi.org/10.1021/jf990489j doi: 10.1021/jf990489j
|
| [16] |
Mattioli R, Francioso A, Mosca L, et al. (2020) Anthocyanins: A comprehensive review of their chemical properties and health effects on cardiovascular and neurodegenerative diseases. Molecules 25: 3809. https://doi.org/10.3390/molecules25173809. doi: 10.3390/molecules25173809
|
| [17] |
Maisto M, Marzocchi A, Ciampaglia R, et al. (2024) Effects of food-derived antioxidant compounds on in vitro heavy metal intestinal bioaccessibility. Antioxidants 13: 610. https://doi.org/10.3390/antiox13050610 doi: 10.3390/antiox13050610
|
| [18] |
Shruthi VH, Ramachandra CT, Nidoni U, et al. (2017). Physico-chemical, nutritional and functional properties of roselle (Hibiscus sabdariffa L.). Int J Curr Microbiol Appl Sci 6: 1–7. https://doi.org/10.20546/ijcmas.2017.612.347 doi: 10.20546/ijcmas.2017.612.347
|
| [19] |
Rocha IDC, Bonnlaender B, Sievers H, et al. (2014). Hibiscus sabdariffa L.—A phytochemical and pharmacological review. Food Chem 165: 424–443. https://doi.org/10.1016/j.foodchem.2014.05.002. doi: 10.1016/j.foodchem.2014.05.002
|
| [20] |
Marpaung AM, Paramaputri A (2023) UV-visible light spectra of Clitoria ternatea L. flower extract during aqueous extraction and storage. Int Food Res J. 30: 764–773. https://doi.org/10.47836/ifrj.30.3.18 doi: 10.47836/ifrj.30.3.18
|
| [21] |
Samadi S, Fard FR (2020) Phytochemical properties, antioxidant activity and mineral content (Fe, Zn and Cu) in Iranian produced black tea, green tea and roselle calyces. Biocatal Agric Biotechnol 23: 101472. https://doi.org/10.1016/j.bcab.2019.101472 doi: 10.1016/j.bcab.2019.101472
|
| [22] |
Huang J, Hu Z, Chin Y, et al. (2023) Improved thermal stability of roselle anthocyanin by co-pigmented with oxalic acid: preparation, characterization and enhancement mechanism. Food Chem 410: 135407. https://doi.org/10.1016/j.foodchem.2023.135407 doi: 10.1016/j.foodchem.2023.135407
|
| [23] |
Ifie I, Marshall LJ, Ho P, et al. (2016) Hibiscus sabdariffa (Roselle) extracts and wine: phytochemical profile, physicochemical properties, and carbohydrase inhibition. J Agric Food Chem 64: 4921–4931. https://doi.org/10.1021/acs.jafc.6b01246. doi: 10.1021/acs.jafc.6b01246
|
| [24] |
Baliyan S, Mukherjee R, Priyadarshini A, et al. (2022) Determination of antioxidants by DPPH radical scavenging activity and quantitative phytochemical analysis of Ficus religiosa. Molecules 27: 1326. https://doi.org/10.3390/molecules27041326 doi: 10.3390/molecules27041326
|
| [25] |
Thaipong K, Boonprakob U, Crosby K, et al. (2006) Comparison of ABTS, DPPH, FRAP, and ORAC Assays for estimating antioxidant activity from guava fruit extracts. J Food Anal 19: 669–675. https://doi.org/10.1016/j.jfca.2006.01.003 doi: 10.1016/j.jfca.2006.01.003
|
| [26] | Shruthi VH, Ramachandra CT (2019) Roselle (Hibiscus sabdariffa L.) calyces: A potential source of natural colour and its health benefits. In: Deka SC, Seth D, Hulle VRS (Eds.), Food bioactive: Functionalities and applications in human health, New York: Apple Academic Press, 169–190. https://doi.org/10.1201/9780429242793 |
| [27] |
Song W, Yuan Q, Xie Y, et al. (2024) Formulation and characterization of nanocapsules loaded with roselle anthocyanins extract and enhancement of anthocyanins bioaccessibility. Food Chem 459: 140446. https://doi.org/10.1016/j.foodchem.2024.140446 doi: 10.1016/j.foodchem.2024.140446
|
| [28] |
Yang D, Xu HX, Guo YX, et al. (2023) Chemical profile of roselle extract and its inhibitory activities on three digestive enzymes in vitro and in vivo. Int J Biol Macromol 253: 126902. https://doi.org/10.1016/j.ijbiomac.2023.126902 doi: 10.1016/j.ijbiomac.2023.126902
|
| [29] |
Khoo HE, Azlan A, Tang ST, et al. (2017) Anthocyanidins and anthocyanins: Colored pigments as food, pharmaceutical ingredients, and the potential health benefits. Food Nutr Res 61: 1361779. https://doi.org/10.1080/16546628.2017.1361779 doi: 10.1080/16546628.2017.1361779
|
| [30] | Aishah B, Nursabrina M, Noriham A, et al. (2013), Anthocyanins from Hibiscus sabdariffa, Melastoma malabathricum and Ipomoea batatas and its color properties. Int Food Res J 20: 827–834. |
| [31] | Marpaung A, Tjahjadi K (2019) The analysis of monomeric anthocyanin by pH differential method is not appropriate for certain anthocyanins. In: Proceedings of the 16th ASEAN Food Conference (16th AFC 2019)—Outlook and Opportunities of Food Technology and Culinary for Tourism Industry, 26–30. https://doi.org/10.5220/0009985400002964 |
| [32] |
Dorris MR, Voss DM, Bollom MA, et al. (2018) Browning index of anthocyanin‐rich fruit juice depends on pH and anthocyanin loss more than the gain of soluble polymeric pigments. J Food Sci 83: 911–921. https://doi.org/10.1111/1750-3841.14106 doi: 10.1111/1750-3841.14106
|
| [33] |
Gao Q, Li Y, Li Y, et al. (2022) Antioxidant and prooxidant activities of phenolic acids commonly existed in vegetables and their relationship with structures. Food Sci Technol 42: e07622. https://doi.org/10.1590/fst.07622 doi: 10.1590/fst.07622
|
| [34] |
Nowak M, Tryniszewski W, Sarniak A, et al. (2022) Concentration dependence of anti-and pro-oxidant activity of polyphenols as evaluated with a light-emitting Fe2+-Egta-H2O2 System. Molecules 27: 3453. https://doi.org/10.3390/molecules27113453 doi: 10.3390/molecules27113453
|
| [35] |
Rajashekar CB (2023) Dual role of plant phenolic compounds as antioxidants and prooxidants. Am J Plant Sci 14: 15–28. https://doi.org/10.4236/ajps.2023.141002 doi: 10.4236/ajps.2023.141002
|
| [36] |
Wu HY, Yang KM, Chiang PY (2018) Roselle anthocyanins: antioxidant properties and stability to heat and pH. Molecules 23: 1357. https://doi.org/10.3390/molecules23061357 doi: 10.3390/molecules23061357
|
| [37] |
Horbowicz M, Kosson R, Grzesiuk A, et al. (2008). Anthocyanins of fruits and vegetables - their occurrence, analysis and role in human nutrition. Veg Crops Res Bull 68: 5–22. https://doi.org/10.2478/v10032-008-0001-8 doi: 10.2478/v10032-008-0001-8
|
| [38] |
Punyachareonnon, Deerattrakul V, Luepong K (2021) The Influence of pH, temperature and time on dyeing of silk fabric by black bean anthocyanin-rich extract as colorant. Prog Color Color Coatings 14: 179–186. https://doi.org/10.30509/pccc.2021.81715 doi: 10.30509/pccc.2021.81715
|
| [39] |
Millinia BL, Mashithah D, Nawatila R, et al. (2024) Microencapsulation of roselle (Hibiscus sabdariffa L.) anthocyanins: Effects of maltodextrin and trehalose matrix on selected physicochemical properties and antioxidant activities of spray-dried powder. Future Foods 9: 100300. https://doi.org/10.1016/j.fufo.2024.100300 doi: 10.1016/j.fufo.2024.100300
|
| [40] |
Idham Z, Putra NR, Aziz AHA, et al. (2022) Improvement of extraction and stability of anthocyanins, the natural red pigment from roselle calyces using supercritical carbon dioxide extraction. J CO2 Util 56: 101839. https://doi.org/10.1016/j.jcou.2021.101839 doi: 10.1016/j.jcou.2021.101839
|
| [41] |
Jiang T, Mao Y, Sui L, et al. (2019) Degradation of anthocyanins and polymeric color formation during heat treatment of purple sweet potato extract at different pH. Food Chem 274: 460–470. https://doi.org/10.1016/j.foodchem.2018.07.141 doi: 10.1016/j.foodchem.2018.07.141
|
| [42] |
Pasquet PL, Julien-David D, Zhao M, et al. (2024) Stability and preservation of phenolic compounds and related antioxidant activity from agro-food matrix: effect of pH and atmosphere. Food Biosci 57: 103586. https://doi.org/10.1016/j.fbio.2024.103586 doi: 10.1016/j.fbio.2024.103586
|
| [43] |
Wang Y, Xing L, Zhang J, et al. (2023) Determination of endogenous phenolic compounds in honey by HPLC-MS/MS. LWT 183: 114951. https://doi.org/10.1016/j.lwt.2023.114951 doi: 10.1016/j.lwt.2023.114951
|
| [44] | Krungkri W, Areekul V (2019) Effect of heating condition and pH on stability of total phenolic content and antioxidant activities of samui (Micromelum minutum) extract. In: Proceedings of the 16th ASEAN Food Conference (16th AFC 2019)—Outlook and Opportunities of Food Technology and Culinary for Tourism Industry. Bali, Indonesia, 15–32. https://doi.org/10.5220/0009980801260132 |
| [45] |
Chen YT, Kao WT, Lin KW (2008) Effects of pH on the total phenolic compound, antioxidative ability and the stability of dioscorin of various yam cultivars. Food Chem 107: 250–257. https://doi.org/10.1016/j.foodchem.2007.08.017 doi: 10.1016/j.foodchem.2007.08.017
|
| [46] |
Rosales-Murillo SS, Sánchez-Bodón J, Hernández Olmos SL, et al. (2024) Anthocyanin-loaded polymers as promising nature-based, responsive, and bioactive materials. Polymers 16: 163. https://doi.org/10.3390/polym16010163 doi: 10.3390/polym16010163
|
| [47] |
Cabrita L, Fossen T, Andersen ØM (2000) Colour and stability of the six common anthocyanidin 3-glucosides in aqueous solutions. Food Chem 68: 101–107. https://doi.org/10.1016/S0308-8146(99)00170-3 doi: 10.1016/S0308-8146(99)00170-3
|
| [48] |
Rakić V, Ulrih NP (2021) Influence of pH on color variation and stability of cyanidin and cyanidin 3-O-β-glucopyranoside in aqueous solution. CyTA-J Food 19: 174–182. https://doi.org/10.1080/19476337.2021.1874539 doi: 10.1080/19476337.2021.1874539
|
| [49] |
Sui X, Dong X, Zhou W (2014) Combined effect of pH and high temperature on the stability and antioxidant activity of two anthocyanins in aqueous solution. Food Chem 163: 163–170. https://doi.org/10.1016/j.foodchem.2014.04.075 doi: 10.1016/j.foodchem.2014.04.075
|
| [50] |
Rigolon TCB, Silva RRA, de Oliveira TV, et al. (2024) Exploring anthocyanins-polysaccharide synergies in microcapsule wall materials via spray drying: interaction characterization and evaluation of particle stability. Meas Food 13: 100126. https://doi.org/10.1016/j.meafoo.2023.100126 doi: 10.1016/j.meafoo.2023.100126
|
| [51] |
Tena N, Martín J, Asuero AG (2020) State of the art of anthocyanins: antioxidant activity, sources, bioavailability, and therapeutic effect in human health. Antioxidants 9: 451. https://doi.org/10.3390/antiox9050451 doi: 10.3390/antiox9050451
|
| [52] |
Floegel A, Kim DO, Chung SJ, et al. (2011) Comparison of ABTS/DPPH assays to measure antioxidant activity in popular antioxidant-rich US foods. J Food Compos Anal 24: 1043–1048. https://doi.org/10.1016/j.jfca.2011.01.008 doi: 10.1016/j.jfca.2011.01.008
|
| [53] |
Bayliak MM, Burdyliuk NI, Lushchak VI (2016) Effects of pH on antioxidant and prooxidant properties of common medicinal herbs. Open Life Sci 11: 298–307. https://doi.org/10.1515/biol-2016-0040 doi: 10.1515/biol-2016-0040
|
| [54] |
Sun HN, Mu TH, Xi LS (2017) Effect of pH, heat, and light treatments on the antioxidant activity of sweet potato leaf polyphenols. Int J Food Prop 20: 318–332. https://doi.org/10.1080/10942912.2016.1160410 doi: 10.1080/10942912.2016.1160410
|
| [55] |
Kungsuwan K, Singh K, Phetkao S, et al. (2014) Effect of pH and anthocycnin concentration on colour and antioxidant activity of Clitorea ternatea extract. Food Appl Biosci J 2: 31–46. https://doi.org/10.14456/fabj.2014.3 doi: 10.14456/fabj.2014.3
|
| [56] |
Yu L, Wu Y, Liu D, et al. (2022) The kinetic behavior of antioxidant activity and the stability of aqueous and organic polyphenol extracts from navel orange peel. Food Sci Technol 42 :e90621. https://doi.org/10.1590/fst.90621 doi: 10.1590/fst.90621
|
| [57] |
Kamiloglu S, Capanoglu E, Grootaert C, et al. (2015) Anthocyanin absorption and metabolism by human intestinal Caco2-cells—A review. Int J Mol Sci 16: 21555–21574. https://doi.org/10.3390/ijms160921555 doi: 10.3390/ijms160921555
|
| [58] |
Kudličková Z, Michalková R, Salayová A, et al. (2023) Design, synthesis, and evaluation of novel indole hybrid chalcones and their antiproliferative and antioxidant activity. Molecules 28: 6583. https://doi.org/10.3390/molecules2818658 doi: 10.3390/molecules2818658
|


Figures(6) / Tables(1)

Teti Estiasih, Jatmiko Eko Witoyo, Khofifah Putri Wulandari, Fadhillah Dwi Juniati, Widiastuti Setyaningsih, Hanifah Nuryani Lioe, Miguel Palma, Kgs Ahmadi, Hamidie Ronald Daniel Ray, Elya Mufidah. Stability comparison of conventional and foam-mat red and purple dried roselle calyces powder as a function of pH[J]. AIMS Agriculture and Food, 2025, 10(1): 177-198. doi: 10.3934/agrfood.2025010


 DownLoad: