The applications of spherical Radon transforms include synthetic aperture radar, sonar tomography, and medical imaging modalities. A spherical Radon transform maps a function to its integrals over a family of spheres. Recently, several types of incomplete spherical Radon transforms have received attention in research. This study examines two types of quarter-spherical Radon transforms that assign a function to its integral over a quarter of a sphere: 1) center of a quarter sphere of integration on a plane, and 2) center on a line and the rotation of the quarter sphere. Furthermore, we present inversion formulas for these two quarter-spherical Radon transforms.
Citation: Gyeongha Hwang, Sunghwan Moon. Inversion formulas for quarter-spherical Radon transforms[J]. AIMS Mathematics, 2023, 8(12): 31258-31267. doi: 10.3934/math.20231600
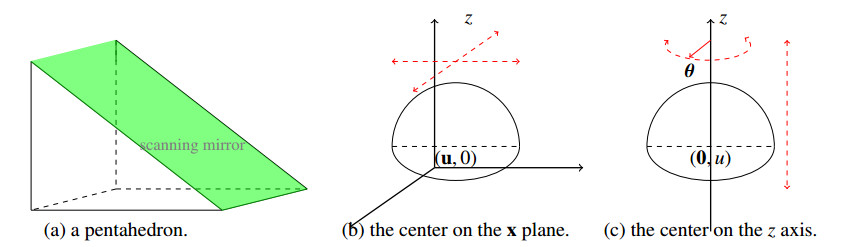
The applications of spherical Radon transforms include synthetic aperture radar, sonar tomography, and medical imaging modalities. A spherical Radon transform maps a function to its integrals over a family of spheres. Recently, several types of incomplete spherical Radon transforms have received attention in research. This study examines two types of quarter-spherical Radon transforms that assign a function to its integral over a quarter of a sphere: 1) center of a quarter sphere of integration on a plane, and 2) center on a line and the rotation of the quarter sphere. Furthermore, we present inversion formulas for these two quarter-spherical Radon transforms.

| [1] |
G. Ambartsoumian, R. Gouia-Zarrad, V. P. Krishnan, S. Roy, Image reconstruction from radially incomplete spherical Radon data, Eur. J. Appl. Math., 29 (2018), 470–493. https://doi.org/10.1017/S0956792517000250 doi: 10.1017/S0956792517000250

|
| [2] |
L. Andersson, On the determination of a function from spherical averages, SIAM J. Math. Anal., 19 (1988), 214–232. https://doi.org/10.1137/0519016 doi: 10.1137/0519016
|
| [3] |
A. M. Cormack, Representation of a function by its line integrals, with some radiological applications, J. Appl. Phys., 34 (1963), 2722–2727. https://doi.org/10.1063/1.1729798 doi: 10.1063/1.1729798
|
| [4] |
A. M. Cormack, E. T. Quinto, A Radon transform on spheres through the origin in $\mathbb{R}^n$ and applications to the Darboux equation, T. Am. Math. Soc., 260 (1980), 575–581. https://doi.org/10.1090/S0002-9947-1980-0574800-3 doi: 10.1090/S0002-9947-1980-0574800-3
|
| [5] | R. Courant, D. Hilbert, Methods of mathematical physics, New York: Interscience Publishers, 1962. |
| [6] | A. Erdelyi, Tables of integral transforms, New York: McGraw-Hill, 1954. |
| [7] |
J. A. Fawcett, Inversion of $n$-dimensional spherical averages, SIAM J. Appl. Math., 45 (1985), 336–341. https://doi.org/10.1137/0145018 doi: 10.1137/0145018
|
| [8] |
D. Finch, S. K. Patch, Rakesh, Determining a function from its mean values over a family of spheres, SIAM J. Math. Anal., 35 (2004), 1213–1240. https://doi.org/10.1137/S0036141002417814 doi: 10.1137/S0036141002417814
|
| [9] | D. Finch, Rakesh, Recovering a function from its spherical mean values in two and three dimensions, In: Photoacoustic imaging and spectroscopy, Florida: CRC Press, 2009. |
| [10] | I. M. Gelfand, S. G. Gindikin, M. I. Graev, Selected Topics in Integral Geometry, Providence: American Mathematical Society, 2003. |
| [11] |
R. Gouia-Zarrad, S. Roy, S. Moon, Numerical inversion and uniqueness of a spherical Radon transform restricted with a fixed angular span, Appl. Math. Comput., 408 (2021), 126338. https://doi.org/10.1016/j.amc.2021.126338 doi: 10.1016/j.amc.2021.126338
|
| [12] |
M. Haltmeier, Universal inversion formulas for recovering a function from spherical means, SIAM J. Math. Anal., 46 (2014), 214–232. https://doi.org/10.1137/12088127 doi: 10.1137/12088127
|
| [13] |
M. Haltmeier, S. Moon, The spherical Radon transform with centers on cylindrical surfaces, J. Math. Anal. Appl., 448 (2017), 567–579. https://doi.org/10.1016/j.jmaa.2016.11.022 doi: 10.1016/j.jmaa.2016.11.022
|
| [14] |
H. He, L. Englert, V. Ntziachrisos, Optoacoustic endoscopy of the gastrointestinal tract, ACS Photonics, 10 (2023), 559–570. https://doi.org/10.1021/acsphotonics.2c01264 doi: 10.1021/acsphotonics.2c01264
|
| [15] |
R. G. M. Kolkman, E. Hondebrink, W. Steenbergen, T. G. van Leeuwen, F. F. M. de Mul, Photoacoustic imaging of blood vessels with a double-ring sensor featuring a narrow angular aperture, J. Biomed. Opt., 9 (2004), 1327–1335. https://doi.org/10.1117/1.1805556 doi: 10.1117/1.1805556
|
| [16] |
M. Kim, K. W. Lee, K. Kim, O. Gulenko, C. Lee, B. Keum, et al., Intra-instrument channel workable, optical-resolution photoacoustic and ultrasonic mini-probe system for gastrointestinal endoscopy, Photoacoustics, 26 (2022), 100346. https://doi.org/10.1016/j.pacs.2022.100346 doi: 10.1016/j.pacs.2022.100346
|
| [17] | P. Kuchment, The Radon transform and medical imaging, Philadelphia: SIAM, 2014. |
| [18] | L. Kunyansky, Inversion of the spherical means transform in corner-like domains by reduction to the classical Radon transform, Inverse Probl., 31 (2015), 095001. |
| [19] |
L. A. Kunyansky, A series solution and a fast algorithm for the inversion of the spherical mean Radon transform, Inverse Probl., 23 (2007), S11. https://doi.org/10.1088/0266-5611/23/6/S02 doi: 10.1088/0266-5611/23/6/S02
|
| [20] | L. A. Kunyansky, Fast reconstruction algorithms for the thermoacoustic tomography in certain domains with cylindrical or spherical symmetries, Inverse Probl. Imag., 6 (2012), 111–131. |
| [21] | M. M. Lavrent'ev, V. G. Romanov, S. P. Shishatskii, Ill-posed problems of mathematical physics and analysis, Providence: American Mathematical Society, 1986. |
| [22] |
Y. Li, G. Lu, Q. Zhou, Z. Chen, Advances in endoscopic photoacoustic imaging, Photonics, 8 (2021), 281. https://doi.org/10.3390/photonics8070281 doi: 10.3390/photonics8070281
|
| [23] | N. N. Lebedev, R. A. Silverman, Special functions and their applications, New York: Dover Publications, 2012. |
| [24] |
S. Moon, Inversion formulas and stability estimates of the wave operator on the hyperplane, J. Math. Anal. Appl., 466 (2018), 490–497. https://doi.org/10.1016/j.jmaa.2018.06.006 doi: 10.1016/j.jmaa.2018.06.006
|
| [25] |
S. Moon, Inversion of the spherical Radon transform on spheres through the origin using the regular Radon transform, Commun. Pur. Appl. Anal., 15 (2016), 1029–1039. https://doi.org/10.3934/cpaa.2016.15.1029 doi: 10.3934/cpaa.2016.15.1029
|
| [26] |
S. Moon, Orthogonal function series formulas for inversion of the spherical Radon transform, Inverse Probl., 36 (2020), 035007. https://doi.org/10.1088/1361-6420/ab6d54 doi: 10.1088/1361-6420/ab6d54
|
| [27] |
E. K. Narayanan, Rakesh, Spherical means with centers on a hyperplane in even dimensions, Inverse Probl., 26 (2010), 035014. https://doi.org/10.1088/0266-5611/26/3/035014 doi: 10.1088/0266-5611/26/3/035014
|
| [28] |
F. Natterer, Photo-acoustic inversion in convex domains, Inverse Probl. Imag., 2 (2012), 315–320. https://doi.org/10.3934/ipi.2012.6.315 doi: 10.3934/ipi.2012.6.315
|
| [29] |
C. J. Nolan, M. Cheney, Synthetic aperture inversion, Inverse Probl., 18 (2002), 221. https://doi.org/10.1088/0266-5611/18/1/315 doi: 10.1088/0266-5611/18/1/315
|
| [30] |
E. T. Quinto, Null spaces and ranges for the classical and spherical Radon transforms, J. Math. Anal. Appl., 90 (1982), 408–420. https://doi.org/10.1016/0022-247X(82)90069-5 doi: 10.1016/0022-247X(82)90069-5
|
| [31] |
Rakesh, T. Yuan, Recovering initial values from light cone traces of solutions of the wave equation, Inverse Probl., 34 (2018), 075003. https://doi.org/10.1088/1361-6420/aabf0e doi: 10.1088/1361-6420/aabf0e
|
| [32] | N. J. Redding, G. N. Newsam, Inverting the circular Radon transform, DSTO Electronics and Surveillance Research Laboratory, Edinburgh, South Australia, 2001. |
| [33] |
T. A. Syed, V. P. Krishnan, J. Sivaswamy, Numerical inversion of circular arc Radon transform, IEEE T. Comput. Imag., 2 (2016), 540–549. https://doi.org/10.1109/TCI.2016.2615806 doi: 10.1109/TCI.2016.2615806
|
| [34] |
Z. Sun, H. Sun, Image reconstruction for endoscopic photoacoustic tomography including effects of detector responses, Exp. Biol. Med., 247 (2022), 881–897. https://doi.org/10.1177/15353702221079570 doi: 10.1177/15353702221079570
|
| [35] |
M. Xu, G. Ku, L. V. Wang, Microwave-induced thermoacoustic tomography using multi-sector scanning, Med. Phys., 28 (2001), 1958–1963. https://doi.org/10.1118/1.1395037 doi: 10.1118/1.1395037
|
| [36] |
M. Xu, L. V. Wang, Universal back-projection algorithm for photoacoustic computed tomography, Phys. Rev. E, 71 (2005), 016706. https://doi.org/10.1103/PhysRevE.71.016706 doi: 10.1103/PhysRevE.71.016706
|
| [37] |
J. M. Yang, K. Maslov, H. C. Yang, Q. Zhou, K. K. Shung, L. V. Wang, Photoacoustic endoscopy, Opt. Lett., 34 (2009), 1591–1593. https://doi.org/10.1364/OL.34.001591 doi: 10.1364/OL.34.001591
|
| [38] |
C. E. Yarman, B. Yazici, Inversion of the circular averages transform using the Funk transform, Inverse Probl., 27 (2011), 065001. https://doi.org/10.1088/0266-5611/27/6/065001 doi: 10.1088/0266-5611/27/6/065001
|
| [39] |
L. Zalcman, Offbeat integral geometry, Am. Math. Mon., 87 (1980), 161–175. https://doi.org/10.1080/00029890.1980.11994985 doi: 10.1080/00029890.1980.11994985
|
| [40] |
G. Zangerl, S. Moon, M. Haltmeier, Photoacoustic tomography with direction dependent data: an exact series reconstruction approach, Inverse Probl., 35 (2019), 114005. https://doi.org/10.1088/1361-6420/ab2a30 doi: 10.1088/1361-6420/ab2a30
|
| [41] |
S. Zheng, Q. Meng, X. Y. Wang, Quantitative endoscopic photoacoustic tomography using a convolutional neural network, Appl. Opt., 61 (2022), 2574–2581. https://doi.org/10.1364/AO.441250 doi: 10.1364/AO.441250
|
Figures(1)

Gyeongha Hwang, Sunghwan Moon. Inversion formulas for quarter-spherical Radon transforms[J]. AIMS Mathematics, 2023, 8(12): 31258-31267. doi: 10.3934/math.20231600


 DownLoad: