The planning of urban public health spatial can not only help people's physical and mental health but also help to optimize and protect the urban environment. It is of great significance to study the planning methods of urban public health spatial. The application effect of traditional urban public health spatial planning is poor, in this paper, urban public health spatial planning using big data technology and visual communication in the Internet of Things (IoT) is proposed. First, the urban public health spatial planning architecture is established in IoT, which is divided into the perception layer, the network layer and the application layer; Second, information collection is performed at the perception layer, and big data technology is used at the network layer to simplify spatial model information, automatically sort out spatial data, and establish a public health space evaluation system according to the type and characteristics of spatial data; Finally, the urban public health space is planned based on the health assessment results and the visual communication design concept through the application layer. The results show that when the number of regions reaches 60,000, the maximum time of region merging is 7.86s. The percentage of spatial fitting error is 0.17. The height error of spatial model is 0.31m. The average deviation error of the spatial coordinates is 0.23, which can realize the health planning of different public spaces.
Citation: Meiting Qu, Shaohui Liu, Lei Li. Urban public health spatial planning using big data technology and visual communication in IoT[J]. Mathematical Biosciences and Engineering, 2023, 20(5): 8583-8600. doi: 10.3934/mbe.2023377
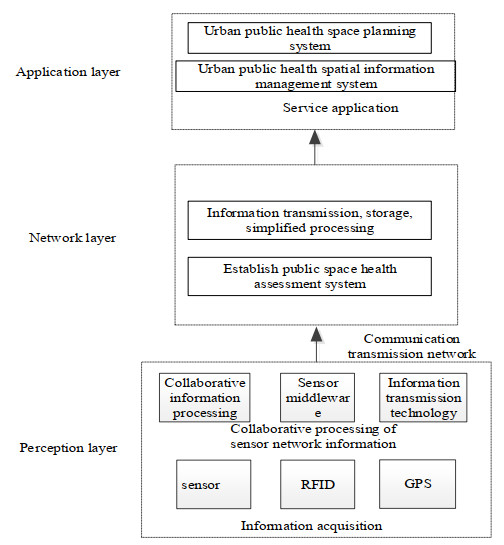
The planning of urban public health spatial can not only help people's physical and mental health but also help to optimize and protect the urban environment. It is of great significance to study the planning methods of urban public health spatial. The application effect of traditional urban public health spatial planning is poor, in this paper, urban public health spatial planning using big data technology and visual communication in the Internet of Things (IoT) is proposed. First, the urban public health spatial planning architecture is established in IoT, which is divided into the perception layer, the network layer and the application layer; Second, information collection is performed at the perception layer, and big data technology is used at the network layer to simplify spatial model information, automatically sort out spatial data, and establish a public health space evaluation system according to the type and characteristics of spatial data; Finally, the urban public health space is planned based on the health assessment results and the visual communication design concept through the application layer. The results show that when the number of regions reaches 60,000, the maximum time of region merging is 7.86s. The percentage of spatial fitting error is 0.17. The height error of spatial model is 0.31m. The average deviation error of the spatial coordinates is 0.23, which can realize the health planning of different public spaces.

| [1] |
N. P. Skinner, T. T. LaPlumm, J. D. Bullough, Warning light flash frequency as a method for visual communication to drivers, J. Transp. Res. Board, 2675 (2021), 88–93. https://doi.org/10.1177/0361198120983325 doi: 10.1177/0361198120983325

|
| [2] |
M. Liu, J. Wang, J. Zhou, Simulation study on extraction method of graphic elements of ocean plane based on visual communication, J. Coastal Res., 108 (2020), 113–117. https://doi.org/10.2112/JCR-SI108-023.1 doi: 10.2112/JCR-SI108-023.1
|
| [3] |
M. V. Shatskaya, A. A. Abramov, N. A. Fedorov, V. I. Kostenko, S. F. Likhachev, S. I. Seliverstov, et al., Data processing center of RadioAstron space VLBI project, Adv. Space Res., 65 (2020), 813–820. https://doi.org/10.1016/j.asr.2019.05.043 doi: 10.1016/j.asr.2019.05.043
|
| [4] |
J. Chang, S. N. Kadry, S. Krishnamoorthy, Review and synthesis of Big Data analytics and computing for smart sustainable cities, IET Intell. Transp. Syst., 14 (2020), 1363–1370. https://doi.org/10.1049/iet-its.2020.0006 doi: 10.1049/iet-its.2020.0006
|
| [5] |
J. Zhang, Z. Yu, B. Zhao, R. Sun, H. Vejre, Links between green space and public health: a bibliometric review of global research trends and future prospects from 1901 to 2019, Environ. Res. Lett., 15 (2020), 063001. https://doi.org/10.1088/1748-9326/ab7f64 doi: 10.1088/1748-9326/ab7f64
|
| [6] |
T. Bianchi-Aguiar, A. Hübner, M. A. Carravilla, J. F. Oliveira, Retail shelf space planning problems: A comprehensive review and classification framework, Eur. J. Oper. Res., 289 (2020), 1–16. https://doi.org/10.1016/j.ejor.2020.06.018 doi: 10.1016/j.ejor.2020.06.018
|
| [7] |
Q. Huang, K. Kieffer, An intelligent internet of things (IoT) sensor system for building environmental monitoring, J. Mobile multimedia, 15 (2019), 29–50. https://doi.org/10.13052/jmm1550-4646.15122 doi: 10.13052/jmm1550-4646.15122
|
| [8] |
D. Ma, R. Guo, Jing Ying, Y. Jing, Y. Zheng, Z. Zhao, et al., Intra-urban scaling properties examined by automatically extracted city hotspots from street data and nighttime light imagery, Remote Sens., 13 (2021), 1322–1322. https://doi.org/10.3390/rs13071322 doi: 10.3390/rs13071322
|
| [9] |
S. P. Gopalan, C. L. Chowdhary, C. Iwendi, M. A. Farid, L. K. Ramasamy, An efficient and privacy-preserving scheme for disease prediction in modern healthcare systems, Sensors, 22 (2022), 5574. https://doi.org/10.3390/s22155574 doi: 10.3390/s22155574
|
| [10] |
S. Thandapani, M. I. Mahaboob, C. Iwendi, D. Selvaraj, A. Dumka, M. Rashid, et al., IoMT with deep CNN: AI-based intelligent support system for pandemic diseases, Electronics, 12 (2023), 424. https://doi.org/10.3390/electronics12020424 doi: 10.3390/electronics12020424
|
| [11] |
W. Xu, C. Yuan, K. Peng, H. Du, Big data driven urban railway planning: Shenzhen metro case study, J. Comb. Optim., 42 (2019), 1–23. https://doi.org/10.1007/s10878-019-00422-0 doi: 10.1007/s10878-019-00422-0
|
| [12] | H. Guo, K. L. Man, Q. Ren, Q. Huang, V. Hahanov, E. Litvinova, et al., FPGA Implementation of VLC Communication Technology, in 2017 31st International Conference on Advanced Information Networking and Applications Workshops (WAINA), (2017), 586–590. https://doi.org/10.1109/WAINA.2017.54 |
| [13] | S. N. Ismail, M. H. Salih, A review of visible light communication (VLC) technology, in AIP Conference Proceedings, 2213 (2020). https://doi.org/10.1063/5.0000109 |
| [14] |
Q. Liu, L. Hou, S. Shaukat, U. Tariq, R. Riaz, S. S. Rizvi, Perceptions of spatial patterns of visitors in urban green spaces for the sustainability of smart city, Int. J. Distrib. Sens. Networks, 17 (2021), 15501477211. https://doi.org/10.1177/15501477211034069 doi: 10.1177/15501477211034069
|
| [15] |
X. Ma, H. Xue, Intelligent smart city parking facility layout optimization based on intelligent IoT analysis, Comput. Commun., 153 (2020), 145–151. https://doi.org/10.1016/j.comcom.2020.01.055 doi: 10.1016/j.comcom.2020.01.055
|
| [16] |
H. Shin, K. Lee, H. Kwon, A comparative experimental study of distributed storage engines for big spatial data processing using GeoSpark, J. Supercomput., 78 (2021), 2556–2579. https://doi.org/10.1007/s11227-021-03946-7 doi: 10.1007/s11227-021-03946-7
|
| [17] |
M. Wlodarczyk-Sielicka, W. Blaszczak-Bak, Processing of bathymetric data: The fusion of new reduction methods for spatial big data, Sensors, 20 (2020), 6207. https://doi.org/10.3390/s20216207 doi: 10.3390/s20216207
|
| [18] |
Q. Zheng, X. Zhao, M. Jin, Research on urban public green space planning based on taxi data: A case study on three districts of Shenzhen, China, Sustainability, 11 (2019), 1–20. https://doi.org/10.3390/su11041132 doi: 10.3390/su11041132
|
| [19] |
M. Liu, X. Li, D. Song, H. Zhai, Evaluation and monitoring of urban public greenspace planning using landscape metrics in Kunming, Sustainability, 13 (2021), 3704–3715. https://doi.org/10.3390/su13073704 doi: 10.3390/su13073704
|
| [20] |
C. Wang, L. Shi, S. Liu, C. Lu, Design of loT-based barrier-free facilities management system for urban public space, Mod. Electron. Tech., 44 (24), (2021), 49–53. https://doi.org/10.16652/j.issn.1004-373x.2021.24.011 doi: 10.16652/j.issn.1004-373x.2021.24.011
|
| [21] |
Y. Yuan, Z. Li, H. Liang, Selection and spatial layout of urban sports facilities guided by residents' demand, Open House Int., 44 (2019), 9–12. https://doi.org/10.1108/OHI-03-2019-B0003 doi: 10.1108/OHI-03-2019-B0003
|
| [22] |
J. Zeng, W. Zhang, J. Chen, X. Cheng, Evaluation of the rationality of urban park spatial layout based on disaster prevention objective, Open Access Library J., 9 (2022), 1–12. https://doi.org/10.4236/oalib.1108496 doi: 10.4236/oalib.1108496
|
| [23] |
Kristina Perić, Zdenko Šimić, Željko Jurić, Characterization of uncertainties in smart city planning: a case study of the smart metering deployment, Energies, 15 (2022), 2040. https://doi.org/10.3390/en15062040 doi: 10.3390/en15062040
|
| [24] | J. Chen, Z. Zhang, Y. Long, Strategies for improving the quality of urban street space oriented to promoting public health: perspective from spatial quality, City Plann. Rev., 44 (2020), 35–47. |
| [25] |
M. Esmaeilbeigi, O. Chatrabgoun, A. Hosseinian-Far, R. Montasari, A. Daneshkhah, A low cost and highly accurate technique for big data spatial-temporal interpolation, Appl. Numer. Math., 153 (2020), 492–502. https://doi.org/10.1016/j.apnum.2020.03.009 doi: 10.1016/j.apnum.2020.03.009
|


Figures(4) / Tables(5)

Meiting Qu, Shaohui Liu, Lei Li. Urban public health spatial planning using big data technology and visual communication in IoT[J]. Mathematical Biosciences and Engineering, 2023, 20(5): 8583-8600. doi: 10.3934/mbe.2023377


 DownLoad: