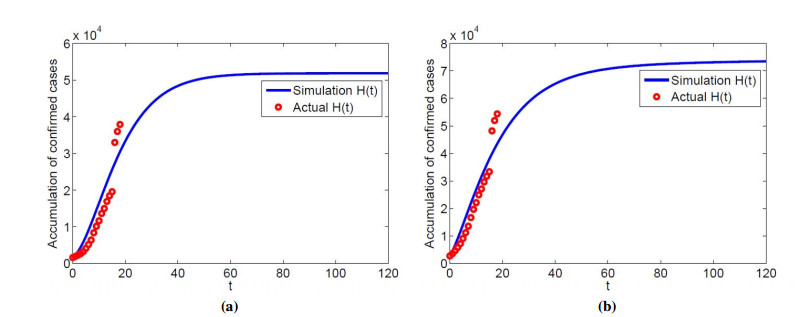
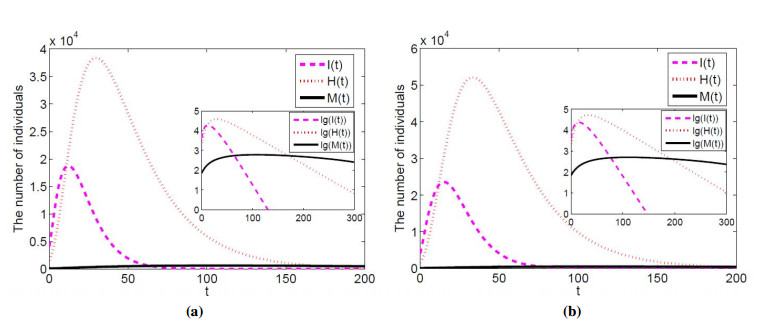
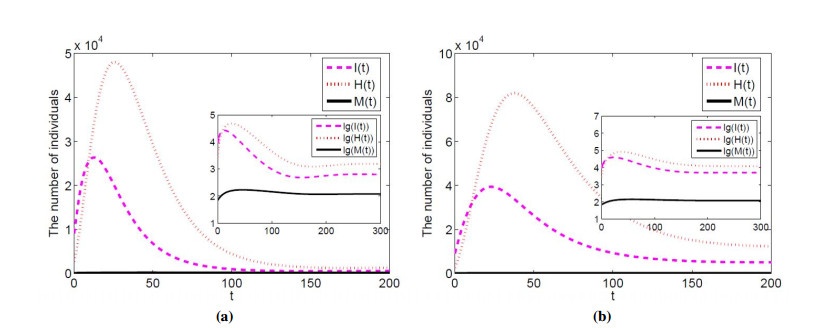
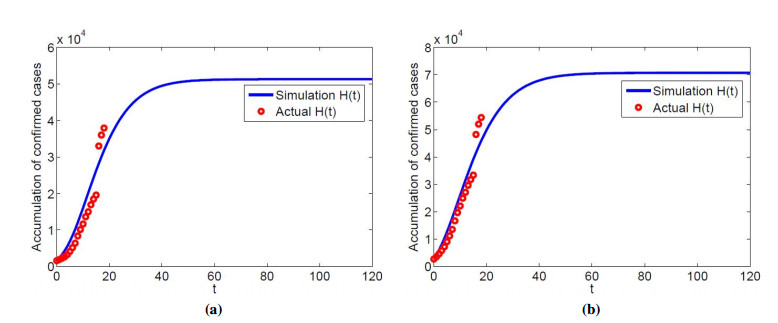
Awareness of prevention is enhanced to reduce the rate of infection by media coverage, which plays an important role in preventing and controlling infectious diseases. Based on epidemic situation of the Corona Virus Disease 2019 (COVID-19) in Hubei, an SIHRS epidemic model with media coverage was proposed. Firstly, by the basic reproduction number R0, the globally asymptotically stable of the disease-free equilibrium and the endemic equilibrium were proved. Then, based on the reported epidemic data of Hubei Province from January 26 to February 13, numerical simulations are used to verify the analysis results, and the impact of peak time and the scale of disease transmission were mainly considered with different information implementation rate and the contact rate. It was shown that with the decrease of information implementation rate, the peak of confirmed cases would be delayed to reach, and would increase significantly. Therefore, in order to do a better prevention measures after resumption of work, it is very necessary to maintain the amount of information and implementation rate of media coverage.
Citation: Xinghua Chang, Maoxing Liu, Zhen Jin, Jianrong Wang. Studying on the impact of media coverage on the spread of COVID-19 in Hubei Province, China[J]. Mathematical Biosciences and Engineering, 2020, 17(4): 3147-3159. doi: 10.3934/mbe.2020178
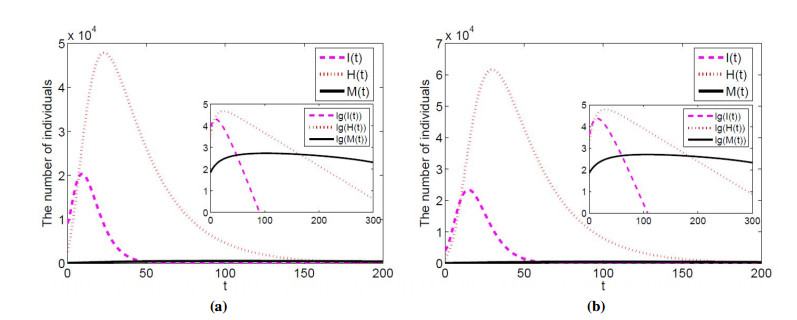
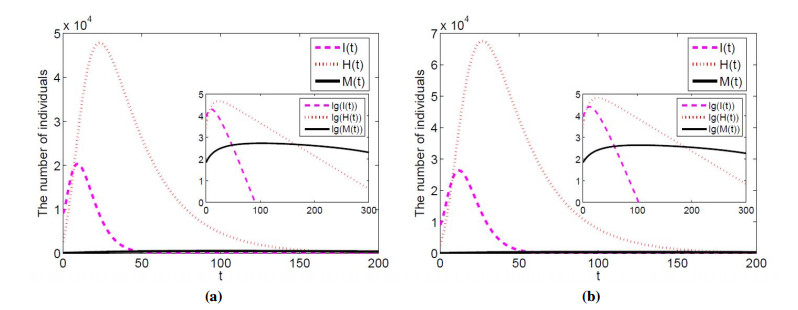
Awareness of prevention is enhanced to reduce the rate of infection by media coverage, which plays an important role in preventing and controlling infectious diseases. Based on epidemic situation of the Corona Virus Disease 2019 (COVID-19) in Hubei, an SIHRS epidemic model with media coverage was proposed. Firstly, by the basic reproduction number R0, the globally asymptotically stable of the disease-free equilibrium and the endemic equilibrium were proved. Then, based on the reported epidemic data of Hubei Province from January 26 to February 13, numerical simulations are used to verify the analysis results, and the impact of peak time and the scale of disease transmission were mainly considered with different information implementation rate and the contact rate. It was shown that with the decrease of information implementation rate, the peak of confirmed cases would be delayed to reach, and would increase significantly. Therefore, in order to do a better prevention measures after resumption of work, it is very necessary to maintain the amount of information and implementation rate of media coverage.

| [1] |
A. W. Robin, A. J. McMichael, Social and environmental risk factors in the emergence of infectious diseases, Nat. Med., 10 (2004), 570-576. doi: 10.1038/nm0604-570

|
| [2] | World health organization, 2020. Available from: . |
| [3] | X. Wang, S. Y. Tang, Y. Cheng, X. M. Feng, Y. N. Xiao, Z. B. Xu, When will be the resumption of work in Wuhan and its surrounding areas during COVID-19 epidemic? A data-driven network modeling analysis, Chinese Sci. Math., 50 (2020), 1-10. |
| [4] | B. Tang, X. Wang, Q. Li, Estimation of the transmission risk of the 2019-nCoV and its implication for public health interventions, J. Comput. Math., 9 (2020), 462. |
| [5] | B. Tang, N. L. Bragazzi, Q. Li, S. Tang, Y. Xiao, J. Wu, An updated estimation of the risk of transmission of the novel coronavirus (2019-nCoV), Infect. Dis. Model., 5 (2020), 248-255. |
| [6] | Update: novel coronavirus pneumonia epidemic map, 2020. Available from: https://voice.baidu.com/act/newpneumonia/newpneumonia/?from=osari_pc_3 (accessed on 13 February 2020). |
| [7] |
Y. P. Liu, J. G. Cui, The impact of media coverage on the dynamics of infections disease, Int. J. Biomath., 1 (2008), 65-74. doi: 10.1142/S1793524508000023
|
| [8] | J. M. Tchuenche, C. T. Bauch, Dynamics of an infectious disease where media coverage influences transmission, ISRN Biomath., 2012 (2012), 1-10. |
| [9] | L. X. Zuo, M. X. Liu, J. Q. Wang, The impact of awareness programs with recruitment and delay on the spread of an epidemic, Math. Prob. Eng., 2014 (2014), 235935. |
| [10] |
M. X. Liu, S. S. He, Y. Z. Sun, The impact of media converge on complex networks on disease transmission, Math. Biosci. Eng., 16 (2019), 6335-6349. doi: 10.3934/mbe.2019316
|
| [11] |
A. K. Misra, A. Sharma, J. B. Shukla, Modeling and analysis of effects of awareness programs by media on the spread of infectious diseases, Math. Comput. Model., 53 (2011), 1221-1228. doi: 10.1016/j.mcm.2010.12.005
|
| [12] |
A. K. Misra, A. Sharma, V. Singh, Effect of awareness programs in controlling the prevalence of an epidemic with time delay, J. Biol. Syst., 19 (2011), 389-402. doi: 10.1142/S0218339011004020
|
| [13] |
A. Sharma, A. K. Misra, Backward bifurcation in a smoking cessation model with media campaigns, Appl. Math. Model., 39 (2015), 1087-1098. doi: 10.1016/j.apm.2014.07.022
|
| [14] | L. W. Wang, Y. Li, L. Y. Pang, Dynamics analysis of an epidemiological model with media impact and two delays, Math. Prob. Eng., 2016 (2016), 1598932. |
| [15] |
Y. Wang, J. D. Gao, Z. Jin, H. F. Zhang, C. G. Sun, Impact of media coverage on epidemic spreading in complex networks, INT. J. BIOMATH, 1 (2008), 65-74. doi: 10.1142/S1793524508000023
|
| [16] |
A. K. Misra, A. Sharma, J. B. Shukla, Modeling and analysis of effects of awareness programs by media on the spread of infectious diseases, Math. Comput. Model., 53 (2011), 1221-1228. doi: 10.1016/j.mcm.2010.12.005
|
| [17] |
W. K. Zhou, A. l. Wang, F. Xia, Y. N. Xiao, S. Y. Tang, Effects of media reporting on mitigating spread of COVID-19 in the early phase of the outbreak, Math. Biosci. Eng., 17 (2020), 2693-2707. doi: 10.3934/mbe.2020147
|
| [18] | Wuhan Municipal Health Commission, 2020. Available from: http://wjw.wuhan.gov.cn/front/web/showDetail/2020010309017 (accessed on 13 February 2020). |
| [19] | Wuhan novel coronavirus gov.cn prevention and control command Announcement (NO.1), 2020. Available from: http://www.gov.cn/xinwen/2020-01/23/content_5471751.htm (accessed on 13 February 2020). |
| [20] | R. J. McEliece, The Theory of Information and Coding, Addison-Wesley Publishing Company.Inc., (1997). |
| [21] |
P. van den Driessche, J. Watmough, Reproduction numbers and sub-threshold endemic equilibria for compartmental models of disease transmission, Math. Biosci., 180 (2002), 29-48. doi: 10.1016/S0025-5564(02)00108-6
|
| [22] | X. Q. Zhao, Z. J. Jing, Global asymptotic behavior in some cooperative systems of functional differential equations, Appl. Math. Quart., 4 (1996), 421-444. |
| [23] | Health Committee of Hubei Province, 2020. Available from: http://wjw.hubei.gov.cn/fbjd/tzgg/ (accessed on 13 February 2020). |
| [24] |
X. M. Rong, M. Fan, X. D. Sun, Y. M. Wang, H. P. Zhu, Impact of disposing stray dogs on risk assessment and control of Echinococcosis in Inner Mongolia, Math. Biosci., 299 (2018), 85-96. doi: 10.1016/j.mbs.2018.03.008
|
| [25] | National migration details - Baidu map migration big data, 2020. Available from: http://qianxi.baidu.com/. |
| [26] | Hubei Sina News, 2020. Available from: http://news.sina.com.cn/c/2020-02-08/doc-iimxxste9694826.shtml. |
Figures(6) / Tables(1)

Xinghua Chang, Maoxing Liu, Zhen Jin, Jianrong Wang. Studying on the impact of media coverage on the spread of COVID-19 in Hubei Province, China[J]. Mathematical Biosciences and Engineering, 2020, 17(4): 3147-3159. doi: 10.3934/mbe.2020178


 DownLoad: