The COVID-19 pandemic has caused widespread concern around the world. In order to study the impact of media coverage and vaccination on the spread of COVID-19, we establish an SVEAIQR infectious disease model, and fit the important parameters such as transmission rate, isolation rate and vaccine efficiency based on the data from Shanghai Municipal Health Commission and the National Health Commission of the People's Republic of China. Meanwhile, the control reproduction number and the final size are derived. Moreover, through sensitivity analysis by PRCC (partial rank correlation coefficient), we discuss the effects of both the behavior change constant $ k $ according to media coverage and the vaccine efficiency $ \varepsilon $ on the transmission of COVID-19. Numerical explorations of the model suggest that during the outbreak of the epidemic, media coverage can reduce the final size by about 0.26 times. Besides that, comparing with $ 50\% $ vaccine efficiency, when the vaccine efficiency reaches $ 90\% $, the peak value of infected people decreases by about 0.07 times. In addition, we simulate the impact of media coverage on the number of infected people in the case of vaccination or non-vaccination. Accordingly, the management departments should pay attention to the impact of vaccination and media coverage.
Citation: Xiaojing Wang, Yu Liang, Jiahui Li, Maoxing Liu. Modeling COVID-19 transmission dynamics incorporating media coverage and vaccination[J]. Mathematical Biosciences and Engineering, 2023, 20(6): 10392-10403. doi: 10.3934/mbe.2023456
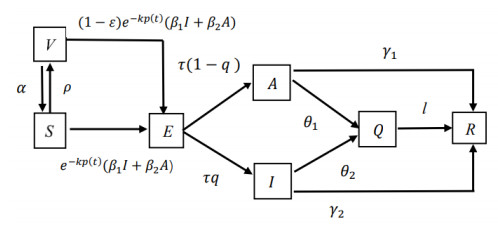
The COVID-19 pandemic has caused widespread concern around the world. In order to study the impact of media coverage and vaccination on the spread of COVID-19, we establish an SVEAIQR infectious disease model, and fit the important parameters such as transmission rate, isolation rate and vaccine efficiency based on the data from Shanghai Municipal Health Commission and the National Health Commission of the People's Republic of China. Meanwhile, the control reproduction number and the final size are derived. Moreover, through sensitivity analysis by PRCC (partial rank correlation coefficient), we discuss the effects of both the behavior change constant $ k $ according to media coverage and the vaccine efficiency $ \varepsilon $ on the transmission of COVID-19. Numerical explorations of the model suggest that during the outbreak of the epidemic, media coverage can reduce the final size by about 0.26 times. Besides that, comparing with $ 50\% $ vaccine efficiency, when the vaccine efficiency reaches $ 90\% $, the peak value of infected people decreases by about 0.07 times. In addition, we simulate the impact of media coverage on the number of infected people in the case of vaccination or non-vaccination. Accordingly, the management departments should pay attention to the impact of vaccination and media coverage.

| [1] |
G. Vattiatio, A. Lustig, O. J. Maclaren, M. J. Plank, Modelling the dynamics of infection, waning of immunity and re-infection with the Omicron variant of SARS-CoV-2 in Aotearoa New Zealandr, Epidemics, 41 (2022), 100657. https://doi.org/10.1016/j.epidem.2022.100657 doi: 10.1016/j.epidem.2022.100657

|
| [2] |
Q. Yan, Y. Tang, D. Yan, J. Wang, L. Yang, X. Yang, et al., Impact of media reports on the early spread of COVID-19 epidemic, J. Theor. Biol., 502 (2020), 110385. https://doi.org/10.1016/j.jtbi.2020.110385 doi: 10.1016/j.jtbi.2020.110385
|
| [3] |
S. Collinson, J. M. Heffernan, Modelling the effects of media during an influenza epidemic, BMC Public Health, 14 (2014), 376. https://doi.org/10.1186/1471-2458-14-376 doi: 10.1186/1471-2458-14-376
|
| [4] |
O. Koutou, A. B. Diabaté, B. Sangaré, Mathematical analysis of the impact of the media coverage in mitigating the outbreak of COVID-19, Math. Comput. Simul., 205 (2023), 600–618. https://doi.org/10.1016/j.matcom.2022.10.017 doi: 10.1016/j.matcom.2022.10.017
|
| [5] |
N. Liu, Z. Chen, G. Bao, Role of media coverage in mitigating COVID-19 transmission: Evidence from China, Technol. Forecast Soc. Change, 163 (2021), 120435. https://doi.org/10.1016/j.techfore.2020.120435 doi: 10.1016/j.techfore.2020.120435
|
| [6] | Shanghai Municipal Health Commission, News center [EB/OL], (2022). Available from: https://wsjkw.sh.gov.cn/xwfb/index.html (accessed March 15, 2023). |
| [7] |
T. Hu, M. Zhang, A. Deng, Y. Zhang, B. Li, Y. Li, et al., Comparison of Omicron and Delta Variant Infection COVID-19 Cases — Guangdong Province, China, 2022, China CDC Weekly, 4 (2022), 385–388. https://doi.org/10.46234/ccdcw2022.087 doi: 10.46234/ccdcw2022.087
|
| [8] |
C. Xu, Z. Zhang, X. Huang, J. Cui, X. Han, The Dynamic Effects of Different Quarantine Measures on the Spread of COVID-19, JAAC, 12 (2022), 1532–1543. https://doi.org/10.11948/20210326 doi: 10.11948/20210326
|
| [9] | F. Brauer, C. Castillo-Chavez, Mathematical Models in Population Biology and Epidemiology, Springer-Verlag New York, New York, (2010). https://doi.org/10.1007/978-1-4614-1686-9 |
| [10] |
J. Arino, F. Brauer, P. van den Driessche, J. Watmough, J. Wu, Simple models for containment of a pandemic, J. R Soc. Interface, 3 (2006), 453–457. https://doi.org/10.1098/rsif.2006.0112 doi: 10.1098/rsif.2006.0112
|
| [11] |
Y. Zou, W. Yang, J. Lai, J. Hou, W. Lin, Vaccination and quarantine effect on COVID-19 transmission dynamics incorporating Chinese-Spring-Festival travel rush: Modeling and simulations, B Math. Biol., 84 (2022), 30. https://doi.org/10.1007/s11538-021-00958-5 doi: 10.1007/s11538-021-00958-5
|
| [12] |
U. A. de León, E. Avila-Vales, K. L. Huang, Modeling COVID-19 dynamic using a two-strain model with vaccination, Chaos Soliton. Fract., 157 (2022), 111927. https://doi.org/10.1016/j.chaos.2022.111927 doi: 10.1016/j.chaos.2022.111927
|
| [13] |
H. Song, R Wang, S. Liu, Z. Jin, D. He, Global stability and optimal control for a COVID-19 model with vaccination and isolation delays, Results Phys., 42 (2022), 106011. https://doi.org/10.1016/j.rinp.2022.106011 doi: 10.1016/j.rinp.2022.106011
|
| [14] |
T. Krueger, K. Gogolewski, M. Bodych, A. Gambin, G. Giordano, S. Cuschieri, et al., Risk assessment of COVID-19 epidemic resurgence in relation to SARS-CoV-2 variants and vaccination passes, Commun. Med. (Lond), 2 (2022), 23. https://doi.org/10.1038/s43856-022-00084-w doi: 10.1038/s43856-022-00084-w
|
| [15] |
Europe must come together to confront omicron, Health professionals and researchers from across Europe, BMJ, 376 (2022), o90. http://dx.doi.org/10.1136/bmj.o90 doi: 10.1136/bmj.o90
|
| [16] |
R. Markovič, M. Šterk, M. Marhl, M. Perc, M. Gosak, Socio-demographic and health factors drive the epidemic progression and should guide vaccination strategies for best COVID-19 containment, Results Phys., 26 (2021), 104433. https://doi.org/10.1016/j.rinp.2021.104433 doi: 10.1016/j.rinp.2021.104433
|
| [17] |
E. Rashed, S. Kodera, A. Hirata, COVID-19 forecasting using new viral variants and vaccination effectiveness models, Int. J. Biomath., 2 (2022), 23. https://doi.org/10.1016/j.compbiomed.2022.105986 doi: 10.1016/j.compbiomed.2022.105986
|
| [18] |
L. Childs, D. W. Dick, Z. Feng, J. M. Heffernan, J. Li, G. Röst, Modeling waning and boosting of COVID-19 in Canada with vaccination, Epidemics, 39 (2022), 100583. https://doi.org/10.1016/j.epidem.2022.100583 doi: 10.1016/j.epidem.2022.100583
|
| [19] |
S. Y. Tchoumi, H. Rwezaura, J. M. Tchuenche, Dynamic of a two-strain COVID-19 model with vaccination, Results Phys., 39 (2022), 105777. https://doi.org/10.1016/j.rinp.2022.105777 doi: 10.1016/j.rinp.2022.105777
|
| [20] |
J. Zhang, Y. Qiao, Y. Zhang, Bifurcation analysis and optimal control of COVID-19 with exogenous reinfection and media coverages, Comput. Biol. Med., 16 (2023), 2250086. https://doi.org/10.1142/S1793524522500863 doi: 10.1142/S1793524522500863
|
| [21] |
Y. Xiao, S. Tang, J. Wu, Media impact switching surface during an infectious disease outbreak, Sci. Rep., 5 (2015), 7838. https://doi.org/10.1038/srep07838 doi: 10.1038/srep07838
|
| [22] |
K. Lata, A. K. Misra, Y. Takeuchi, Modeling the effectiveness of TV and social media advertisements on the dynamics of water-borne diseases, Int. J. Biomath., 15 (2022), 2150069. https://doi.org/10.1142/S1793524521500698 doi: 10.1142/S1793524521500698
|
| [23] |
J. Lv, S. Guo, J. Cui, J. P. Tian, Asymptomatic transmission shifts epidemic dynamics, Math. Biosci. Eng., 18 (2020), 92–111. https://doi.org/10.3934/mbe.2021005 doi: 10.3934/mbe.2021005
|
| [24] | National Health Commission of the People's Republic of China, [EB/OL], (2022), Available from: http://www.nhc.gov.cn/ (accessed March 15, 2023). |


Figures(7) / Tables(1)

Xiaojing Wang, Yu Liang, Jiahui Li, Maoxing Liu. Modeling COVID-19 transmission dynamics incorporating media coverage and vaccination[J]. Mathematical Biosciences and Engineering, 2023, 20(6): 10392-10403. doi: 10.3934/mbe.2023456


 DownLoad: