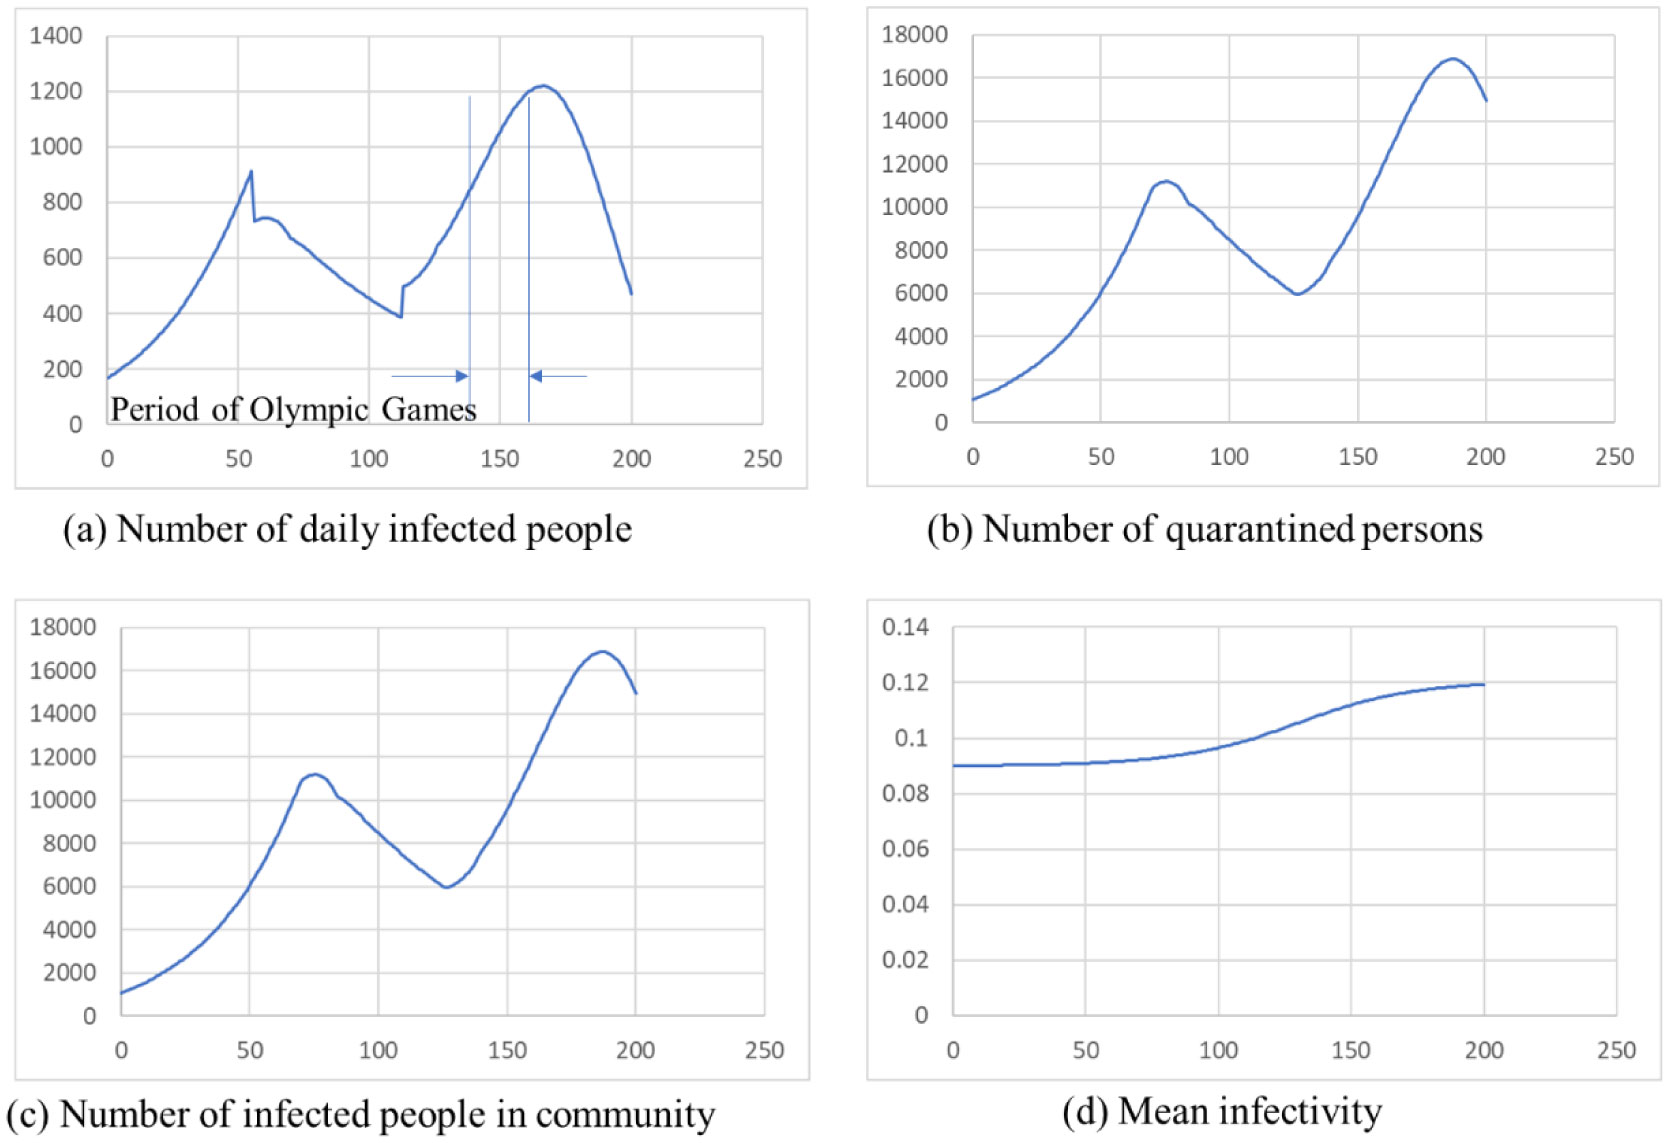
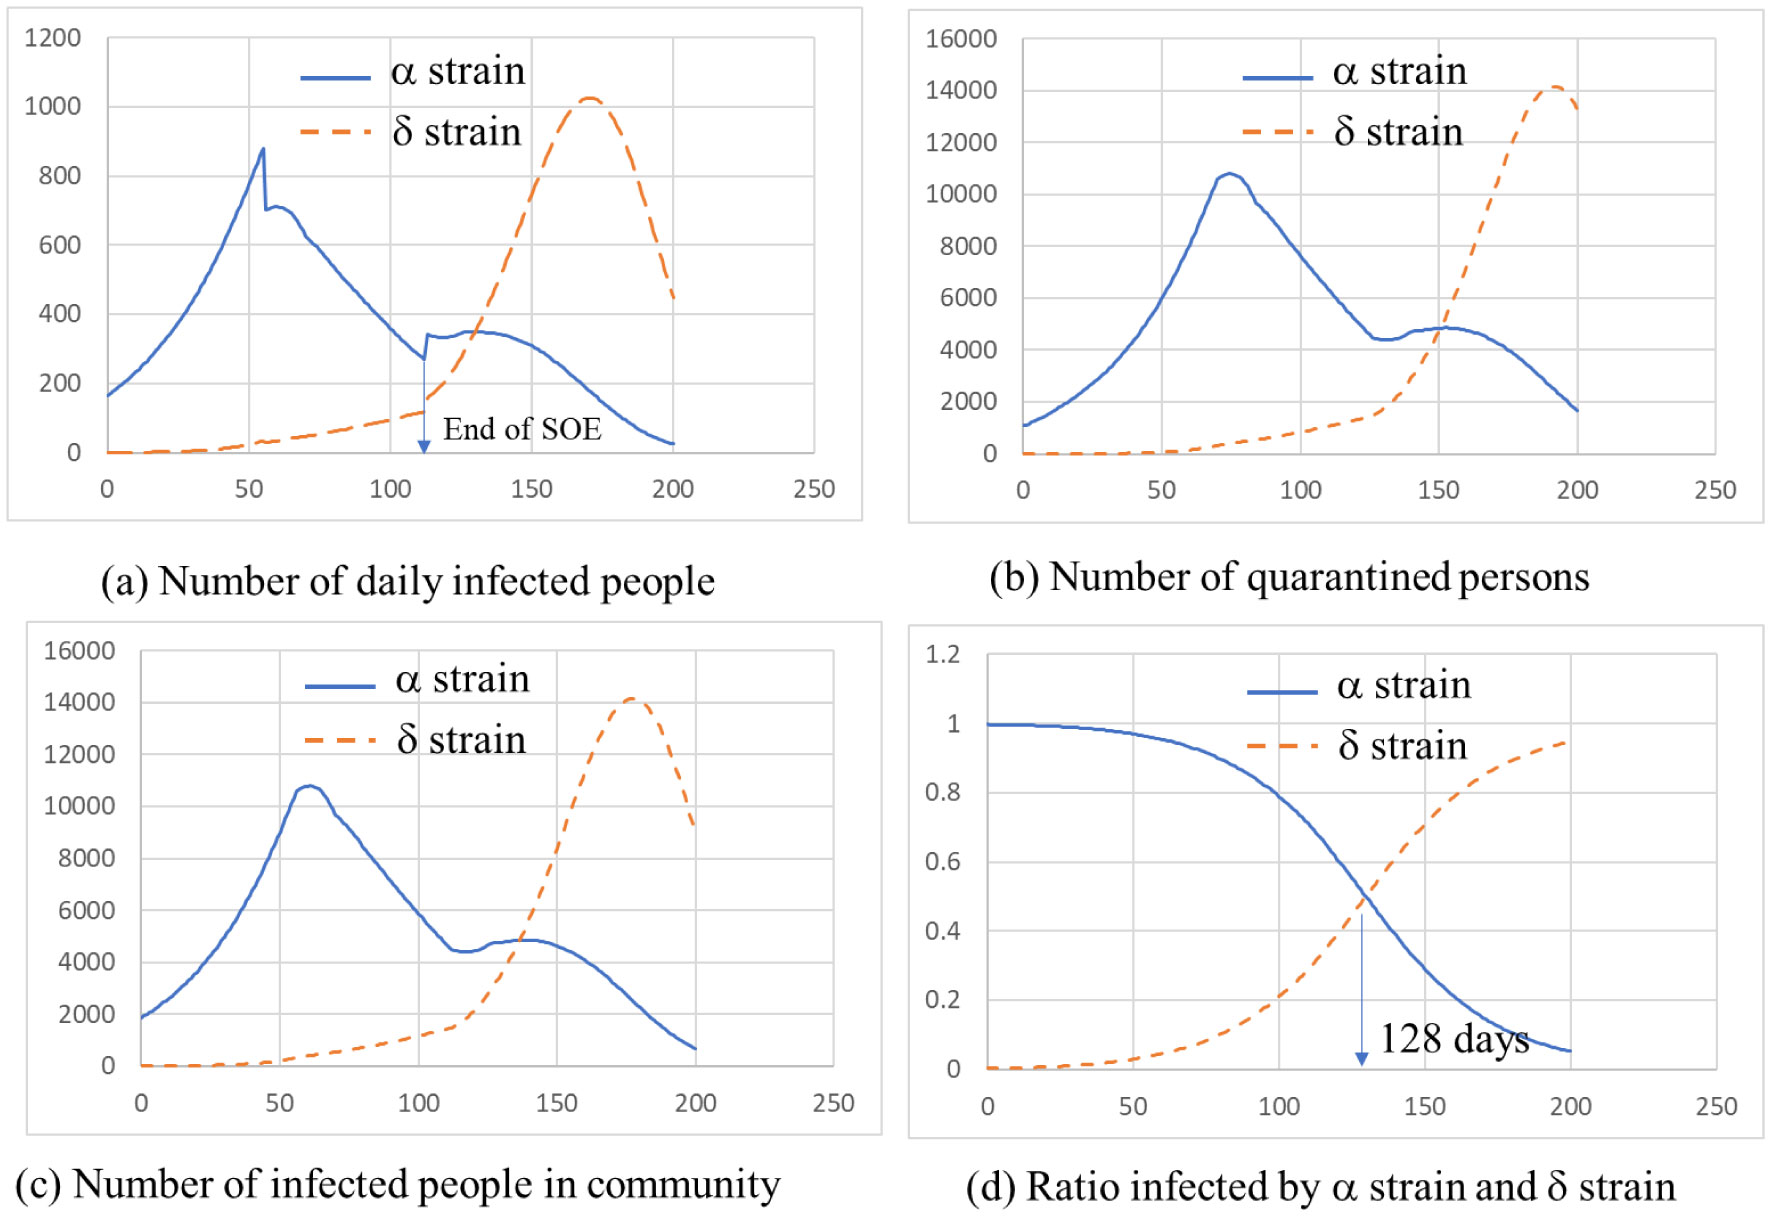
ATLM (Apparent Time Lag Model) was extended to simulate the spread of infection in a mixed state of the variant virus and original wild type. It is applied to the 4th wave of infection spread in Tokyo, and (1) the 4th wave bottoms out near the end of the state of emergency, and the number of infected people increases again. (2) The rate of increase will be mainly by d strain (L452R) virus, while the increase by a strain (N501Y) virus will be suppressed. (3) It is anticipated that the infection will spread during the Olympic Games. (4) When variant viruses compete, the infection of highly infectious virus rises sharply while the infection by weakly infectious ones has converged. (5) It is effective as an infection control measure to find an infected person early and shorten the period from infection to quarantine by PCR test or antigen test as a measure other than the vaccine.
Citation: Makoto Koizumi, Motoaki Utamura, Seiichi Kirikami. Infection spread simulation technology in a mixed state of multi variant viruses[J]. AIMS Public Health, 2022, 9(1): 17-25. doi: 10.3934/publichealth.2022002
ATLM (Apparent Time Lag Model) was extended to simulate the spread of infection in a mixed state of the variant virus and original wild type. It is applied to the 4th wave of infection spread in Tokyo, and (1) the 4th wave bottoms out near the end of the state of emergency, and the number of infected people increases again. (2) The rate of increase will be mainly by d strain (L452R) virus, while the increase by a strain (N501Y) virus will be suppressed. (3) It is anticipated that the infection will spread during the Olympic Games. (4) When variant viruses compete, the infection of highly infectious virus rises sharply while the infection by weakly infectious ones has converged. (5) It is effective as an infection control measure to find an infected person early and shorten the period from infection to quarantine by PCR test or antigen test as a measure other than the vaccine.

| [1] | Kermack WO, Mckendrick AG (1927) A Contribution To The Mathematical Theory Of Epidemics. Proc Royal Soi London 115: 700-721. |
| [2] |
Patel MD, Rosenstrom E, Ivy JS, et al. (2021) The Joint Impact of COVID-19 Vaccination and Non-Pharmaceutical Interventions on Infections, Hospitalizations, and Mortality: An Agent-Based Simulation. JAMA Netw Open 4: e2110782. doi: 10.1001/jamanetworkopen.2021.10782

|
| [3] |
Kuniya T, Inaba H (2020) Possible effects of mixed prevention strategy for COVID-19 epidemic: massive testing, quarantine and social distancing. AIMS Public Health 7: 490-503. doi: 10.3934/publichealth.2020040
|
| [4] |
Britton T, Ball F, Trapman P (2020) A mathematical model reveals the influence of population heterogeneity on herd immunity to SARS-CoV-2. Science 369: 846-849. doi: 10.1126/science.abc6810
|
| [5] |
Muñoz-Fernández GA, Seoane JM, Seoane-Sepúlveda JB (2021) A SIR-type model describing the successive waves of COVID-19. Chaos Solitons Fractals 144: 110682. doi: 10.1016/j.chaos.2021.110682
|
| [6] |
Biala TA, Khaliq AQM (2021) A fractional-order compartmental model for the spread of the COVID-19 pandemic. Commun Nonlinear Sci Numer Simul 98: 105764. doi: 10.1016/j.cnsns.2021.105764
|
| [7] | Erik Cuevas (2020) An agent-based model to evaluate the COVID-19 transmission risks in facilities. Comput Biol Med 121: 103827. |
| [8] | Pageaud S, Ponthus N, Gauchon R, et al. (2021) Adapting French COVID-19 vaccination campaign duration to variant dissemination. medRxiv . |
| [9] | Chang E, Moselle KA (2021) Agent-Based Simulation of COVID-19 Vaccination Policies in CovidSIMVL. medRxiv . |
| [10] | Alagoz O, Sethi A, Patterson B, et al. (2021) The Impact of Vaccination to Control COVID-19 Burden in the United States: A Simulation Modeling Approach. medRxiv . |
| [11] |
Truszkowska A, Behring B, Hasanyan J, et al. (2021) High-Resolution Agent-Based Modeling of COVID-19 Spreading in a Small Town. Adv Theor Simul 4: 2000277. doi: 10.1002/adts.202000277
|
| [12] |
Utamura M, Koizumi M, Kirikami S (2020) An Epidemiological Model Considering Isolation to Predict COVID-19 Trends in Tokyo, Japan: Numerical Analysis. JMIR Public Health Surveill 6: e23624. doi: 10.2196/23624
|
| [13] | Utamura M, Koizumi M, Kirikami S (2021) A novel deterministic epidemic model considering mass vaccination and lockdown against COVID-19 spread in Israel: Numerical study. medRxiv . |
| [14] | Characteristics and latest information of mutant viruses Available from: https://www3.nhk.or.jp/news/special/coronavirus/newvariant/. |
| [15] | Updates on COVID-19 in Tokyo Available from: https://stopcovid19.metro.tokyo.lg.jp/en/. |
 publichealth-09-01-002-s001.pdf publichealth-09-01-002-s001.pdf |
 |
Figures(4) / Tables(2)

Makoto Koizumi, Motoaki Utamura, Seiichi Kirikami. Infection spread simulation technology in a mixed state of multi variant viruses[J]. AIMS Public Health, 2022, 9(1): 17-25. doi: 10.3934/publichealth.2022002


 DownLoad: