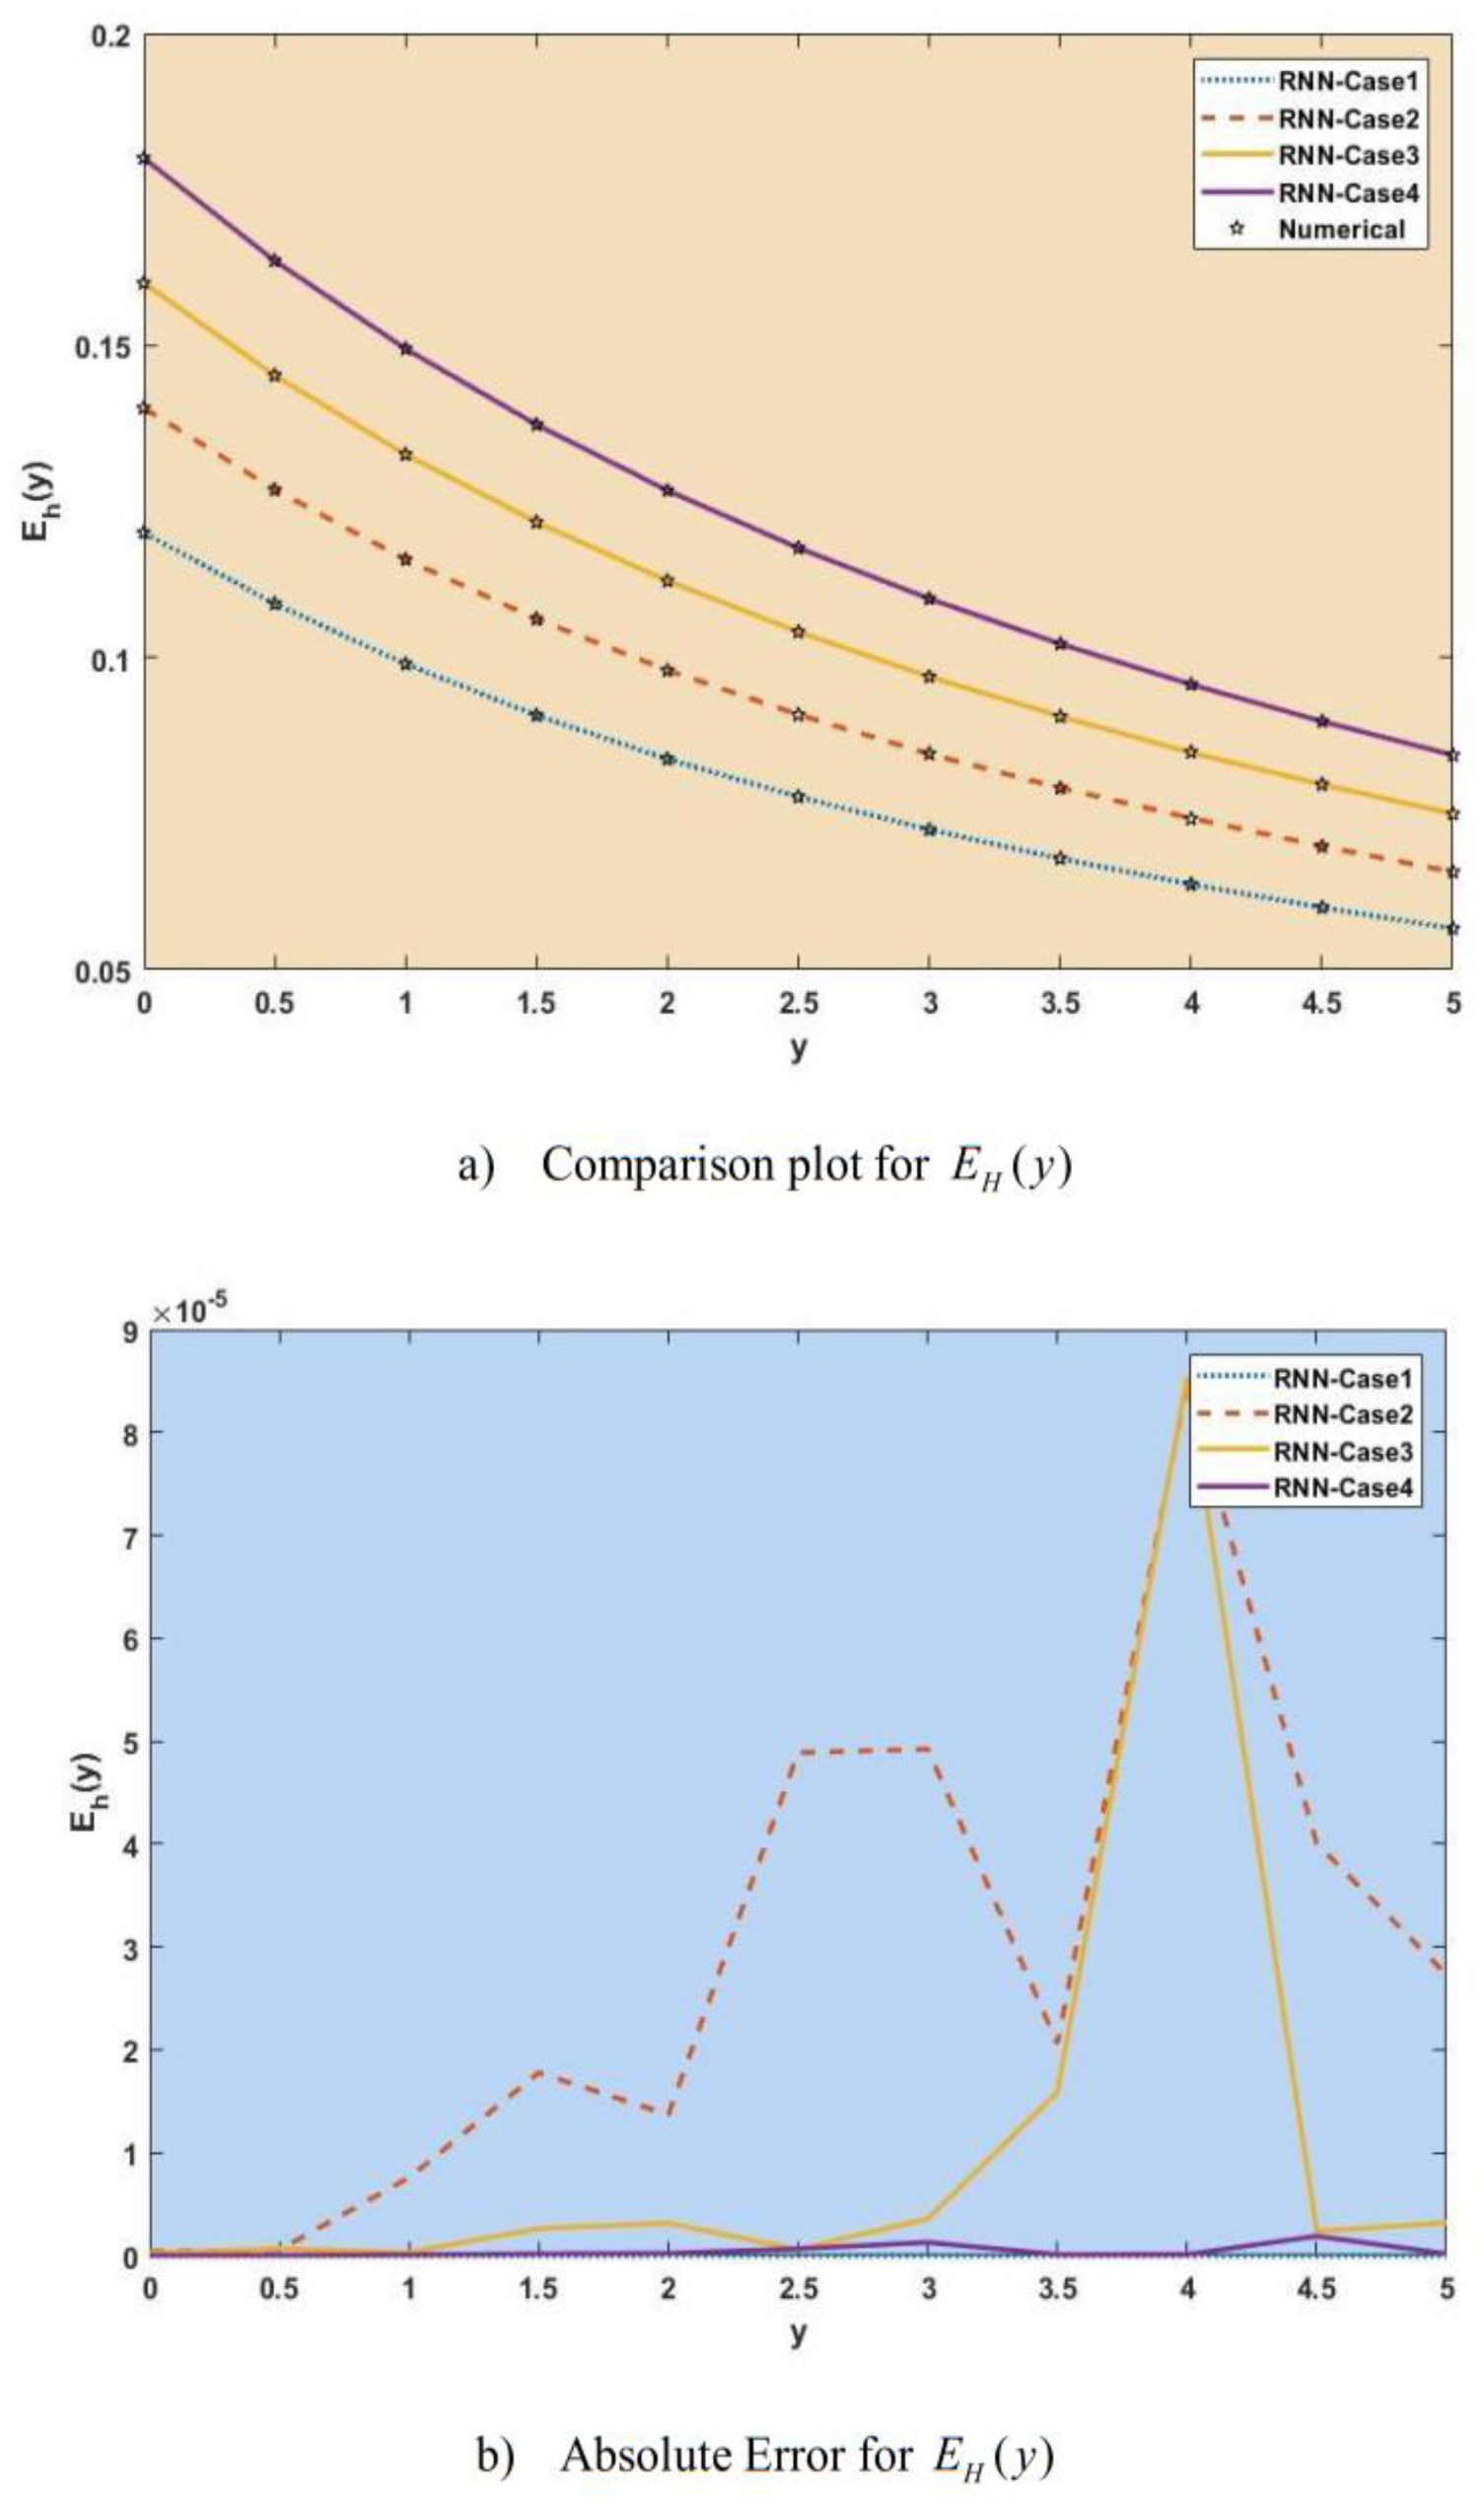
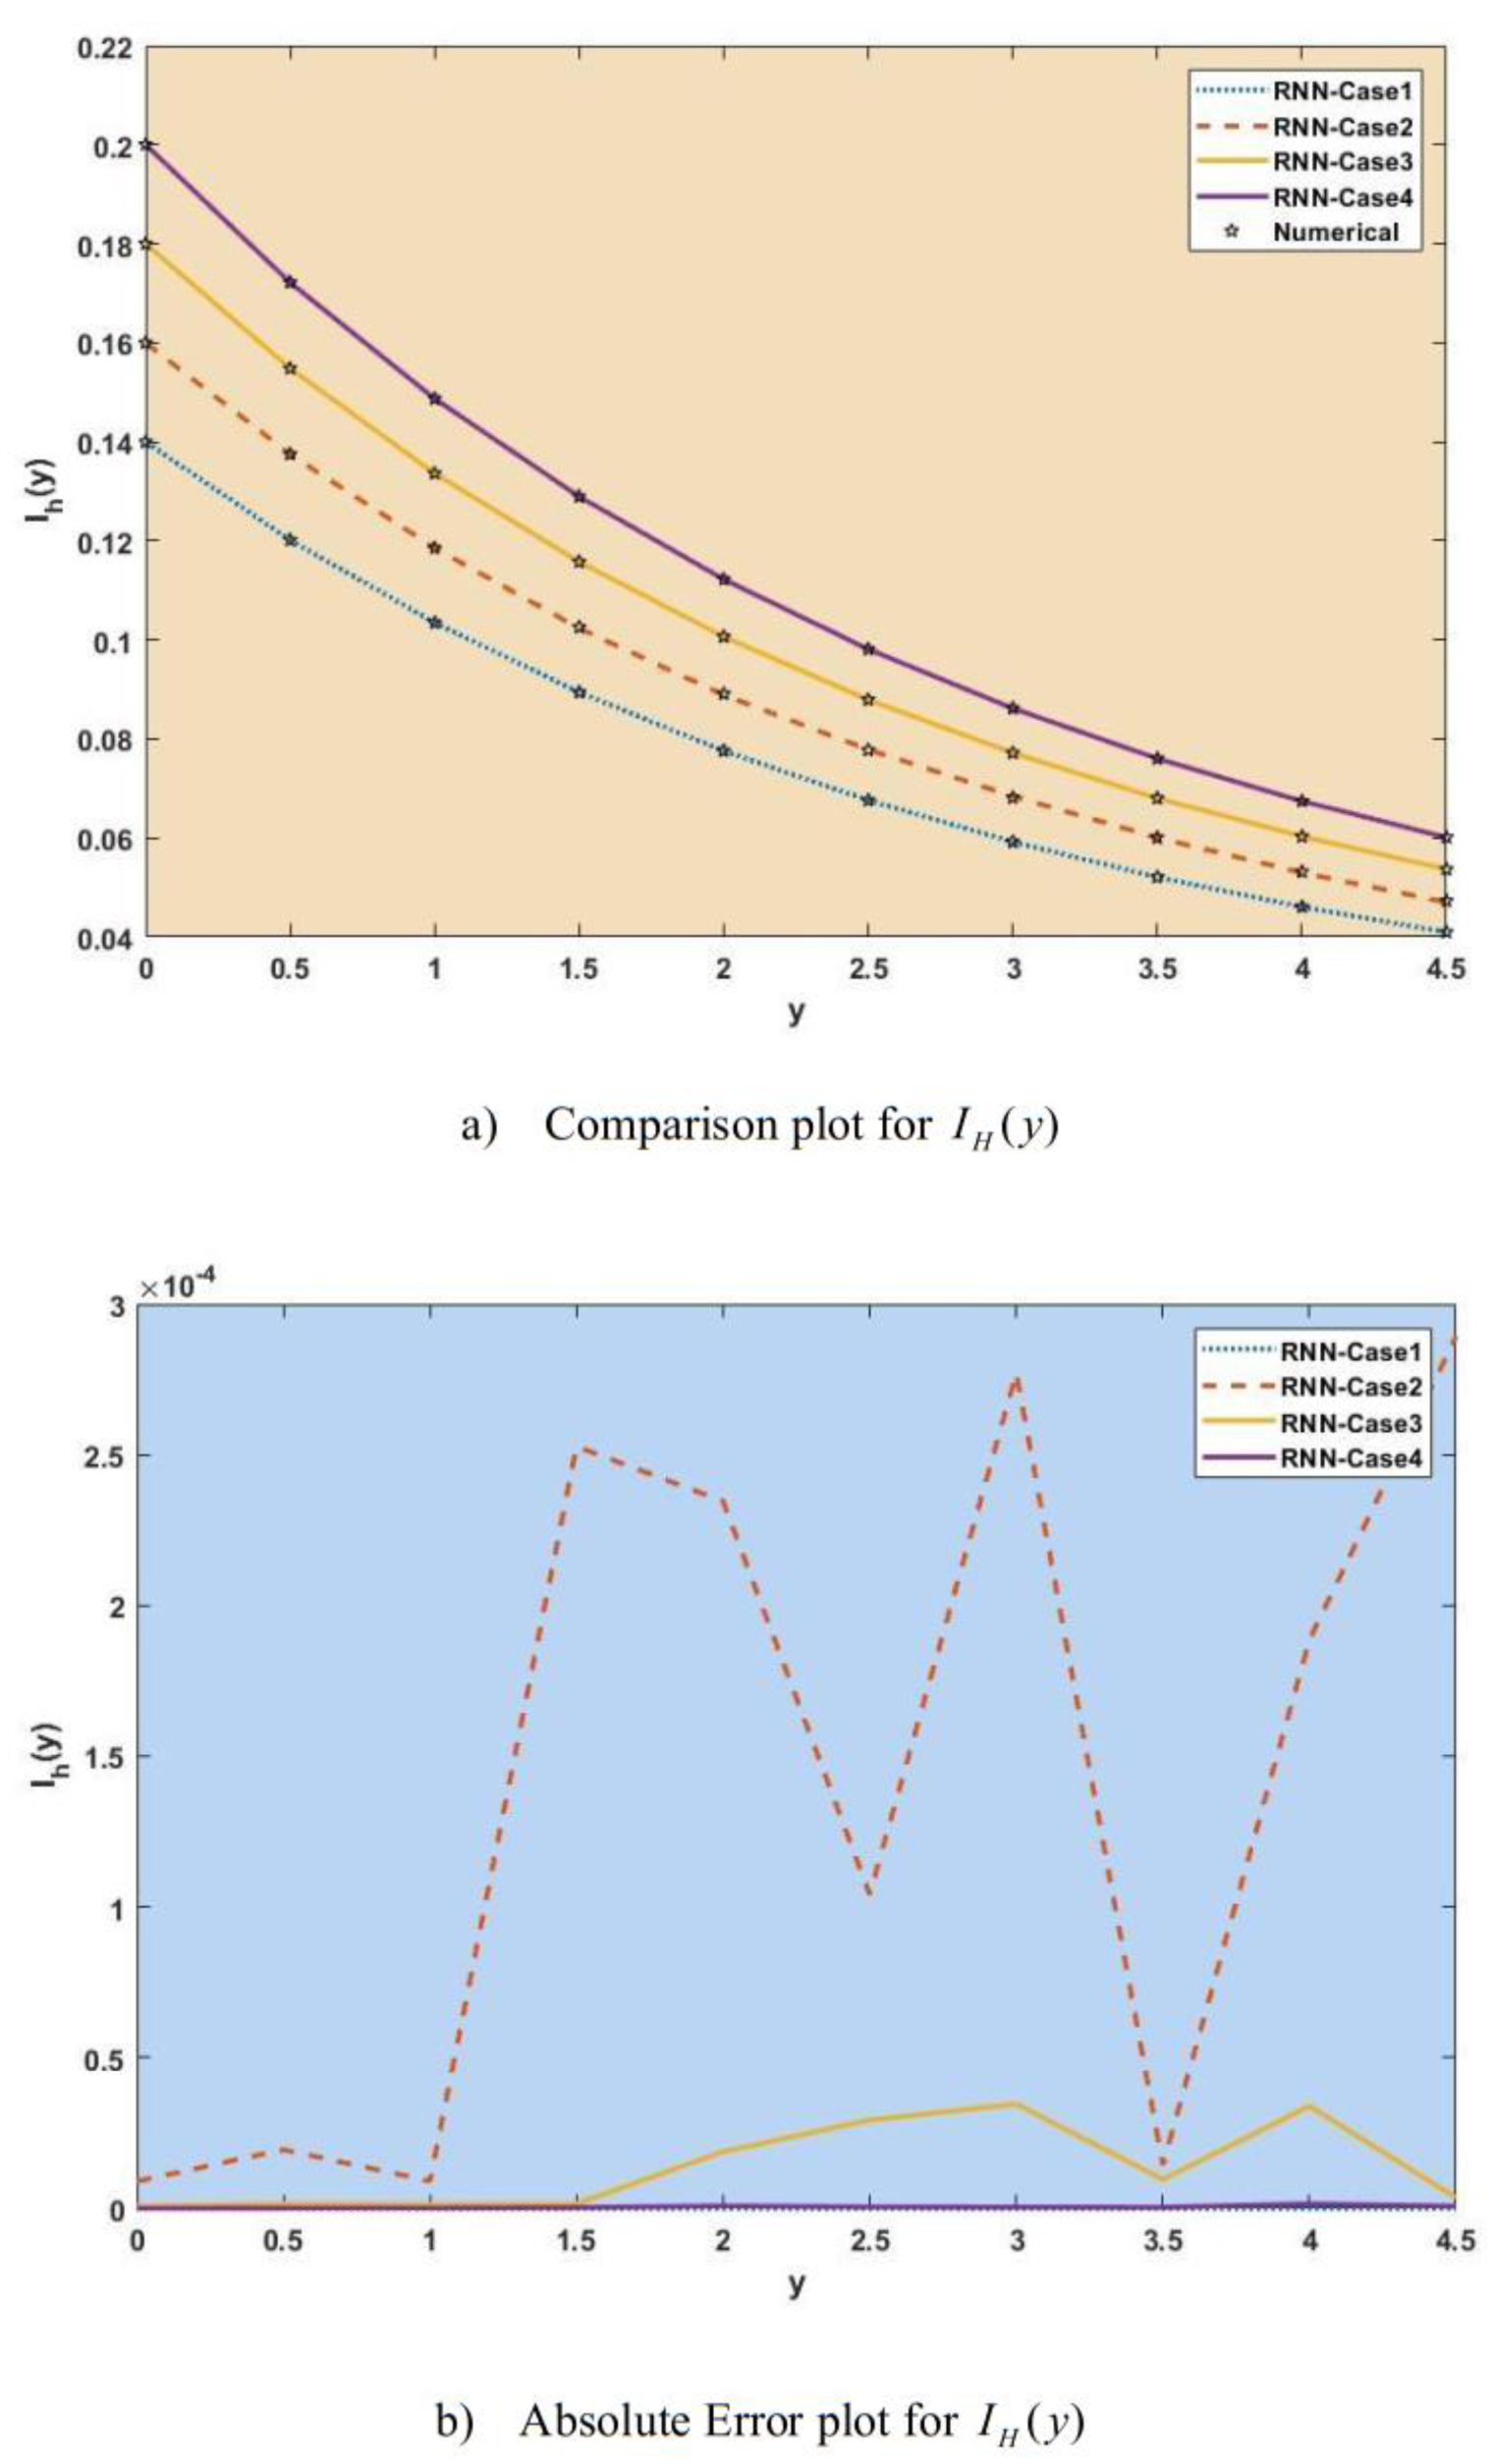
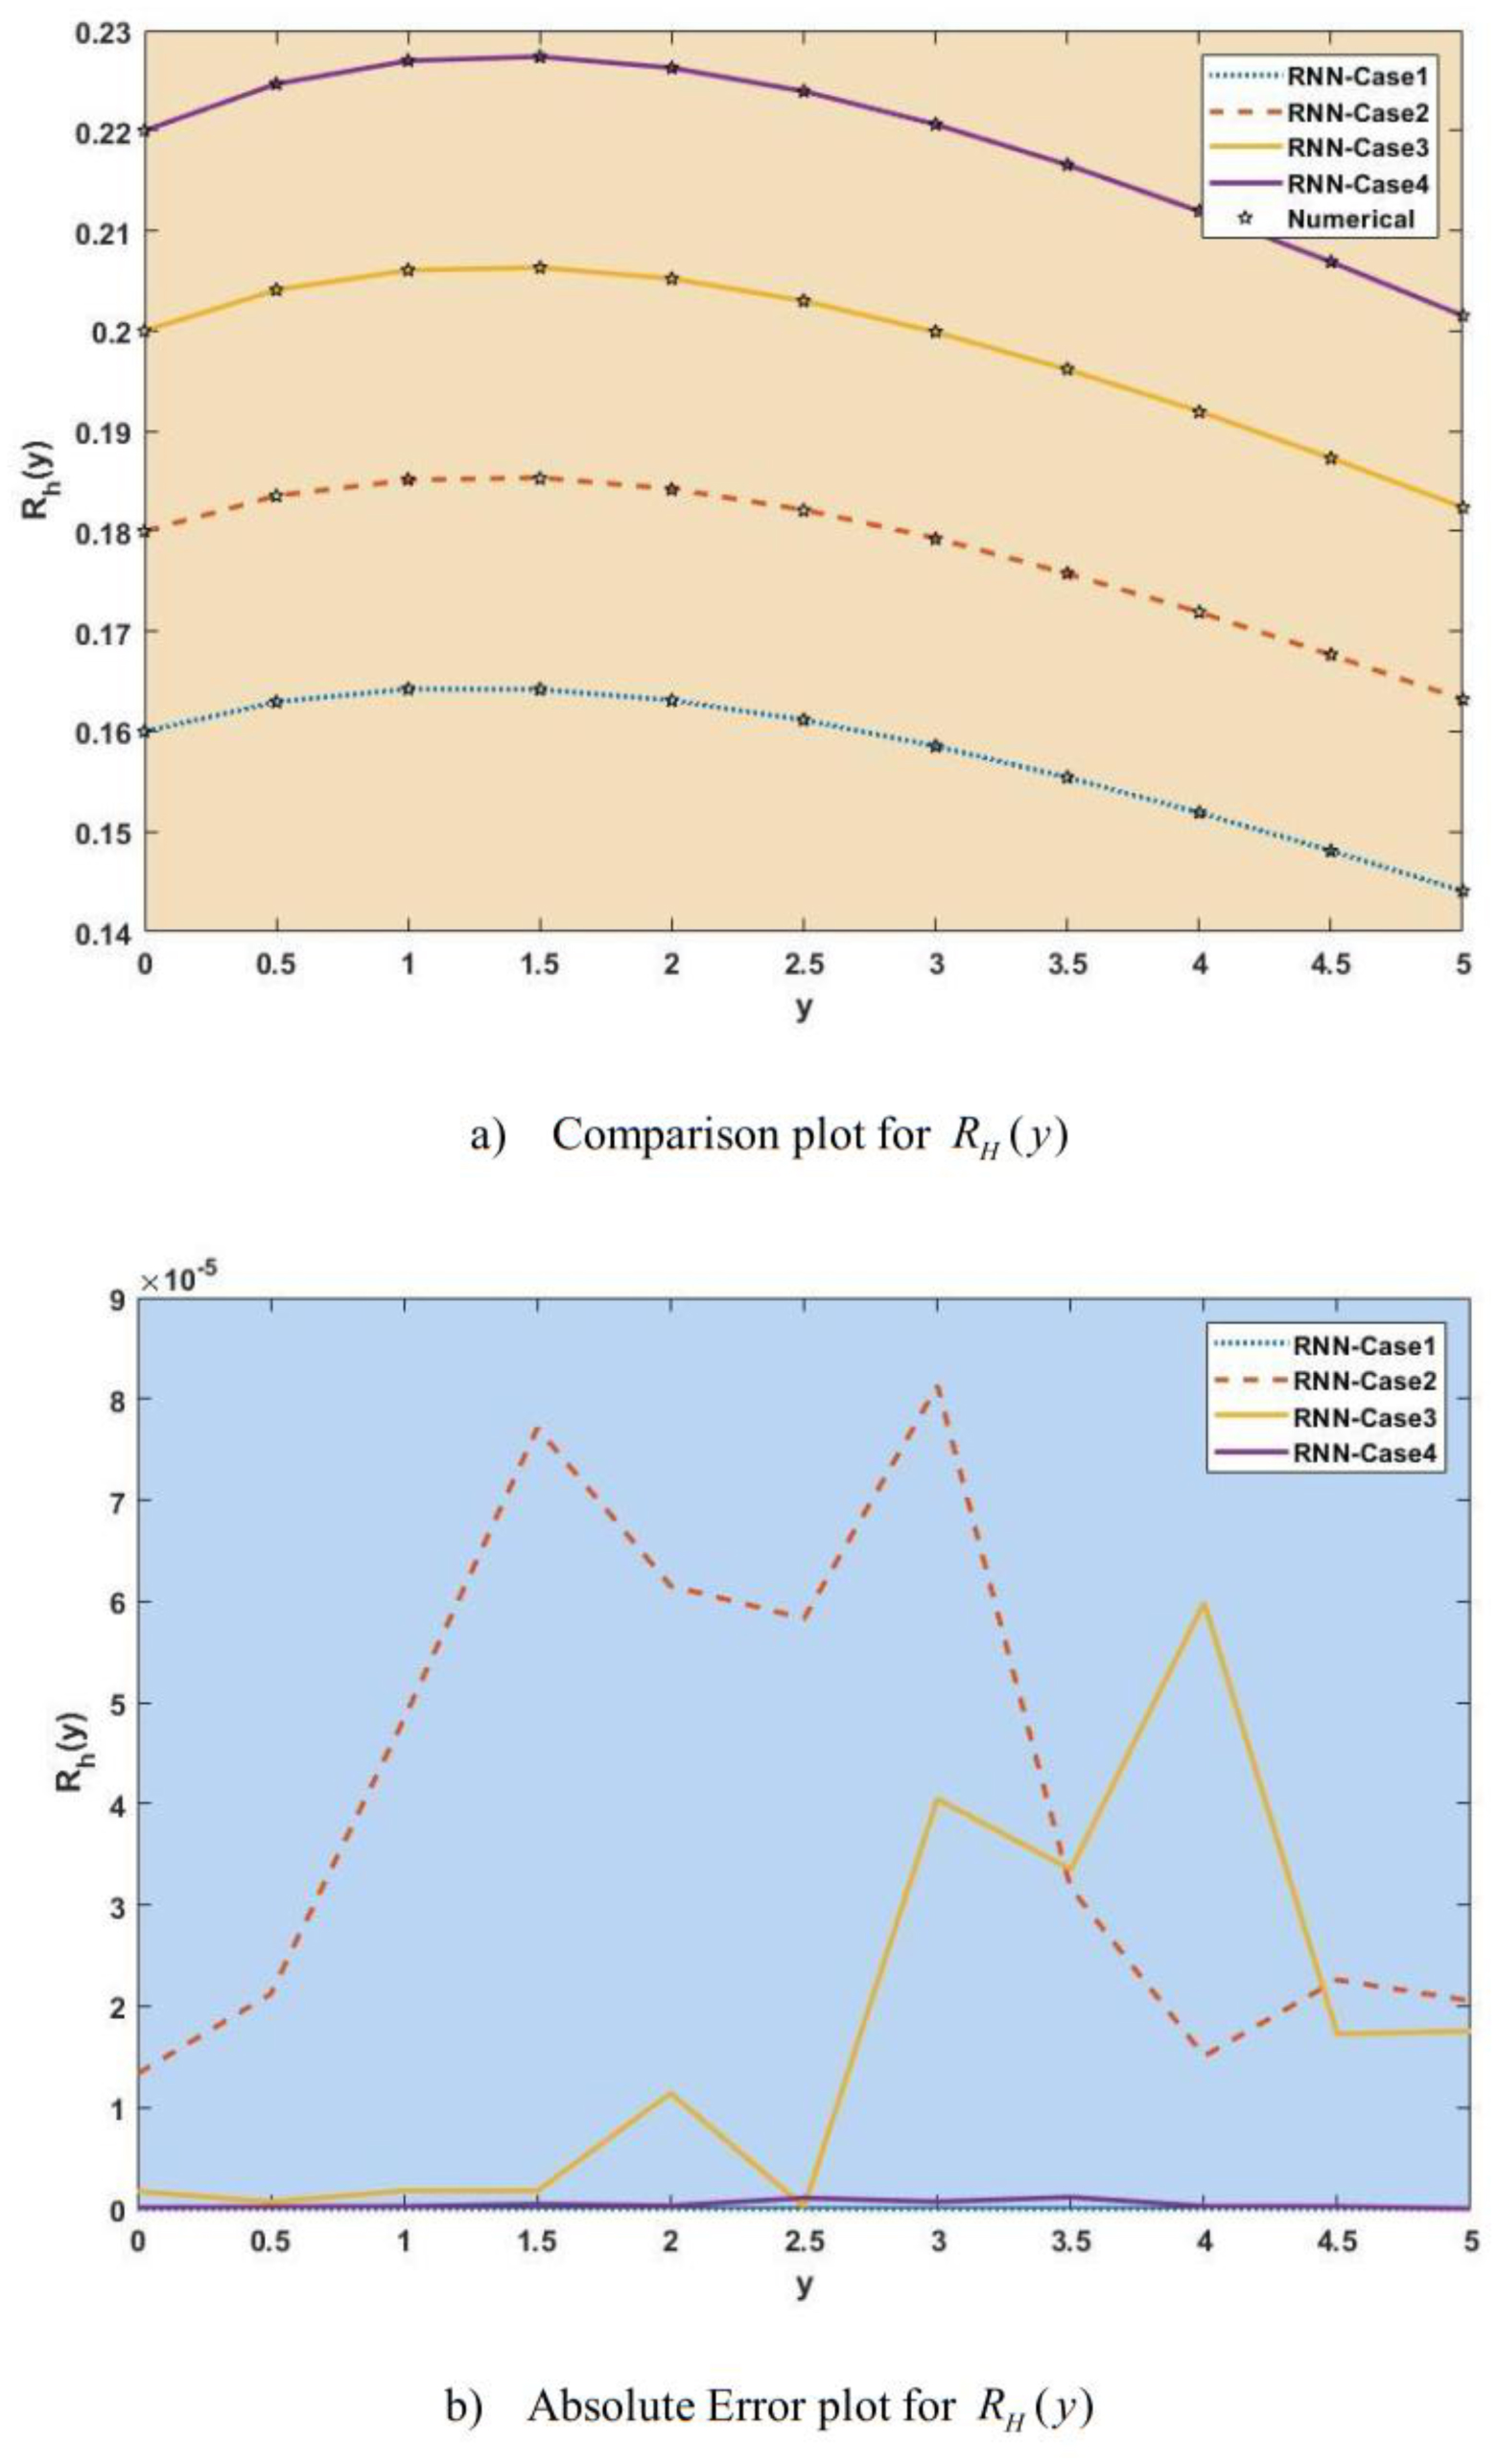
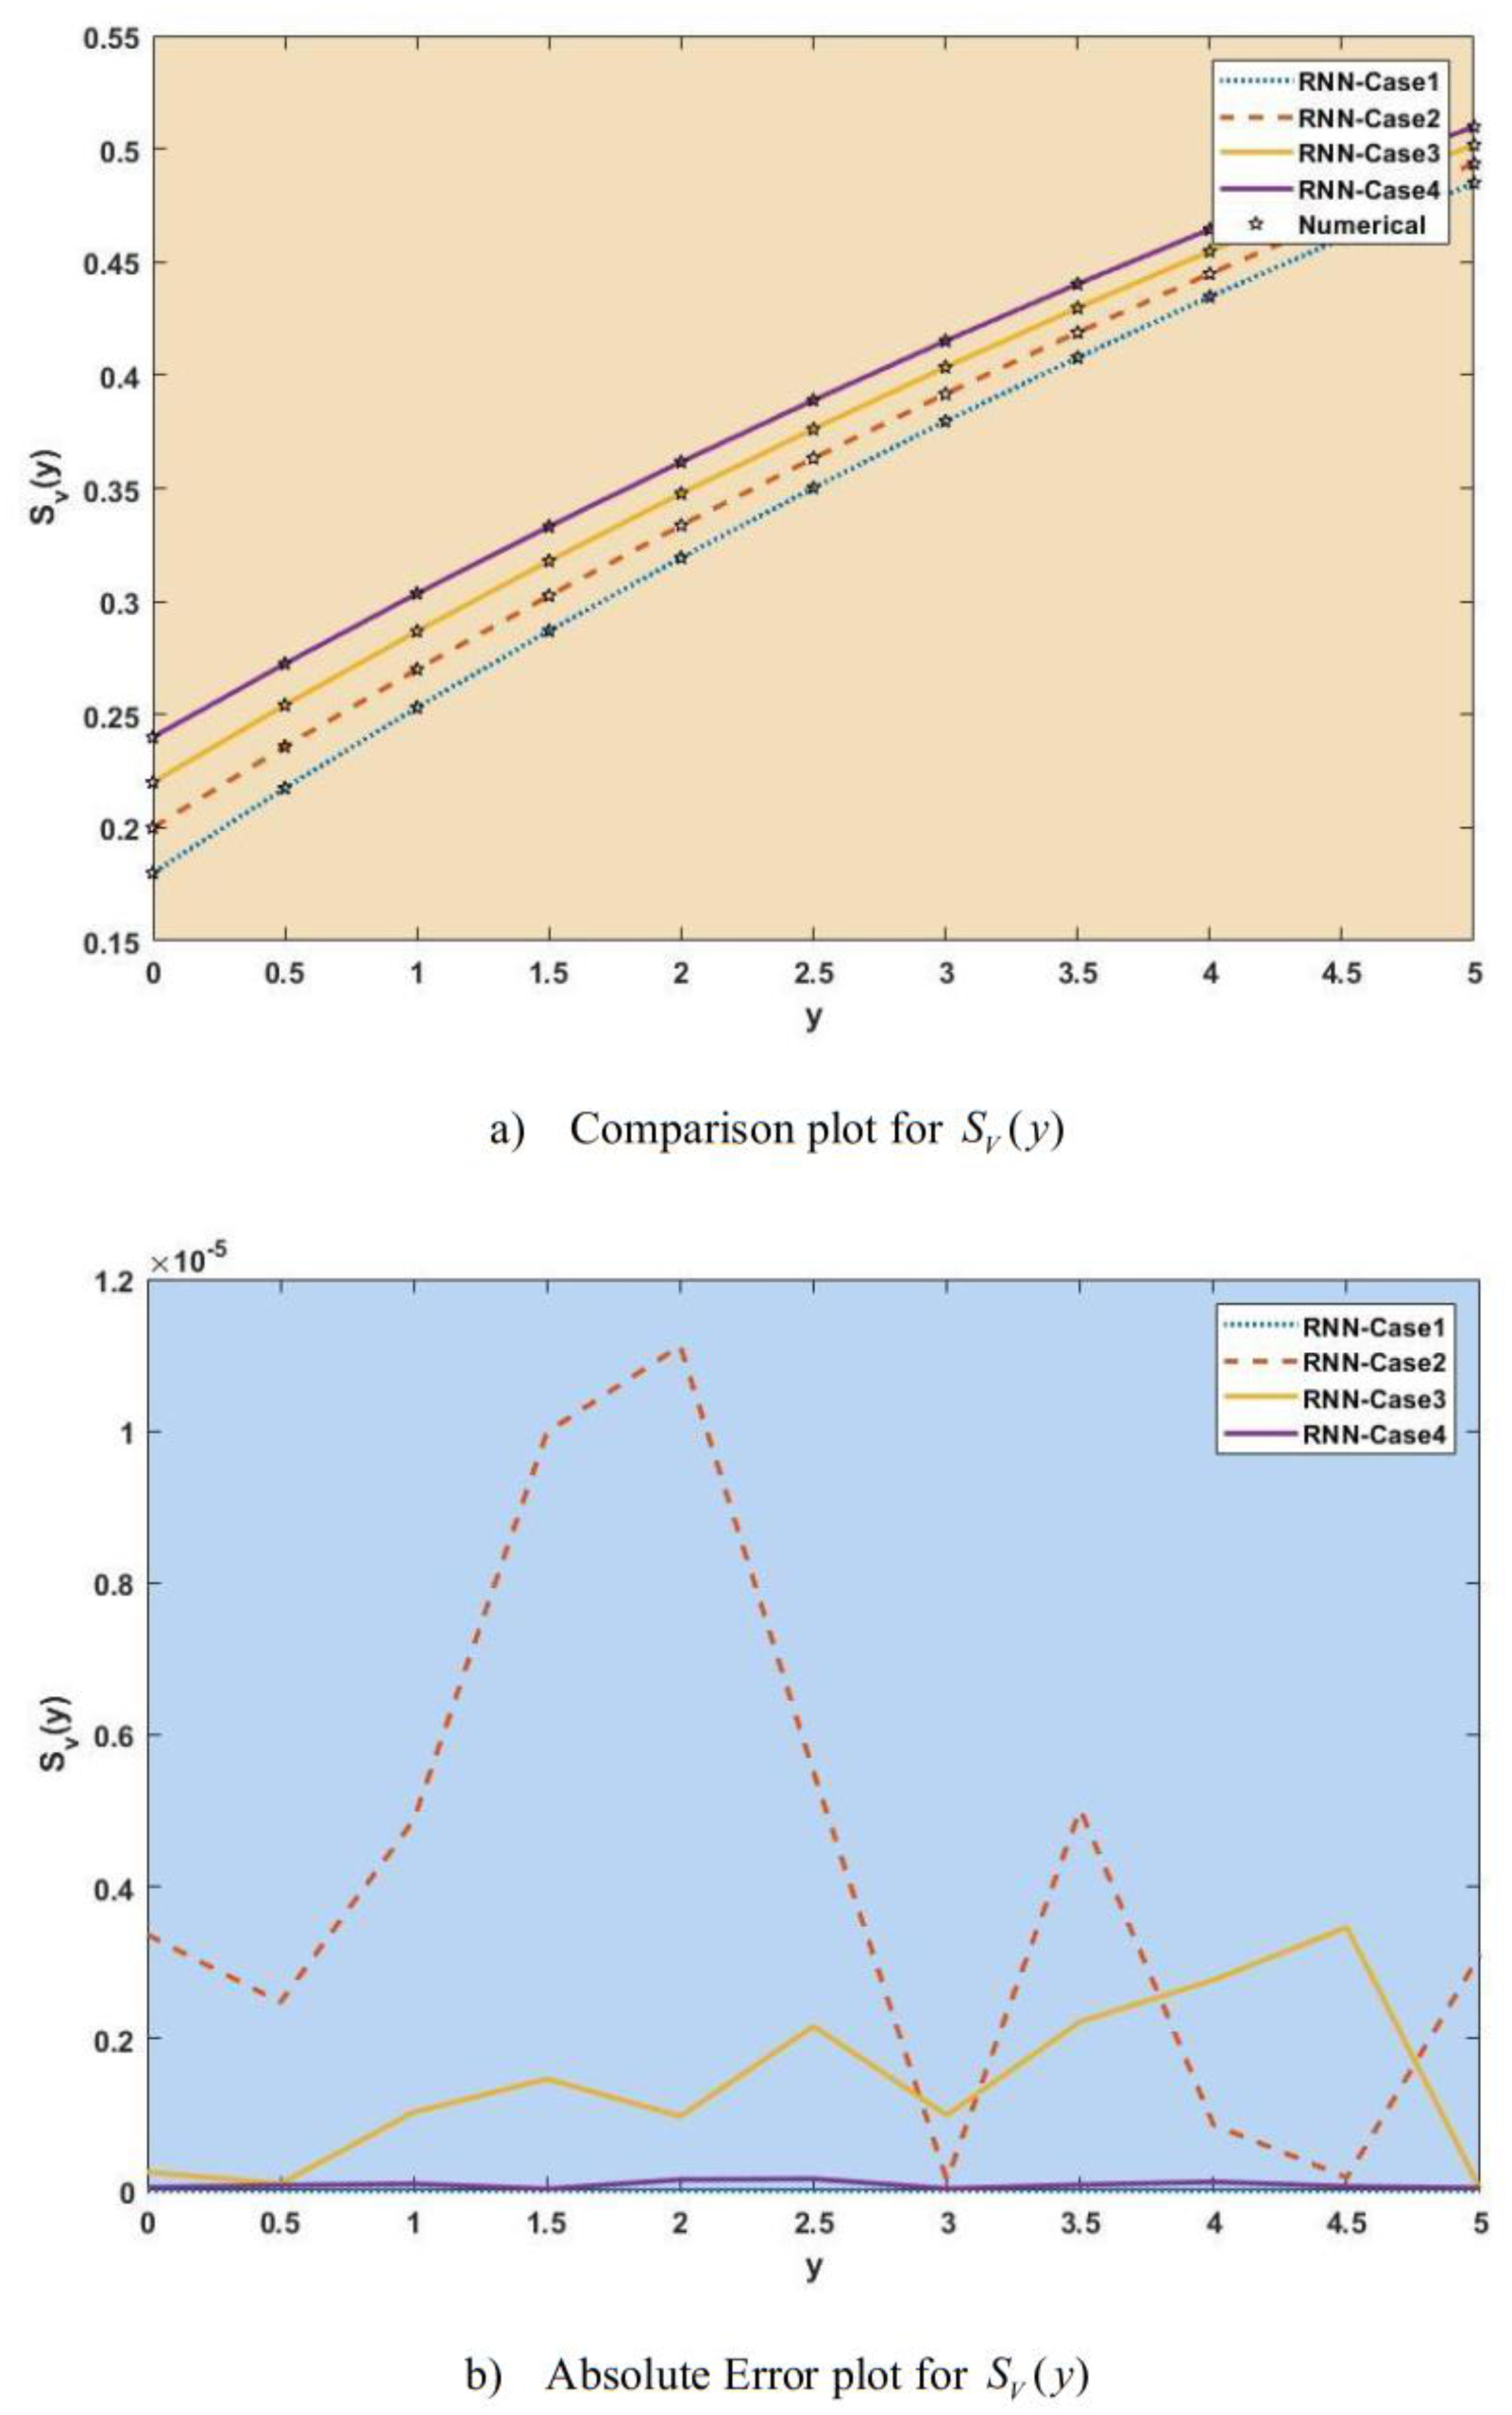
Recurrent Neural Networks (RNNs), a type of machine learning technique, have recently drawn a lot of interest in numerous fields, including epidemiology. Implementing public health interventions in the field of epidemiology depends on efficient modeling and outbreak prediction. Because RNNs can capture sequential dependencies in data, they have become highly effective tools in this field. In this paper, the use of RNNs in epidemic modeling is examined, with a focus on the extent to which they can handle the inherent temporal dynamics in the spread of diseases. The mathematical representation of epidemics requires taking time-dependent variables into account, such as the rate at which infections spread and the long-term effects of interventions. The goal of this study is to use an intelligent computing solution based on RNNs to provide numerical performances and interpretations for the SEIR nonlinear system based on the propagation of the Zika virus (SEIRS-PZV) model. The four patient dynamics, namely susceptible patients S(y), exposed patients admitted in a hospital E(y), the fraction of infective individuals I(y), and recovered patients R(y), are represented by the epidemic version of the nonlinear system, or the SEIR model. SEIRS-PZV is represented by ordinary differential equations (ODEs), which are then solved by the Adams method using the Mathematica software to generate a dataset. The dataset was used as an output for the RNN to train the model and examine results such as regressions, correlations, error histograms, etc. For RNN, we used 100% to train the model with 15 hidden layers and a delay of 2 seconds. The input for the RNN is a time series sequence from 0 to 5, with a step size of 0.05. In the end, we compared the approximated solution with the exact solution by plotting them on the same graph and generating the absolute error plot for each of the 4 cases of SEIRS-PZV. Predictions made by the model appeared to be become more accurate when the mean squared error (MSE) decreased. An increased fit to the observed data was suggested by this decrease in the MSE, which suggested that the variance between the model's predicted values and the actual values was dropping. A minimal absolute error almost equal to zero was obtained, which further supports the usefulness of the suggested strategy. A small absolute error shows the degree to which the model's predictions matches the ground truth values, thus indicating the level of accuracy and precision for the model's output.
Citation: Kottakkaran Sooppy Nisar, Muhammad Wajahat Anjum, Muhammad Asif Zahoor Raja, Muhammad Shoaib. Recurrent neural network for the dynamics of Zika virus spreading[J]. AIMS Public Health, 2024, 11(2): 432-458. doi: 10.3934/publichealth.2024022
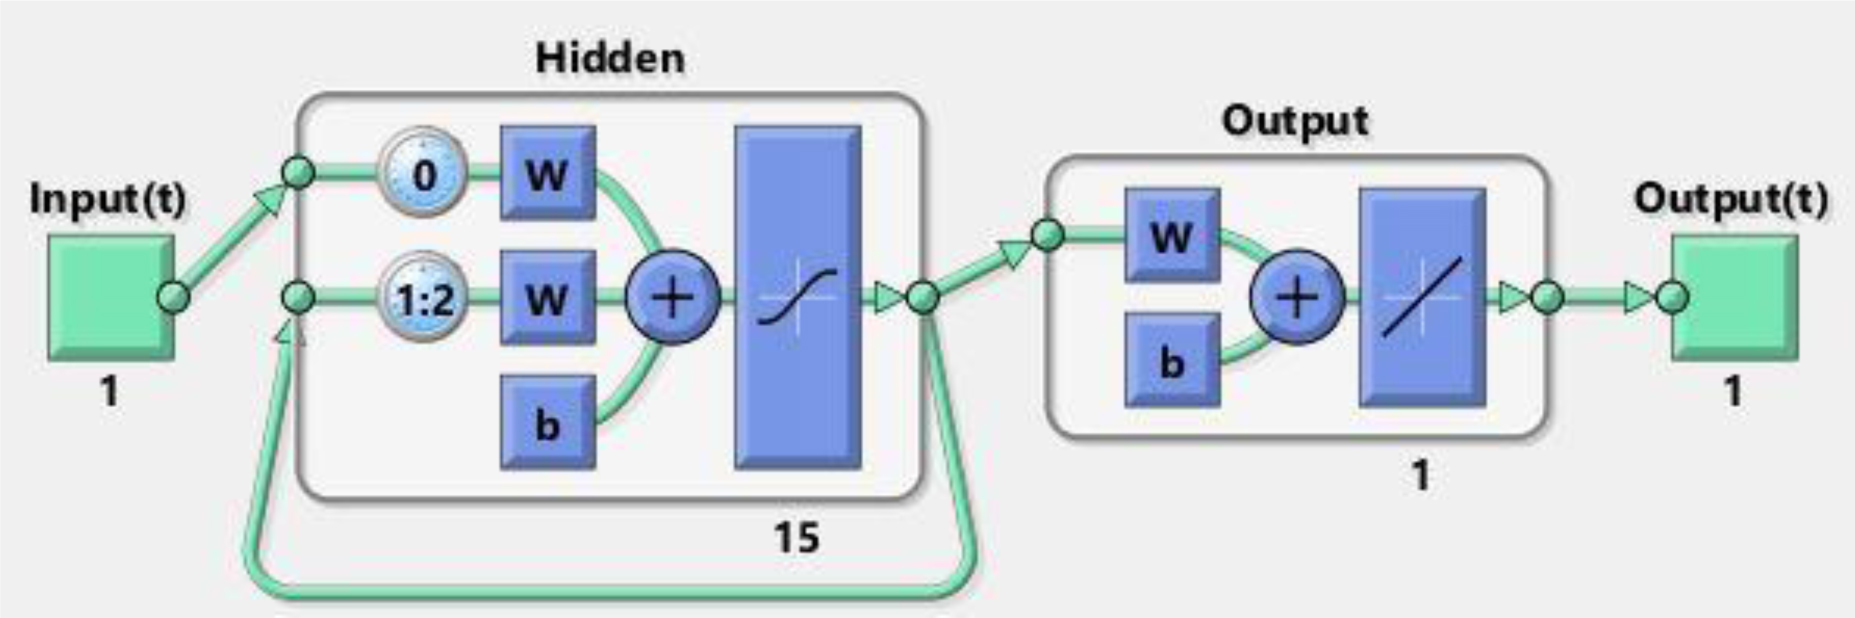
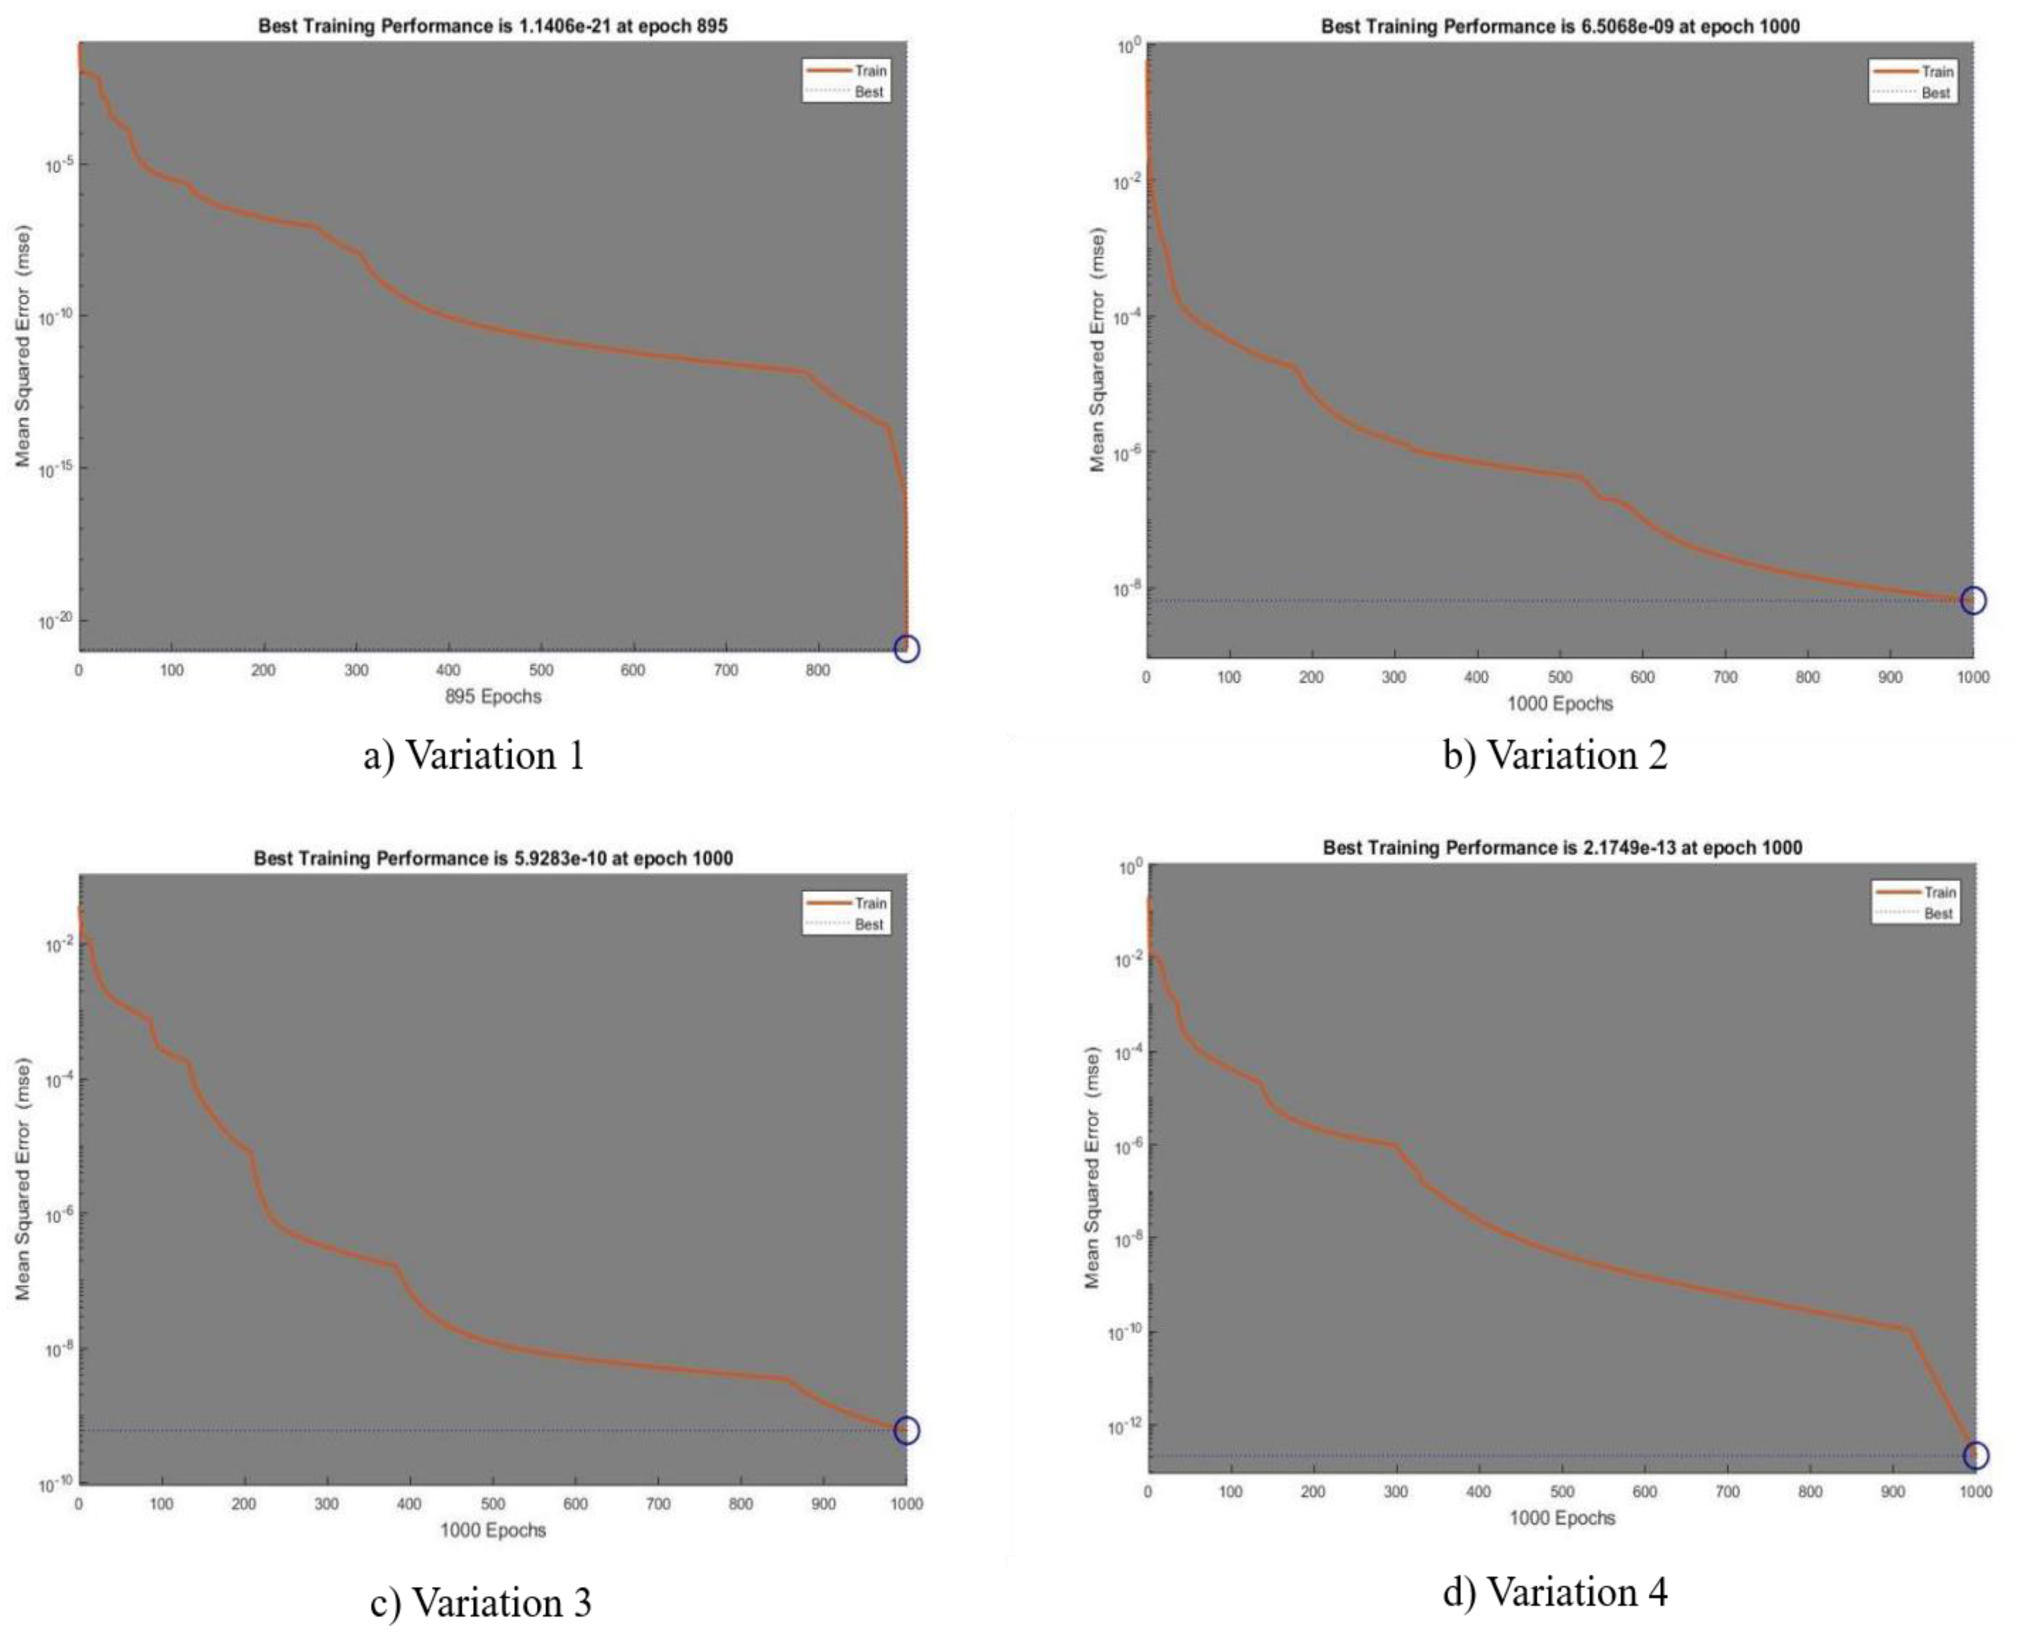
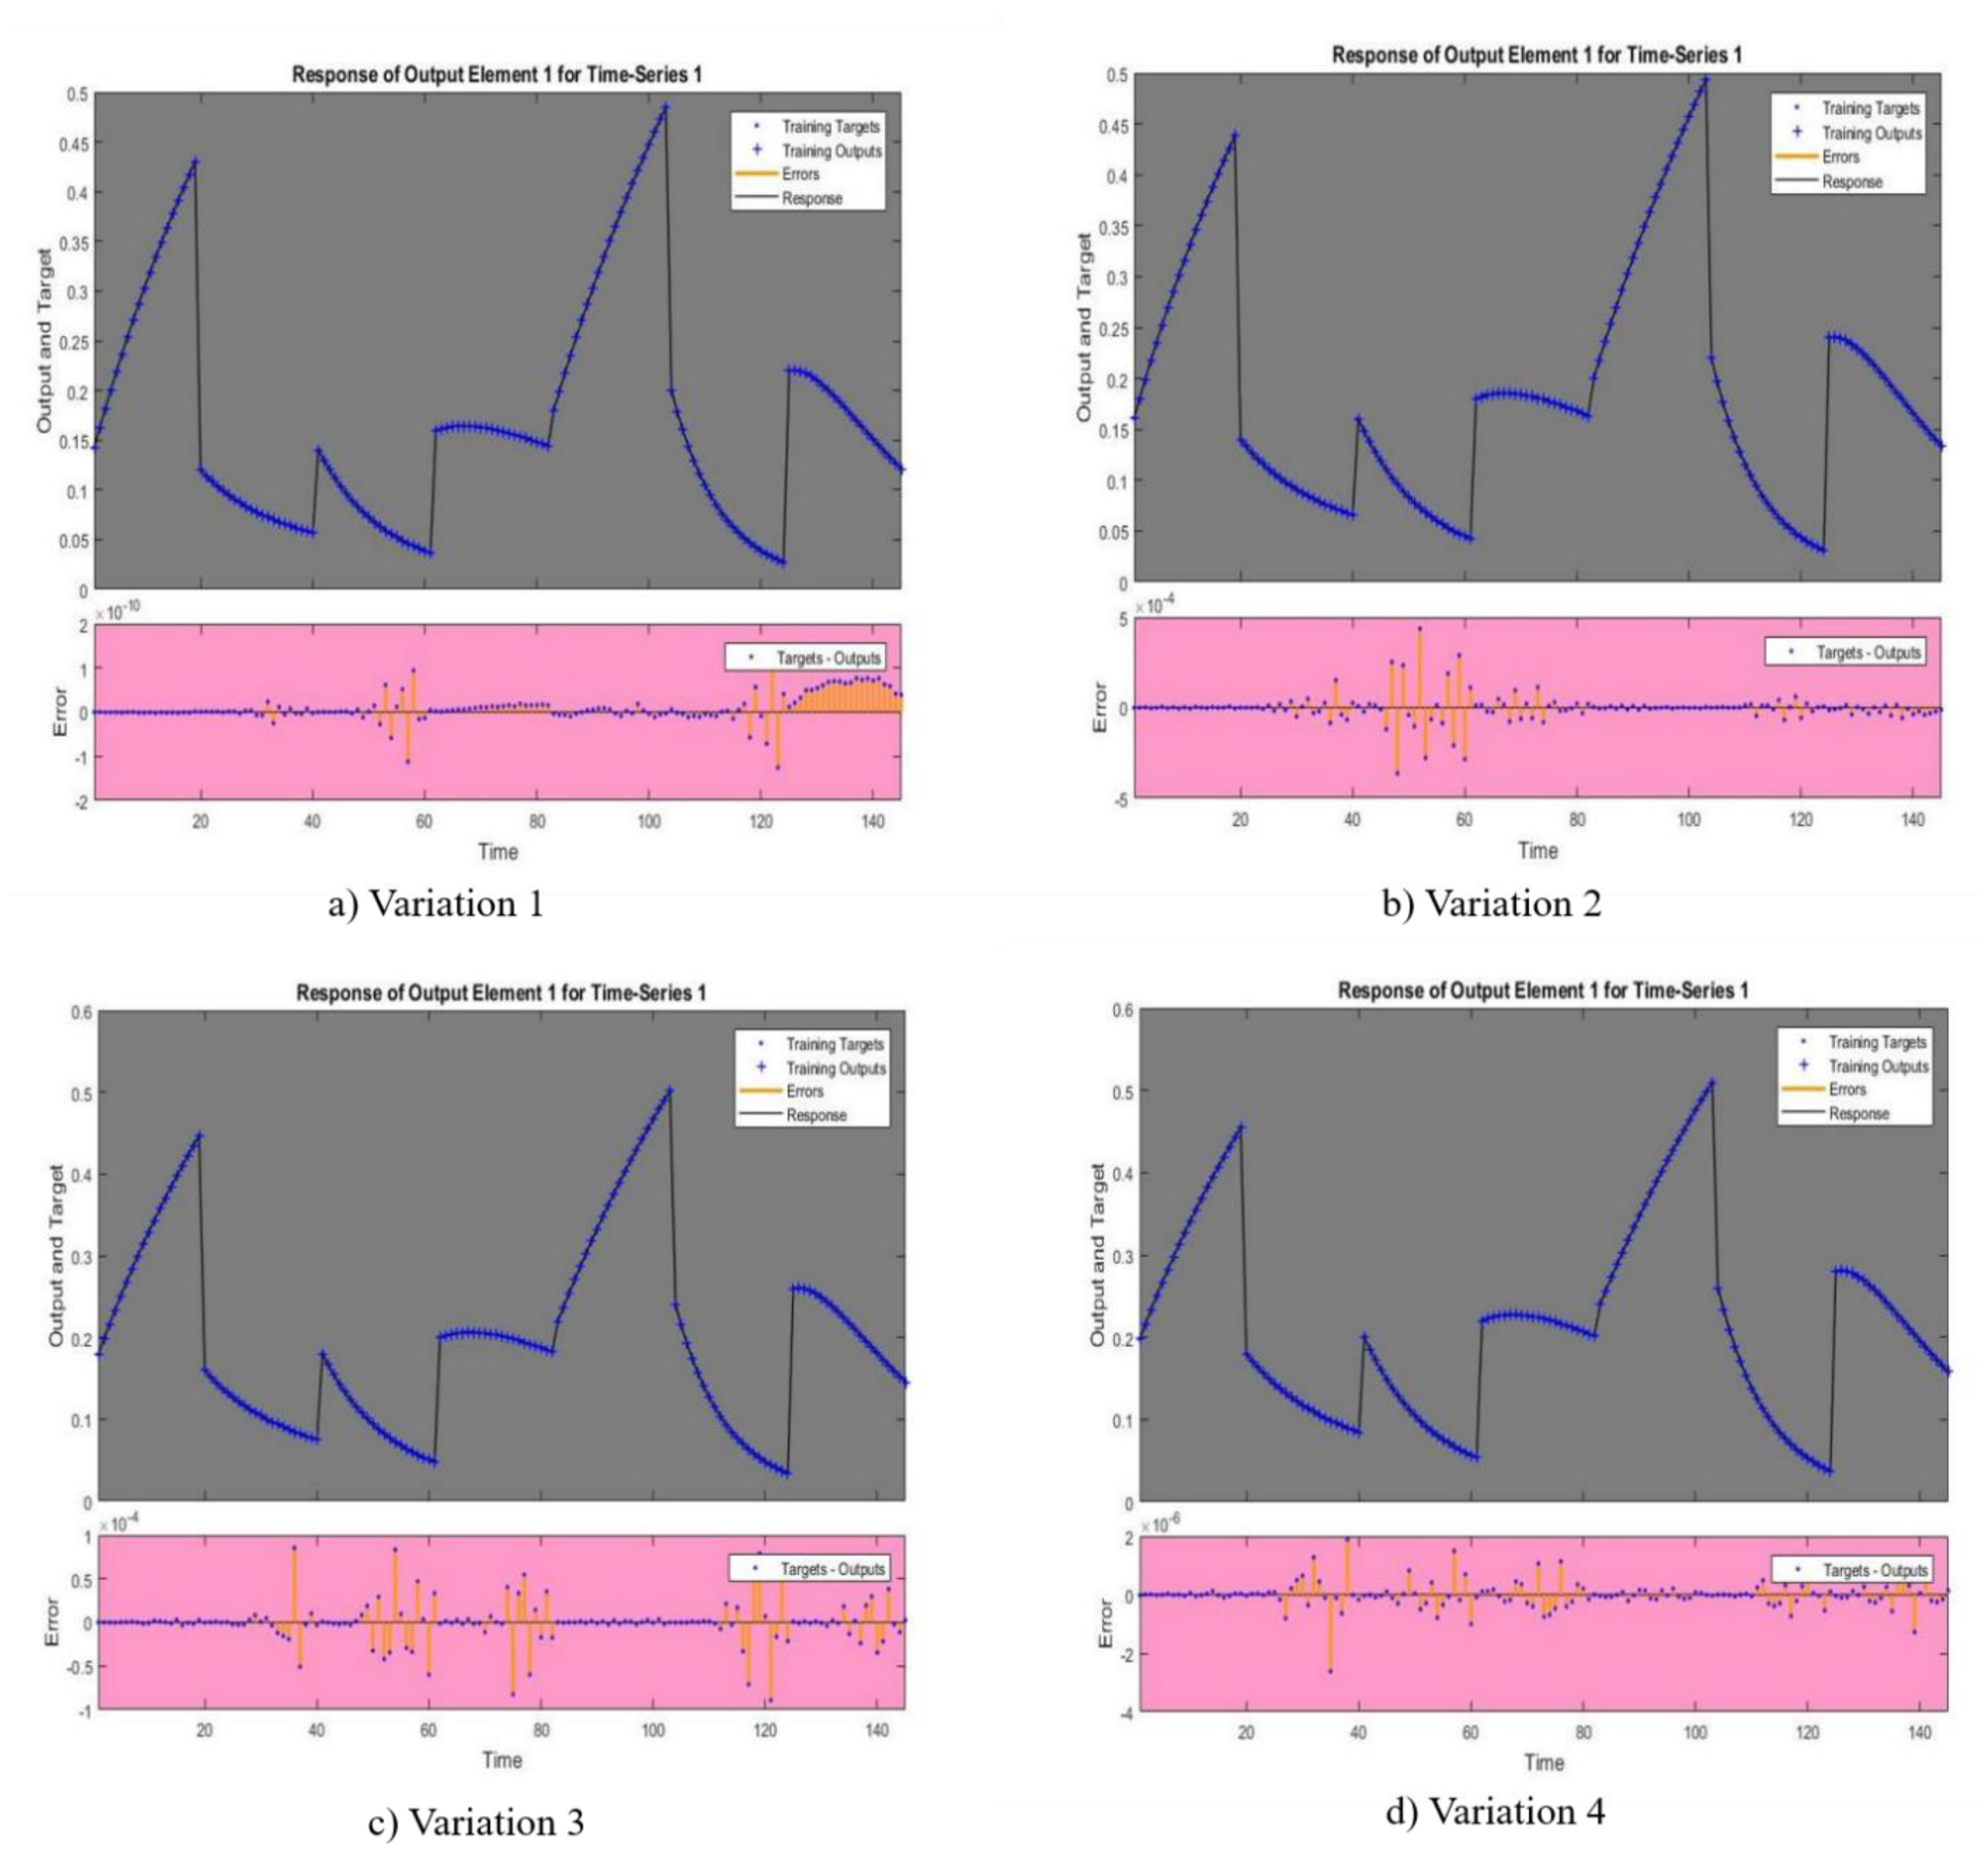
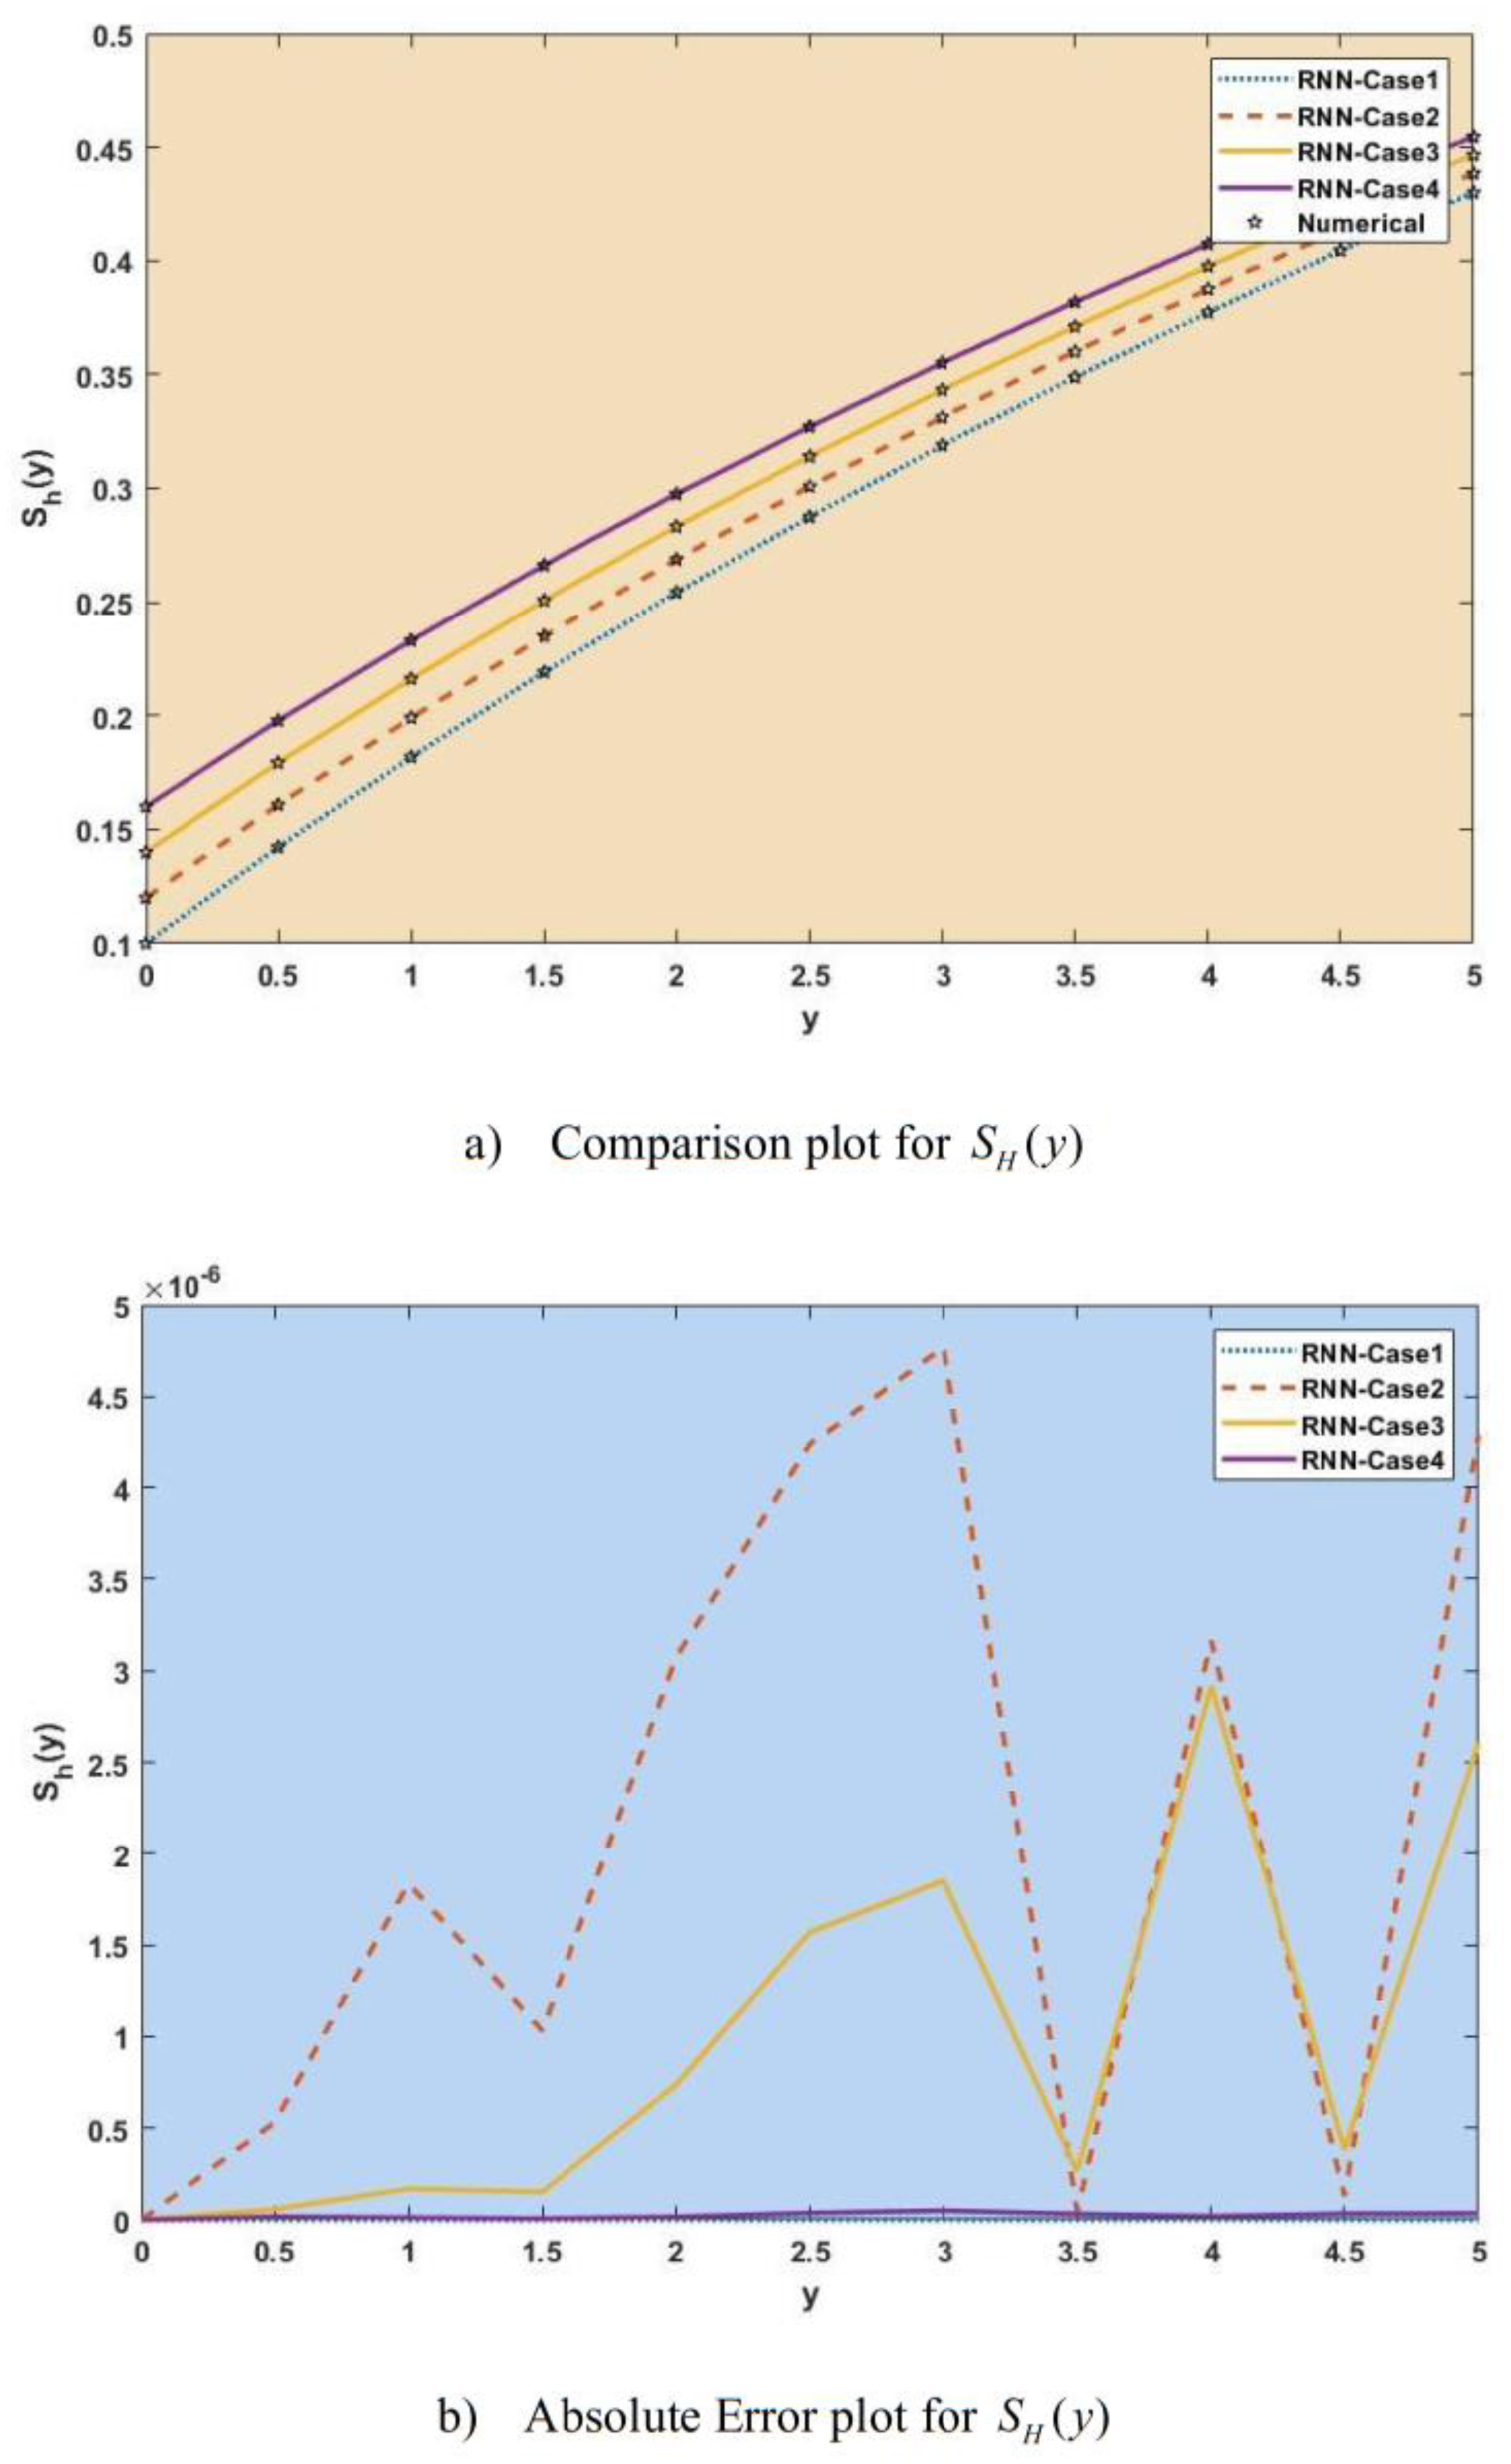
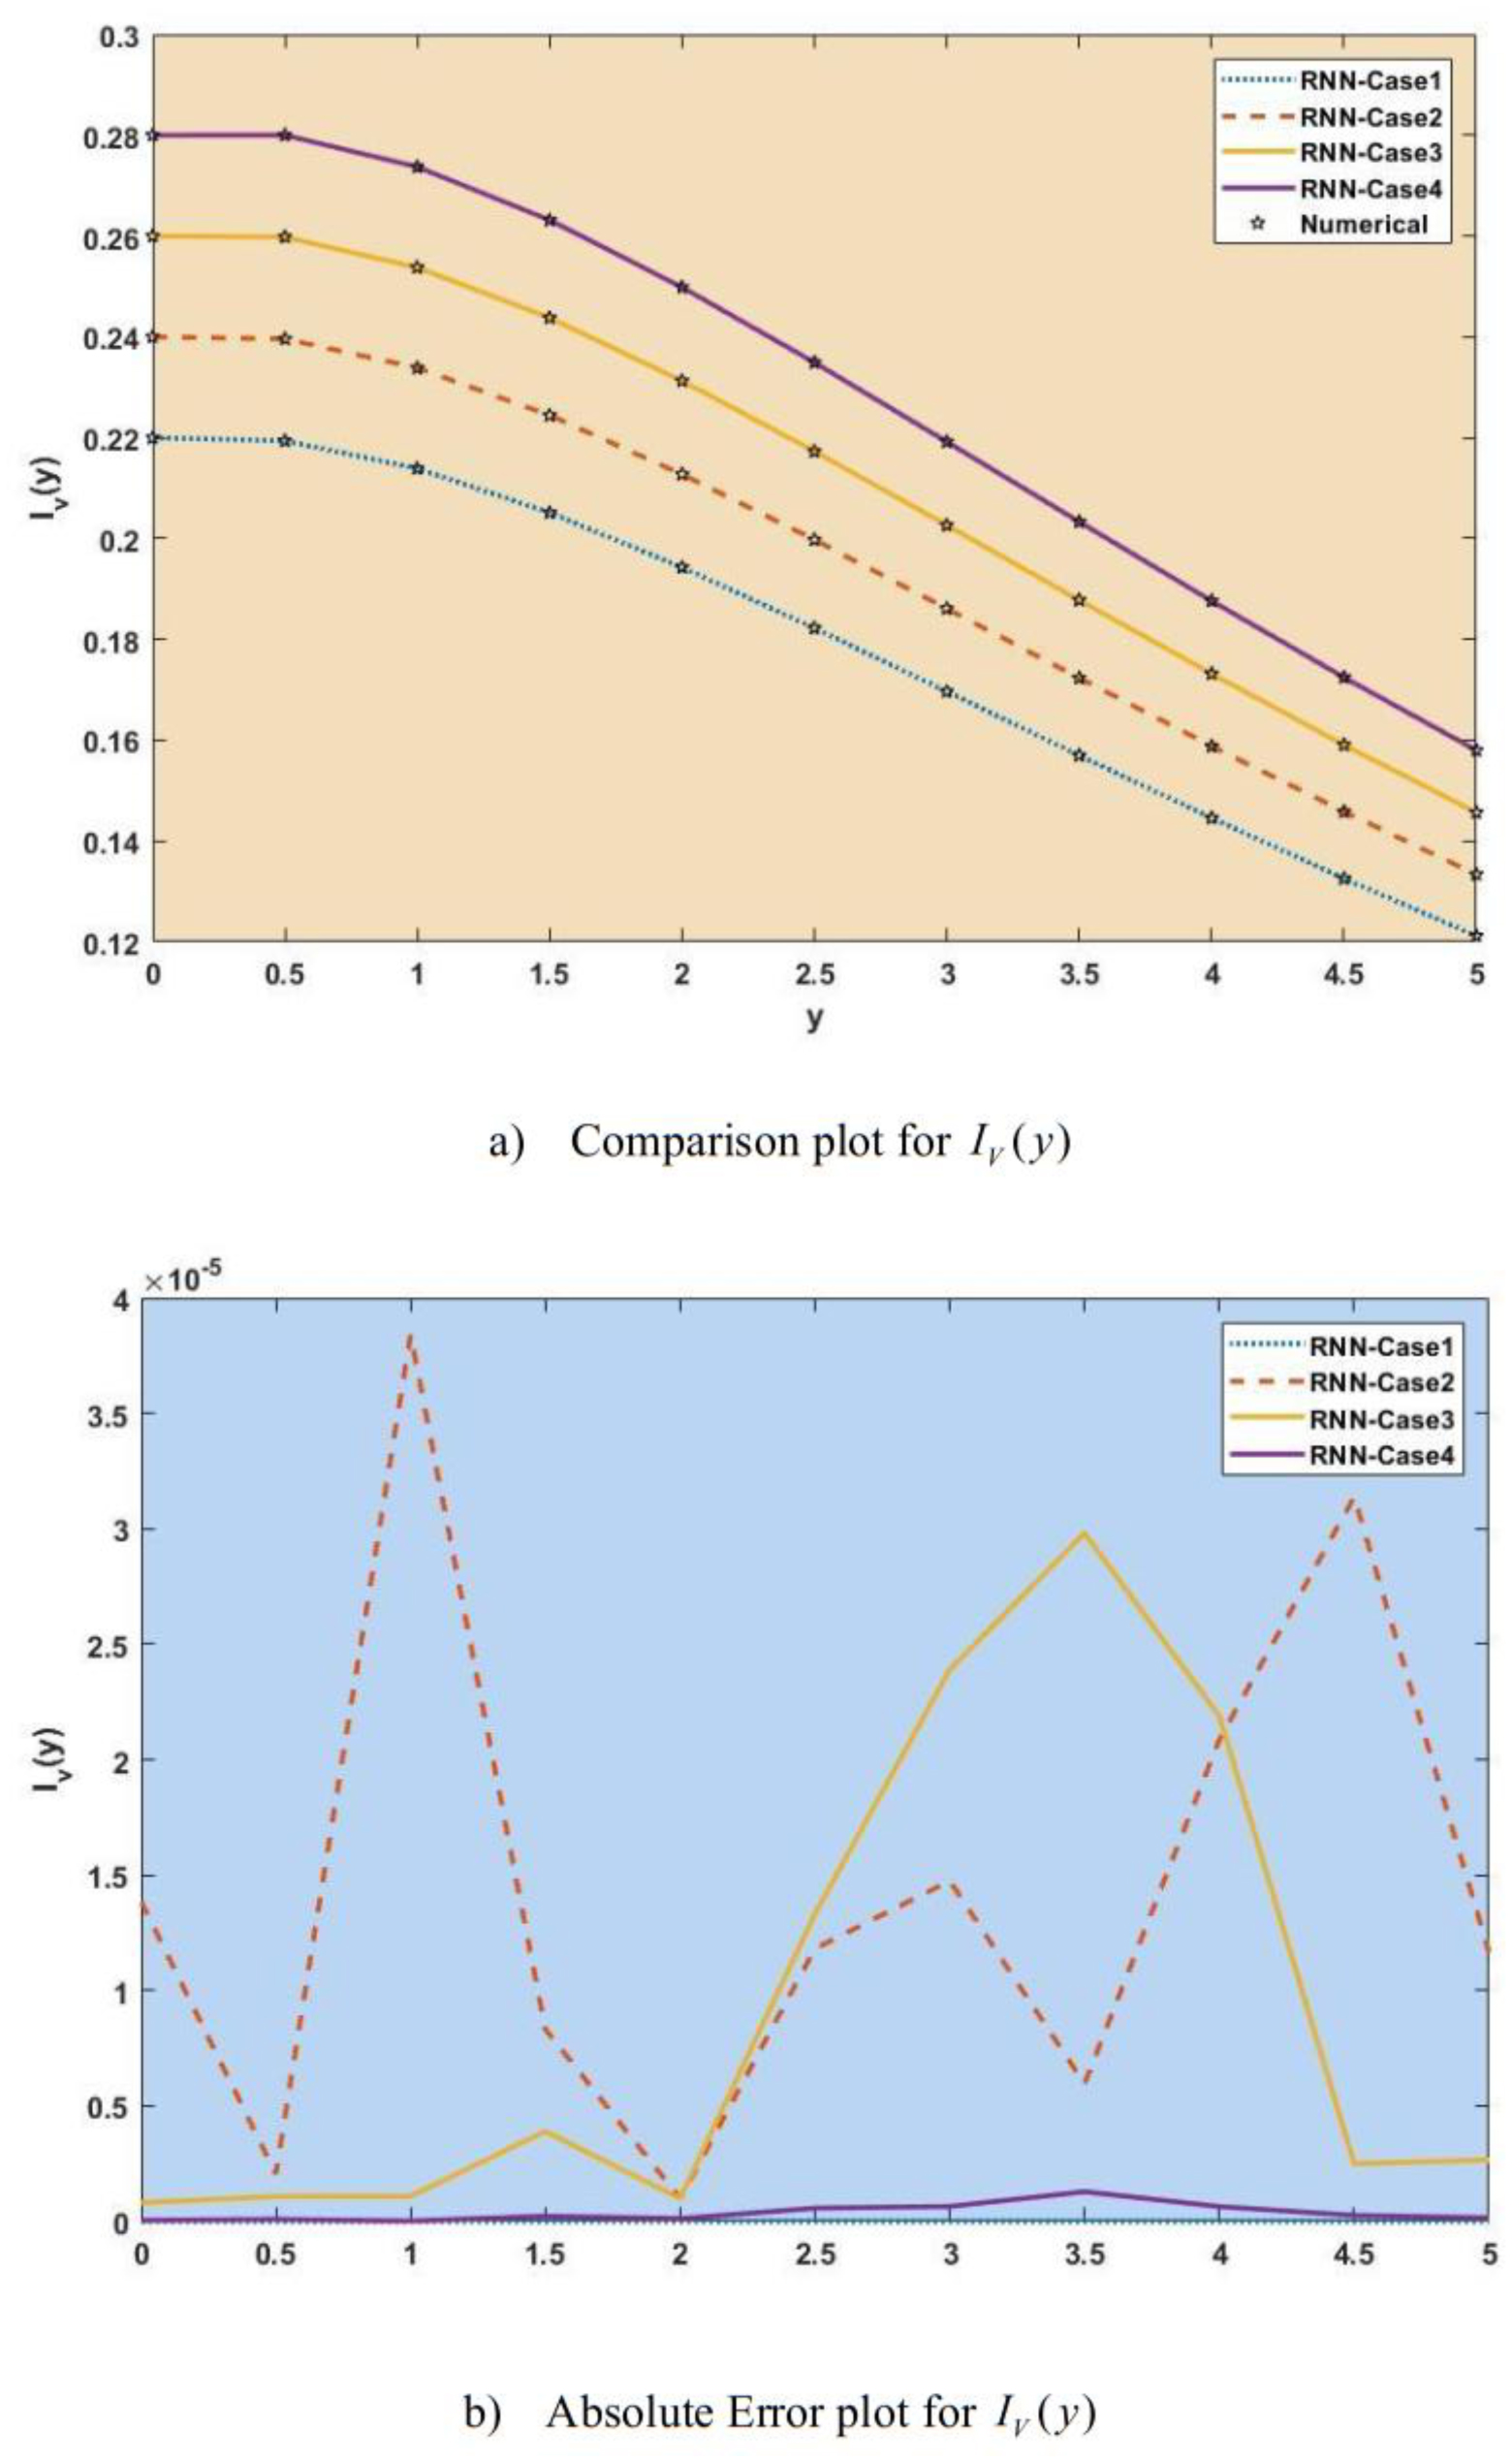
Recurrent Neural Networks (RNNs), a type of machine learning technique, have recently drawn a lot of interest in numerous fields, including epidemiology. Implementing public health interventions in the field of epidemiology depends on efficient modeling and outbreak prediction. Because RNNs can capture sequential dependencies in data, they have become highly effective tools in this field. In this paper, the use of RNNs in epidemic modeling is examined, with a focus on the extent to which they can handle the inherent temporal dynamics in the spread of diseases. The mathematical representation of epidemics requires taking time-dependent variables into account, such as the rate at which infections spread and the long-term effects of interventions. The goal of this study is to use an intelligent computing solution based on RNNs to provide numerical performances and interpretations for the SEIR nonlinear system based on the propagation of the Zika virus (SEIRS-PZV) model. The four patient dynamics, namely susceptible patients S(y), exposed patients admitted in a hospital E(y), the fraction of infective individuals I(y), and recovered patients R(y), are represented by the epidemic version of the nonlinear system, or the SEIR model. SEIRS-PZV is represented by ordinary differential equations (ODEs), which are then solved by the Adams method using the Mathematica software to generate a dataset. The dataset was used as an output for the RNN to train the model and examine results such as regressions, correlations, error histograms, etc. For RNN, we used 100% to train the model with 15 hidden layers and a delay of 2 seconds. The input for the RNN is a time series sequence from 0 to 5, with a step size of 0.05. In the end, we compared the approximated solution with the exact solution by plotting them on the same graph and generating the absolute error plot for each of the 4 cases of SEIRS-PZV. Predictions made by the model appeared to be become more accurate when the mean squared error (MSE) decreased. An increased fit to the observed data was suggested by this decrease in the MSE, which suggested that the variance between the model's predicted values and the actual values was dropping. A minimal absolute error almost equal to zero was obtained, which further supports the usefulness of the suggested strategy. A small absolute error shows the degree to which the model's predictions matches the ground truth values, thus indicating the level of accuracy and precision for the model's output.

| [1] |
Dick GW, Kitchen SF, Haddow AJ (1952) Zika virus (I). Isolations and serological specificity. Trans R Soc Trop Med Hyg 46: 509-520. https://doi.org/10.1016/0035-9203(52)90042-4 
|
| [2] |
Simpson David IH (1964) Zika virus infection in man. Trans R Soc Trop Med Hyg 58: 335-338. https://doi.org/10.1016/0035-9203(64)90201-9
|
| [3] |
Moore DÁ, Causey OR, Carey DE, et al. (1975) Arthropod-borne viral infections of man in Nigeria, 1964–1970. Ann Trop Med Parasitol 69: 49-64. https://doi.org/10.1080/00034983.1975.11686983
|
| [4] |
Olson J, Ksiazek TG (1981) Zika virus, a cause of fever in Central Java, Indonesia. Trans R Soc Trop Med Hyg 75: 389-393. https://doi.org/10.1016/0035-9203(81)90100-0
|
| [5] |
Lyle R. Petersen, Denise J. Jamieson, Ann M. Powers, et al. (2016) Zika virus. New Engl J Med 374: 1552-1563. https://doi.org/10.1056/NEJMra1602113
|
| [6] |
Duffy MR, Chen TH, Hancock WT, et al. (2009) Zika virus outbreak on Yap Island, federated states of Micronesia. New Engl J Med 360: 2536-2543. https://doi.org/10.1056/NEJMoa0805715
|
| [7] |
Zanluca C, Melo VCAD, Mosimann ALP, et al. (2015) First report of autochthonous transmission of Zika virus in Brazil. Mem Inst Oswaldo Cruz 110: 569-572. https://doi.org/10.1590/0074-02760150192
|
| [8] |
Rasmussen SA, Jamieson DJ, Honein MA, et al. (2016) Zika virus and birth defects—reviewing the evidence for causality. New Engl J Med 374: 1981-1987. https://doi.org/10.1056/NEJMsr1604338
|
| [9] |
Serrato IM, Moreno-Aguilera D, Caicedo PA, et al. (2022) Vector competence of lambda-cyhalothrin resistant Aedes aegypti strains for dengue-2, Zika and chikungunya viruses in Colombia. Plos One 17: e0276493. https://doi.org/10.1371/journal.pone.0276493
|
| [10] | World Health OrganizationSituation report: Zika virus, microcephaly, Guillain-Barré syndrome (2016). Available from: https://iris.who.int/handle/10665/250295 |
| [11] | Secretaría de Salud.Boletín epidemiológico. Sistema Nacional de Vigilancia Epidemiológica. Sistema Único Información (2019) 52: p.57. https://www.gob.mx/salud/acciones-y-programas/direccion-general-de-epidemiologia-boletin-epidemiologico |
| [12] |
Liu L (2014) Fields Virology, 6th Edition. Clin Infec Dis 59: 613-613. https://doi.org/10.1093/cid/ciu346
|
| [13] |
Pierson TC, Diamond MS (2012) Degrees of maturity: The complex structure and biology of flaviviruses. Curr Opin Virol 2: 168-175. https://doi.org/10.1016/j.coviro.2012.02.011
|
| [14] |
Yu IM, Zhang W, Holdaway HA, et al. (2008) Structure of the immature dengue virus at low pH primes proteolytic maturation. Science 319: 1834-1837. https://doi.org/10.1126/science.1153264
|
| [15] |
Boigard H, Alimova A, Martin GR, et al. (2017) Zika virus-like particle (VLP) based vaccine. PLoS Negl Trop Dis 11: e0005608. https://doi.org/10.1371/journal.pntd.0005608
|
| [16] |
Crill Wayne D, Gwong-Jen J Chang (2004) Localization and characterization of flavivirus envelope glycoprotein cross-reactive epitopes. J Virol 78: 13975-13986. https://doi.org/10.1128/JVI.78.24.13975-13986.2004
|
| [17] |
Lindenbach BD, Rice CM (2003) Molecular biology of flaviviruses. Adv Virus Res 59: 23-62. https://doi.org/10.1016/S0065-3527(03)59002-9
|
| [18] |
Dowd KA, Ko SY, Morabito KM (2016) Rapid development of a DNA vaccine for Zika virus. Science 354: 237-240. https://doi.org/10.1126/science.aai9137
|
| [19] |
Muthumani K, Griffin BD, Agarwal S, et al. (2016) In vivo protection against ZIKV infection and pathogenesis through passive antibody transfer and active immunisation with a prMEnv DNA vaccine. NPJ Vaccines 1: 16021. https://doi.org/10.1038/npjvaccines.2016.21
|
| [20] |
Nour AM, Li Y, Wolenski J, et al. (2013) Viral membrane fusion and nucleocapsid delivery into the cytoplasm are distinct events in some flaviviruses. PLoS Pathog 9: e1003585. https://doi.org/10.1371/journal.ppat.1003585
|
| [21] |
Topal AO, Chitic R, Leprévost F (2023) One evolutionary algorithm deceives humans and ten convolutional neural networks trained on ImageNet at image recognition. Appl Soft Comput 143: 110397. https://doi.org/10.1016/j.asoc.2023.110397
|
| [22] |
Shin J, Musa Miah AS, Hasan MAM, et al. (2023) Korean Sign Language Recognition Using Transformer-Based Deep Neural Network. Appl Sci 13: 3029. https://doi.org/10.3390/app13053029
|
| [23] |
Kanwisher N, Khosla M, Dobs K (2023) Using artificial neural networks to ask ‘why’questions of minds and brains. Trends Neurosci 46: 240-254. https://doi.org/10.1016/j.tins.2022.12.008
|
| [24] | Jorgenson DW, Weitzman ML, Zhang YX, et al. (2024) Can neural networks predict stock market?. AC Inv Res J 220. Available from: https://www.ademcetinkaya.com/p/how-does-rating-model-work.html |
| [25] |
Bi K, Xie L, Zhang H, et al. (2023) Accurate medium-range global weather forecasting with 3D neural networks. Nature 619: 533-538. https://doi.org/10.1038/s41586-023-06185-3
|
| [26] |
Veličković P (2023) Everything is connected: Graph neural networks. Curr Opin Struct Biol 79: 102538. https://doi.org/10.1016/j.sbi.2023.102538
|
| [27] |
Sabir Z, Bhat SA, Raja MAZ, et al. (2023) A swarming neural network computing approach to solve the Zika virus model. Eng Appl Artif Intel 126: 106924. https://doi.org/10.1016/j.engappai.2023.106924
|
| [28] | Rubio-Solis A, Musah A, Dos Santos P, et al. ZIKA virus: Prediction of Aedes mosquito larvae occurrence in Recife (Brazil) using online extreme learning machine and neural networks. In Proceedings of the 9th international conference on digital public health; c2019 : p. 101-110. https://doi.org/10.1145/3357729.3357738 |
| [29] | Mahalakshmi B, Suseendran G (2019) Prediction of zika virus by multilayer perceptron neural network (MLPNN) using cloud. Int J Recent Technol Eng (IJRTE) 8: 1-6. https://doi.org/10.35940/ijrte.B1041.0982S1119 |
| [30] |
Yin R, Luusua E, Dabrowski J, et al. (2020) Tempel: Time-series mutation prediction of influenza A viruses via attention-based recurrent neural networks. Bioinformatics 36: 2697-2704. https://doi.org/10.1093/bioinformatics/btaa050
|
| [31] | Gupta AK, Srinivasulu A, Hiran KK, et al. (2022) Prediction of omicron virus using combined extended convolutional and recurrent neural networks technique on CT-scan images. Interdiscip Perspect Infect Dis 2022: 1525615. https://doi.org/10.1155/2022/1525615 |
| [32] | Bonet I, García MM, Saeys Y, et al. (2007) Predicting human immunodeficiency virus (HIV) drug resistance using recurrent neural networks. In International Work-Conference on the Interplay Between Natural and Artificial Computation; c2007 : p. 234-243. https://doi.org/10.1007/978-3-540-73053-8_23 |
| [33] |
Sindhu TN, Çolak AB, Lone SA, et al. (2024) A decreasing failure rate model with a novel approach to enhance the artificial neural network's structure for engineering and disease data analysis. Tribol Int 192: 109231. https://doi.org/10.1016/j.triboint.2023.109231
|
| [34] | Shafiq Anum, Andaç Batur Çolak, Tabassum Naz Sindhu, et al. (2023) Modeling and survival exploration of breast carcinoma: A statistical, maximum likelihood estimation, and artificial neural network perspective. Artif Intel Life Sci 4: 100082. https://doi.org/10.1016/j.ailsci.2023.100082 |
| [35] |
Shafiq A, Çolak AB, Sindhu TN (2024) Comparative analysis to study the Darcy–Forchheimer Tangent hyperbolic flow towards cylindrical surface using artificial neural network: An application to Parabolic Trough Solar Collector. Math Comput Simulat 216: 213-230. https://doi.org/10.1016/j.matcom.2023.09.014
|
| [36] | Shafiq A, Çolak AB, Sindhu TN (2023) Development of an intelligent computing system using neural networks for modeling bioconvection flow of second-grade nanofluid with gyrotactic microorganisms. Numerical Heat Transfer Part B: Fundamentals. https://doi.org/10.1080/10407790.2023.2273512 |
| [37] |
Shafiq A, Çolak AB, Sindhu TN (2023) Significance of EMHD graphene oxide (GO) water ethylene glycol nanofluid flow in a Darcy–Forchheimer medium by machine learning algorithm. Eur Phys J Plus 138: 213. https://doi.org/10.1140/epjp/s13360-023-03798-5
|
| [38] |
Shafiq A, Çolak AB, Sindhu TN (2023) Analyzing activation energy and binary chemical reaction effects with artificial intelligence approach in axisymmetric flow of third grade nanofluid subject to Soret and Dufour effects. Heat Transf Re 54: 75-94. https://doi.org/10.1615/HeatTransRes.2022045008
|
| [39] |
Shafiq A, Çolak AB, Sindhu TN (2023) Optimization of the numerical treatment of the Darcy–Forchheimer flow of Ree–Eyring fluid with chemical reaction by using artificial neural networks. Int J Numer Meth Fl 95: 176-192. https://doi.org/10.1002/fld.5147
|
| [40] |
Çolak AB, Sindhu TN, Lone SA, et al. (2024) A comparative analysis of maximum likelihood estimation and artificial neural network modeling to assess electrical component reliability. Qual Reliab Eng Int 40: 91-114. https://doi.org/10.1002/qre.3233
|
| [41] |
Çolak AB, Sindhu TN, Lone SA, et al. (2023) Reliability study of generalized Rayleigh distribution based on inverse power law using artificial neural network with Bayesian regularization. Tribol Int 185: 108544. https://doi.org/10.1016/j.triboint.2023.108544
|
| [42] |
Shafiq A, Çolak AB, Swarup C, et al. (2022) Reliability analysis based on mixture of lindley distributions with artificial neural network. Adv Theor Simul 5: 2200100. https://doi.org/10.1002/adts.202200100
|
| [43] |
Shafiq A, Çolak AB, Sindhu TN, et al. (2022) Comparative study of artificial neural network versus parametric method in COVID-19 data analysis. Results Phys 38: 105613. https://doi.org/10.1016/j.rinp.2022.105613
|
| [44] |
Shafiq A, Çolak AB, Naz Sindhu T (2021) Designing artificial neural network of nanoparticle diameter and solid–fluid interfacial layer on single-walled carbon nanotubes/ethylene glycol nanofluid flow on thin slendering needles. Int J Numer Meth Fl 93: 3384-3404. https://doi.org/10.1002/fld.5038
|
| [45] |
Shafiq A, Çolak AB, Sindhu TN, et al. (2021) Estimation of unsteady hydromagnetic Williamson fluid flow in a radiative surface through numerical and artificial neural network modeling. Sci Rep 11: 14509. https://doi.org/10.1038/s41598-021-93790-9
|
| [46] | Rezapour S, Mohammadi H, Jajarmi A (2020) A new mathematical model for Zika virus transmission. Adv Differ Equ 589: 1-15. https://doi.org/10.1186/s13662-020-03044-7 |
| [47] |
Sabir Z (2022) Stochastic numerical investigations for nonlinear three-species food chain system. Int J Biomath 15: 2250005. https://doi.org/10.1142/S179352452250005X
|
| [48] |
Shoaib M, Zubair G, Nisar KS, et al. (2021) Ohmic heating effects and entropy generation for nanofluidic system of Ree-Eyring fluid: Intelligent computing paradigm. Int Commun Heat Mass 129: 105683. https://doi.org/10.1016/j.icheatmasstransfer.2021.105683
|
| [49] |
Nisar KS, Anjum MW, Raja MAZ, et al. (2024) Homogeneous-heterogeneous reactions on Darcy-Forchheimer nanofluid flow system. Case Stud Therm Eng 53: 103882. https://doi.org/10.1016/j.csite.2023.103882
|
| [50] |
Sabir Z, Wahab HA, Ali MR, et al. (2022) Neuron analysis of the two-point singular boundary value problems arising in the thermal explosion's theory. Neural Process Lett 54: 4297-4324. https://doi.org/10.1007/s11063-022-10809-6
|
| [51] |
Sabir Z, Wahab HA (2021) Evolutionary heuristic with Gudermannian neural networks for the nonlinear singular models of third kind. Phys Scripta 96: 125261. https://doi.org/10.1088/1402-4896/ac3c56
|
| [52] |
Sabir Z, Raja MAZ, Baleanu D (2021) Fractional mayer neuro-swarm heuristic solver for multi-fractional order doubly singular model based on lane–emden equation. Fractals 29: 2140017. https://doi.org/10.1142/S0218348X2140017X
|


Figures(13) / Tables(3)

Kottakkaran Sooppy Nisar, Muhammad Wajahat Anjum, Muhammad Asif Zahoor Raja, Muhammad Shoaib. Recurrent neural network for the dynamics of Zika virus spreading[J]. AIMS Public Health, 2024, 11(2): 432-458. doi: 10.3934/publichealth.2024022


 DownLoad: