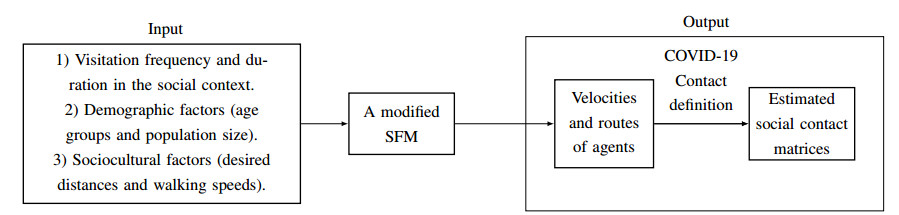
This paper explores the impact of various distancing measures on the spread of infectious diseases, focusing on the spread of COVID-19 in the Moroccan population as a case study. Contact matrices, generated through a social force model, capture population interactions within distinct activity locations and age groups. These matrices, tailored for each distancing scenario, have been incorporated into an SEIR model. The study models the region as a network of interconnected activity locations, enabling flexible analysis of the effects of different distancing measures within social contexts and between age groups. Additionally, the method assesses the influence of measures targeting potential superspreaders (i.e., agents with a very high contact rate) and explores the impact of inter-activity location flows, providing insights beyond scalar contact rates or survey-based contact matrices.
The results suggest that implementing intra-activity location distancing measures significantly reduces in the number of infected individuals relative to the act of imposing restrictions on individuals with a high contact rate in each activity location. The combination of both measures proves more advantageous. On a regional scale, characterized as a network of interconnected activity locations, restrictions on the movement of individuals with high contact rates was found to result in a $ 2 \% $ reduction, while intra-activity location-based distancing measures was found to achieve a $ 44 \% $ reduction. The combination of these two measures yielded a $ 48\% $ reduction.
Citation: Abdelkarim Lamghari, Dramane Sam Idris Kanté, Aissam Jebrane, Abdelilah Hakim. Modeling the impact of distancing measures on infectious disease spread: a case study of COVID-19 in the Moroccan population[J]. Mathematical Biosciences and Engineering, 2024, 21(3): 4370-4396. doi: 10.3934/mbe.2024193
This paper explores the impact of various distancing measures on the spread of infectious diseases, focusing on the spread of COVID-19 in the Moroccan population as a case study. Contact matrices, generated through a social force model, capture population interactions within distinct activity locations and age groups. These matrices, tailored for each distancing scenario, have been incorporated into an SEIR model. The study models the region as a network of interconnected activity locations, enabling flexible analysis of the effects of different distancing measures within social contexts and between age groups. Additionally, the method assesses the influence of measures targeting potential superspreaders (i.e., agents with a very high contact rate) and explores the impact of inter-activity location flows, providing insights beyond scalar contact rates or survey-based contact matrices.
The results suggest that implementing intra-activity location distancing measures significantly reduces in the number of infected individuals relative to the act of imposing restrictions on individuals with a high contact rate in each activity location. The combination of both measures proves more advantageous. On a regional scale, characterized as a network of interconnected activity locations, restrictions on the movement of individuals with high contact rates was found to result in a $ 2 \% $ reduction, while intra-activity location-based distancing measures was found to achieve a $ 44 \% $ reduction. The combination of these two measures yielded a $ 48\% $ reduction.

| [1] |
W. O. Kermack, A. G. McKendrick, A contribution to the mathematical theory of epidemics, Proceedings of the Royal Society of London. Series A, Containing Papers of a Mathematical and Physical Character, 115 (1927), 700–721. https://doi.org/10.1098/rspa.1927.0118 doi: 10.1098/rspa.1927.0118

|
| [2] |
W. O. Kermack, A. G. McKendrick, Contributions to the Mathematical Theory of Epidemics–Ⅰ. 1927, Bull. Math. Biol., 53 (1991), 33–55. https://doi.org/10.1007/bf02464423 doi: 10.1007/bf02464423
|
| [3] |
M. Y. Li, J. R. Graef, L. Wang, J. Karsai, Global Dynamics of a SEIR Model with Varying Total Population Size, Math. Biosci., 160 (1999), 191–213. https://doi.org/10.1016/S0025-5564(99)00030-9 doi: 10.1016/S0025-5564(99)00030-9
|
| [4] |
J. Mossong, N. Hens, M. Jit, P. Beutels, K. Auranen, R. Mikolajczyk, et al., Social Contacts and Mixing Patterns Relevant to the Spread of Infectious Diseases, PLoS Med., 5 (2008), e74. https://doi.org/10.1371/journal.pmed.0050074 doi: 10.1371/journal.pmed.0050074
|
| [5] |
K. Prem, A. R. Cook, M. Jit, Projecting social contact matrices in 152 countries using contact surveys and demographic data, PLOS Computat. Biol., 13 (2017), 1–21. https://doi.org/10.1371/journal.pcbi.1005697 doi: 10.1371/journal.pcbi.1005697
|
| [6] |
K. Prem, K. van Zandvoort, P. Klepac, R. M. Eggo, N. G. Davies, Centre for the Mathematical Modelling of Infectious Diseases COVID-19 Working Group, et al., Projecting contact matrices in 177 geographical regions: an update and comparison with empirical data for the COVID-19 era, PLoS Computat. Biol., 17 (2021), e1009098. https://doi.org/10.1371/journal.pcbi.1009098 doi: 10.1371/journal.pcbi.1009098
|
| [7] | A. C. E. Mouvoh, A. Bouchnita, A. Jebrane, A contact-structured SEIR model to assess the impact of lockdown measures on the spread of COVID-19 in Morocco's population, in 2020 IEEE 2nd International Conference on Electronics, Control, Optimization and Computer Science (ICECOCS), (2020), 1–4. 10.1109/ICECOCS50124.2020.9314462 |
| [8] | R. Singh, R. Adhikari, Age-structured impact of social distancing on the COVID-19 epidemic in India, arXiv preprint, (2020), arXiv: 200055. https://doi.org/10.48550/arXiv.2003.12055 |
| [9] |
Y. Xiao, M. Yang, Z. Zhu, H. Yang, L. Zhang, S. Ghader, Modeling indoor-level non-pharmaceutical interventions during the COVID-19 pandemic: A pedestrian dynamics-based microscopic simulation approach, Transp. Policy, 109 (2021), 12–23. https://doi.org/10.1016/j.tranpol.2021.05.004 doi: 10.1016/j.tranpol.2021.05.004
|
| [10] |
D. Helbing, P. Molnar, Social Force Model for Pedestrian Dynamics, Phys. Rev. E, 51 (1995), 4282. https://doi.org/10.48550/arXiv.cond-mat/9805244 doi: 10.48550/arXiv.cond-mat/9805244
|
| [11] |
A. Jebrane, P. Argoul, A. Hakim, M. El Rhabi, Estimating Contact Forces and Pressure in a Dense Crowd: Microscopic and Macroscopic Models, Appl. Math. Model., 74 (2019), 409–421. https://doi.org/10.1016/j.apm.2019.04.062 doi: 10.1016/j.apm.2019.04.062
|
| [12] | D. Helbing, I. J. Farkas, P. Molnar, T. Vicsek, Simulation of Pedestrian Crowds in Normal and Evacuation Situations, Pedestrian and Evacuation Dyn., 21 (2002), 21–58. |
| [13] |
D. S. I. Kanté, A. Jebrane, A. Hakim, A. Boukamel, Characterization of Superspreaders Movement in a Bidirectional Corridor Using a Social Force Model, Front. Public Health, 11 (2023), 1188732. https://doi.org/10.3389/fpubh.2023.1188732 doi: 10.3389/fpubh.2023.1188732
|
| [14] |
D. S. I. Kanté, A. Jebrane, A. Bouchnita, A. Hakim, Estimating the Risk of Contracting COVID-19 in Different Settings Using a Multiscale Transmission Dynamics Model, Mathematics, 11 (2023), 254. https://doi.org/10.3390/math11010254 doi: 10.3390/math11010254
|
| [15] |
A. Bouchnita, A. Jebrane, A Hybrid Multi-Scale Model of COVID-19 Transmission Dynamics to Assess the Potential of Non-Pharmaceutical Interventions, Chaos Solitons Fractals, 138 (2020), 109941. https://doi.org/10.1016/j.chaos.2020.109941 doi: 10.1016/j.chaos.2020.109941
|
| [16] |
A. Bouchnita, A. Jebrane, A Multi-Scale Model Quantifies the Impact of Limited Movement of the Population and Mandatory Wearing of Face Masks in Containing the COVID-19 Epidemic in Morocco, Math. Model. Nat. Pheno., 15 (2020), 31. https://doi.org/10.1051/mmnp/2020016 doi: 10.1051/mmnp/2020016
|
| [17] | E. T. Hall, The hidden dimension, New York: Anchor, 1966. |
| [18] |
A. Sorokowska, P. Sorokowski, P. Hilpert, K. Cantarero, T. Frackowiak, K. Ahmadi, et al., Preferred Interpersonal Distances: A Global Comparison, J. Cross-Cult. Psychol., 48 (2017), 577–592. https://doi.org/10.1177/0022022117698039 doi: 10.1177/0022022117698039
|
| [19] |
B. Kabalan, P. Argoul, A. Jebrane, G. Cumunel, S. Erlicher, A Crowd Movement Model for Pedestrian Flow Through Bottlenecks, Ann. Solid and Struct. Mech., 8 (2016), 1–15. https://doi.org/10.1007/s12356-016-0044-3 doi: 10.1007/s12356-016-0044-3
|
| [20] | P. Wang, Understanding Social-Force Model in Psychological Principles of Collective Behavior, arXiv preprint, (2016), arXiv: 1605.05146. https://doi.org/10.48550/arXiv.1605.05146 |
| [21] |
G. Luebben, G. González-Parra, B. Cervantes, Study of optimal vaccination strategies for early COVID-19 pandemic using an age-structured mathematical model: A case study of the USA, Math. Biosci. Eng., 20 (2023), 10828–10865. https://doi.org/10.3934/mbe.2023481 doi: 10.3934/mbe.2023481
|
| [22] |
M. O'Driscoll, G. R. D. Santos, L. Wang, D. A. T. Cummings, A. S. Azman, J. Paireau, et al., Age-specific Mortality and Immunity Patterns of SARS-CoV-2, Nature, 590 (2021), 140–145. https://doi.org/10.1038/s41586-020-2918-0 doi: 10.1038/s41586-020-2918-0
|
| [23] | Morocco: WHO Coronavirus Disease (COVID-19) Dashboard With Vaccination Data, World Health Organization, 2023. Available from: https://covid19.who.int/region/emro/country/ma |
| [24] |
M. El Baldi, A. Laghrissi, Z. Marso, F. Z. Chellat, M. Berraho, N. Tachfouti, et al., Prevalence and associated factors of COVID-19 among Moroccan physicians: A cross-sectional study, Plos One, 17 (2022), e0277157. https://doi.org/10.1371/journal.pone.0277157 doi: 10.1371/journal.pone.0277157
|
| [25] |
C. Zhan, Y. Zheng, L. Shao, G. Chen, H. Zhang, Modeling the Spread Dynamics of Multiple-Variant Coronavirus Disease Under Public Health Interventions: A General Framework, Inf. Sci., 628 (2023), 469–487. https://doi.org/10.1016/j.ins.2023.02.001 doi: 10.1016/j.ins.2023.02.001
|
| [26] | Institutional site of the High Commission for Planning of the Kingdom of Morocco (HCP), HCP, 2018. Available from: https://www.hcp.ma/Projections-de-la-population-totale-du-Maroc-par-age-simple-et-sexe-2014-2050_a2209.html. |
| [27] | Statista, Morocco: Age structre from 2012 to 2021. Available from: https://www.statista.com/statistics/502768/age-structure-in-morocco. |
| [28] | F. Hadrya, A. Soulaymani, F. El Hattimy, Space-time COVID-19 Monitoring in Morocco, Pan Afr. Med. J., 35 (2020), Suppl 2. https://doi.org/10.11604%2Fpamj.supp.2020.35.2.23505 |
| [29] | Pyramides des âges pour le monde entier de 1950 à 2100, Population Pyramid, 2014. Available from: https://www.populationpyramid.net/fr/maroc/2020/. |
| [30] |
M. El Jai, M. Zhar, D. Ouazar, I. Akhrif, N. Saidou, Socio-economic Analysis of Short-term Trends of COVID-19: Modeling and Data Analytics, BMC Public Health, 22 (2022), 1633. https://doi.org/10.1186/s12889-022-13788-4 doi: 10.1186/s12889-022-13788-4
|
| [31] |
C. Cheng, D. Zhang, D. Dang, J. Geng, P. Zhu, M. Yuan, et al., The Incubation Period of COVID-19: A Global Meta-Analysis of 53 Studies and a Chinese Observation Study of 11,545 Patients, Infect. Dis. Poverty, 10 (2021), 1–13. https://doi.org/10.1186/s40249-021-00901-9 doi: 10.1186/s40249-021-00901-9
|
| [32] | Louvain Medical, L'épidémie de SARS-CoV-2 en Afrique Sub-Saharienne, questions, craintes et espoir, 2020. Available from: https://www.louvainmedical.be/fr/article/lepidemie-de-sars-cov-2-en-afrique-sub-saharienne-questions-craintes-et-espoir. |
| [33] | D. S. I. Kante, A. Lamghari, A. Jebrane, A. Boukamel, A. Hakim, Estimating Social Contact Matrices Using a Modified Social Force Model and Socio-Cultural Data, International Conference on Research in Applied Mathematics and Computer Science (ICRAMCS 2022). |
| [34] |
J. Dolbeault, G. Turinici, Heterogeneous social interactions and the COVID-19 lockdown outcome in a multi-group SEIR model, Math. Model. Nat. Pheno., 15 (2020), 36. https://doi.org/10.1051/mmnp/2020025 doi: 10.1051/mmnp/2020025
|
| [35] | M. J. Pedersen, N. Favero, Social Distancing during the COVID-19 Pandemic: Who Are the Present and Future Noncompliers?, Public Adm. Rev., 80 (2020), 805–814. https://doi.org/10.1111%2Fpuar.13240. |
| [36] |
L. H. Duczmal, A. C. L. Almeida, D. B. Duczmal, C. R. L. Alves, F. C. O. Magalhães, M. S. D. Lima, et al., Vertical social distancing policy is ineffective to contain the COVID-19 pandemic, Cadernos de Saúde Pública, 36 (2020), e00084420. https://doi.org/10.1590/0102-311x00084420 doi: 10.1590/0102-311x00084420
|
| [37] |
W. Lyra, J.-D. do Nascimento Jr, J. Belkhiria, L. de Almeida, P. P. M. Chrispim, I. de Andrade, COVID-19 pandemics modeling with modified determinist SEIR, social distancing, and age stratification. The effect of vertical confinement and release in Brazil, Plos One, 15 (2020), e0237627. https://doi.org/10.1371/journal.pone.0237627 doi: 10.1371/journal.pone.0237627
|
| [38] |
K. A. Auger, S. S. Shah, T. Richardson, D. Hartley, M. Hall, A. Warniment, et al., Association between statewide school closure and COVID-19 incidence and mortality in the US, Jama, 324 (2020), 859–870. https://doi.org/10.1001/jama.2020.14348 doi: 10.1001/jama.2020.14348
|
| [39] |
Y. Bo, C. Guo, C. Lin, Y. Zeng, H. B. Li, Y. Zhang, et al., Effectiveness of non-pharmaceutical interventions on COVID-19 transmission in 190 countries from 23 January to 13 April 2020, Int. J. Infect. Dis., 102 (2021), 247–253. https://doi.org/10.1016/j.ijid.2020.10.066 doi: 10.1016/j.ijid.2020.10.066
|
| [40] |
S. Lai, N. W. Ruktanonchai, L. Zhou, O. Prosper, W. Luo, J. R. Floyd, et al., Effect of Non-Pharmaceutical Interventions to Contain COVID-19 in China, Nature, 585 (2020), 410–413. https://doi.org/10.1038/s41586-020-2293-x doi: 10.1038/s41586-020-2293-x
|
| [41] |
E. Bosina, U. Weidmann, Estimating Pedestrian Speed Using Aggregated Literature Data, Physica A, 468 (2017), 1–29. https://doi.org/10.1016/j.physa.2016.09.044 doi: 10.1016/j.physa.2016.09.044
|
| [42] | Haut Commissariat du Plan, Les Cahiers du Plan N°43 - Mars/Avril 2013, Available online: https://www.hcp.ma/Les-Cahiers-du-Plan-N-43-Mars-Avril-2013_a1248.html (accessed on November 2021). |
| [43] | N. Mellouki, Vieillissement et Mode Alimentaire: Étude Anthropologique à Marrakech, Université Cadi Ayyad, Marrakech, PhD thesis, 2007. Available from: http://wd.fmpm.uca.ma/biblio/theses/annee-htm/FT/2007/these45-07.pdf. |
| [44] | Ministry of Health, Available online: https://www.sante.gov.ma/Documents/2019/05/Rapport%20de%20l%20enqu%C3%AAte%20Stepwise.pdf (accessed on November 2021). |
| [45] |
M. Loukid, P. Montero, Croissance des Enfants de la Ville de Marrakech (Maroc): Analyse Comparative Avec des Enfants Espagnols, Bulletins et Mémoires de la Société d'Anthropologie de Paris, 3 (1991), 211–224. https://doi.org/10.3406/bmsap.1991.1783 doi: 10.3406/bmsap.1991.1783
|
| [46] | Ministry of National Education, Preschool and Sports, Available online: https://www.men.gov.ma/Ar/Documents/Recueil2012-13_v25032013.pdf (accessed on December 2021). |
| [47] | G. Shaw, A. M. Williams, Tourism and Tourism Spaces, Thousand Oaks, CA, USA: SAGE Publications, 2004. |
| [48] | The World Bank, Available online: https://data.worldbank.org/indicator/SE.SEC.ENRL.TC.ZS?locations = MA, (accessed on March 2022). |
| [49] | The World Bank, Available online: https://data.worldbank.org/indicator/SE.PRM.ENRL.TC.ZS?locations = MA, (accessed on March 2022). |
| [50] | Trading Economics, Available online: https://tradingeconomics.com/morocco/employment-rate, (accessed on February 2022). |
| [51] | United Nations, Available online: https://www.un.org/development/desa/pd/content/household-size-and-composition-around-world-2017-data-booklet, (accessed on February 2022). |
| [52] |
V. Vuorinen, M. Aarnio, M. Alava, V. Alopaeus, N. Atanasova, M. Auvinen, et al, Modelling Aerosol Transport and Virus Exposure with Numerical Simulations in Relation to SARS-CoV-2 Transmission by Inhalation Indoors, Saf. Sci., 130 (2020), 104866. https://doi.org/10.1016/j.ssci.2020.104866 doi: 10.1016/j.ssci.2020.104866
|
| [53] | Statista, "Education in Morocco", Statista, 2022. Available from: https://www.statista.com/topics/7523/education-in-morocco/#topicOverview.(accessed on December 25, 2023). |
| [54] | Frommer's, Available online: https://www.frommers.com/destinations/morocco/planning-a-trip (accessed on December 2022). |
| [55] |
B. Gorbunov, Aerosol Particles Generated by Coughing and Sneezing of a SARS-CoV-2 (COVID-19) Host Travel Over 30 m Distance, Aerosol Air Qual. Res., 21 (2021), 200468. https://doi.org/10.4209/aaqr.200468 doi: 10.4209/aaqr.200468
|
| [56] | High Commission for Planning, Available online: https://www.moroccoworldnews.com/2019/01/262899/moroccan-tv-reading-exercising-hcp (accessed on December 2022). |
| [57] |
F. Iozzi, F. Trusiano, M. Chinazzi, F. C. Billari, E. Zagheni, S. Merler, et al., Little Italy: An Agent-Based Approach to the Estimation of Contact Patterns - Fitting Predicted Matrices to Serological Data, PLoS Comput. Biol., 6 (2010), e1001021. https://doi.org/10.1371/journal.pcbi.1001021 doi: 10.1371/journal.pcbi.1001021
|
| [58] | Time well spent, The Wall Street Journal. Available from: https://partners.wsj.com/icsc/shopping-for-the-truth/time-well-spent/article. |
| [59] |
Z. J. Madewell, Y. Yang, I. M. Longini, M. E. Halloran, N. E. Dean, Factors Associated with Household Transmission of SARS-CoV-2: An Updated Systematic Review and Meta-Analysis, JAMA Netw. Open, 4 (2021), e2122240. https://doi.org/10.1001/jamanetworkopen.2021.22240 doi: 10.1001/jamanetworkopen.2021.22240
|
| [60] | MoroccoPedia, "Education in Morocco", in Morocco Travel, Available online: https://www.moroccopedia.com/education-in-morocco/#: : text = School%20hours%20in%20Morocco%20depend, 2%20p.m%20until%206%20p.m. (accessed on December 25, 2023). |
| [61] | Ministry of National Education, Preschool & Sports, "Aperçu sur le Système Educatif Marocain", Available online: https://www.men.gov.ma/Documents/aper%C3%A7u-systemeducatif-marocain2004.pdf (accessed on December 25, 2023). |
| [62] | Ministry of National Education, Preschool & Sports, "Education indicators", Available online: https://www.men.gov.ma/Ar/Documents/INDIC-EDUCATION2020-21.pdf (accessed on December 25, 2023). |
| [63] | Morocco Mall, Available online: https://www.moroccomall.ma/horaires (accessed on December 2022). |
| [64] |
J. Stokes, A. J. Turner, L. Anselmi, M. Morciano, T. Hone, The Relative Effects of Non-Pharmaceutical Interventions on Wave One Covid-19 Mortality: Natural Experiment in 130 Countries, BMC Public Health, 22 (2022), 1113. https://doi.org/10.1186/s12889-022-13546-6 doi: 10.1186/s12889-022-13546-6
|


Figures(18) / Tables(7)

Abdelkarim Lamghari, Dramane Sam Idris Kanté, Aissam Jebrane, Abdelilah Hakim. Modeling the impact of distancing measures on infectious disease spread: a case study of COVID-19 in the Moroccan population[J]. Mathematical Biosciences and Engineering, 2024, 21(3): 4370-4396. doi: 10.3934/mbe.2024193


 DownLoad: