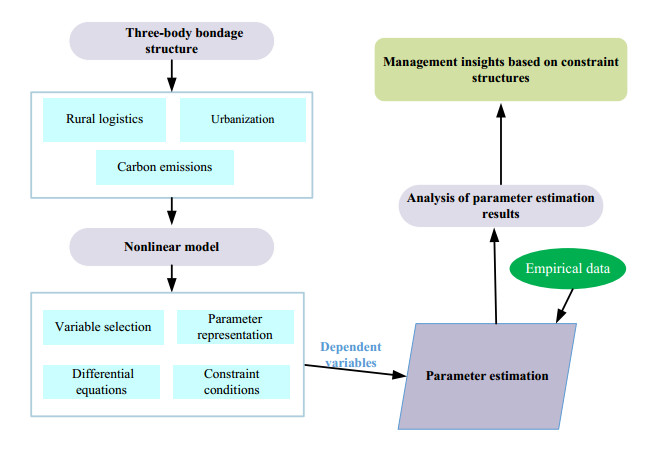
In an era where global focus intensifies on sustainable development, in this study, I investigate the interplay between rapid urbanization, rural logistics evolution, and carbon dynamics in China. We aim to bridge the gap in existing literature by examining the tripartite relationship between these areas and their collective impact on sustainable development. I explore the dynamic interaction mechanisms between urban construction, rural logistics development, and carbon emissions, assessing their joint influence on sustainable development. A detailed analysis of demand dynamics and market mechanisms supporting urbanization, rural logistics development, and carbon emissions has been initiated, leading to the establishment of a theoretical framework. This framework adeptly captures the interdependencies and constraints among these variables, offering a mathematical and bioscientific perspective to understand their complex interactions. Furthermore, a sophisticated nonlinear model based on key quantitative indicators like urbanization level, rural logistics development, and carbon emissions has been incorporated. Considering the multivariate nature, uncertainty, and dynamism presented by the nonlinear model, genetic algorithms have been employed for the estimation of model parameters. Through rigorous empirical testing using data from China spanning the years 1991–2021, I not only validate the effectiveness of the model but also accurately the interactions between urbanization processes, rural logistics progression, and carbon emissions. The findings demonstrate that urban construction significantly drives rural logistics development and uncover a pronounced nonlinear relationship among urbanization, rural logistics development (with a significant pull effect of 4.2), and carbon emissions growth. This research highlights the subtle balance between rural-urban development and environmental management, providing theoretical backing for the creation of sustainable policy frameworks in rural contexts and setting a foundation for future research in this domain.
Citation: Dongmei Zhang. Unveiling dynamics of urbanization, rural logistics, and carbon emissions: A study based on China's empirical data[J]. Mathematical Biosciences and Engineering, 2024, 21(2): 2731-2752. doi: 10.3934/mbe.2024121
In an era where global focus intensifies on sustainable development, in this study, I investigate the interplay between rapid urbanization, rural logistics evolution, and carbon dynamics in China. We aim to bridge the gap in existing literature by examining the tripartite relationship between these areas and their collective impact on sustainable development. I explore the dynamic interaction mechanisms between urban construction, rural logistics development, and carbon emissions, assessing their joint influence on sustainable development. A detailed analysis of demand dynamics and market mechanisms supporting urbanization, rural logistics development, and carbon emissions has been initiated, leading to the establishment of a theoretical framework. This framework adeptly captures the interdependencies and constraints among these variables, offering a mathematical and bioscientific perspective to understand their complex interactions. Furthermore, a sophisticated nonlinear model based on key quantitative indicators like urbanization level, rural logistics development, and carbon emissions has been incorporated. Considering the multivariate nature, uncertainty, and dynamism presented by the nonlinear model, genetic algorithms have been employed for the estimation of model parameters. Through rigorous empirical testing using data from China spanning the years 1991–2021, I not only validate the effectiveness of the model but also accurately the interactions between urbanization processes, rural logistics progression, and carbon emissions. The findings demonstrate that urban construction significantly drives rural logistics development and uncover a pronounced nonlinear relationship among urbanization, rural logistics development (with a significant pull effect of 4.2), and carbon emissions growth. This research highlights the subtle balance between rural-urban development and environmental management, providing theoretical backing for the creation of sustainable policy frameworks in rural contexts and setting a foundation for future research in this domain.

| [1] |
M. S. Anjum, S. M. Ali, M. Imad-Ud-Din, M. A. Subhani, M. N. Anwar, A.S. Nizami, et al., An emerged challenge of air pollution and ever-increasing particulate matter in Pakistan; a critical review, J. Hazard. Mater., 402 (2021), 123943. https://doi.org/10.1016/j.jhazmat.2020.123943 doi: 10.1016/j.jhazmat.2020.123943

|
| [2] |
X. Wu, Long La Niña events could rise in frequency as the planet warms, Nature, 619 (2023), 702–703. http://doi.org/10.1038/d41586-023-02331-z doi: 10.1038/d41586-023-02331-z
|
| [3] |
E. M. Fischer, U. Beyerle, L. Bloin-Wibe, C. Gessner, V. Humphrey, F. Lehner, et al., Storylines for unprecedented heatwaves based on ensemble boosting, Nat. Commun., 14 (2023), 4643. https://doi.org/10.1038/s41467-023-40112-4 doi: 10.1038/s41467-023-40112-4
|
| [4] |
C. Cao, X. Guan, W. Sun, S. Guo, B. Chen, Changes of extreme high temperature by global warming in the Northern Hemisphere, J. Appl. Meteorol. Climatol., 62 (2023), 3–11. https://doi.org/10.1175/JAMC-D-22-0043.1 doi: 10.1175/JAMC-D-22-0043.1
|
| [5] |
M. L. Tseng, T. D. Bui, M. K. Lim, M. Fujii, U. Mishra, Assessing data-driven sustainable supply chain management indicators for the textile industry under industrial disruption and ambidexterity, Int. J. Product. Econom., 245 (2022), 108401. https://doi.org/10.1016/j.ijpe.2021.108401 doi: 10.1016/j.ijpe.2021.108401
|
| [6] |
J. Pospisil, Dissolving conflict. Local peace agreements and armed conflict transitions, Peacebuilding, 10 (2022), 122–137. https://doi.org/10.1080/21647259.2022.2032945 doi: 10.1080/21647259.2022.2032945
|
| [7] |
U. Shahzad, K. S. Mohammed, S. Tiwari, J. Nakonieczny, R. Nesterowicz, Connectedness between geopolitical risk, financial instability indices and precious metals markets: novel findings from Russia Ukraine conflict perspective, Resour. Policy, 80 (2023), 103190. https://doi.org/10.1016/j.resourpol.2022.103190 doi: 10.1016/j.resourpol.2022.103190
|
| [8] |
I. Ali, A. Arslan, S. Tarba, T. Mainela, Supply chain resilience to climate change inflicted extreme events in agri-food industry: the role of social capital and network complexity, Int. J. Product. Econom., 264 (2023), 108968. https://doi.org/10.1016/j.ijpe.2023.108968 doi: 10.1016/j.ijpe.2023.108968
|
| [9] |
J. Fang, A. Collins, S. Yao, On the global COVID-19 pandemic and China's FDI, J. Asian Econom., 74 (2021), 101300. https://doi.org/10.1016/j.asieco.2021.101300 doi: 10.1016/j.asieco.2021.101300
|
| [10] |
M. Cai, J. Luo, Influence of COVID-19 on manufacturing industry and corresponding countermeasures from supply chain perspective, J. Shanghai Jiaotong Univ., 25 (2020), 409–416. https://doi.org/10.1007/s12204-020-2206-z doi: 10.1007/s12204-020-2206-z
|
| [11] |
J. J. Ou, L. Y. He, Opportunity or challenge? Carbon emissions reduction under new development pattern of dual circulation, Sustainability, 15 (2023), 1757. https://doi.org/10.3390/su15031757 doi: 10.3390/su15031757
|
| [12] |
L. Liu, X. Wang, Z. Wang, Recent progress and emerging strategies for carbon peak and carbon neutrality in China, Greenhouse Gases Sci. Technol., 13 (2023), 732–759. https://doi.org/10.1002/ghg.2235 doi: 10.1002/ghg.2235
|
| [13] |
B. Yang, A study of regional economic disparities and coordinated development based on improving grey model combinations, Scient. Programm. 2022 (2022), 3695361. https://doi.org/10.1155/2022/3695361 doi: 10.1155/2022/3695361
|
| [14] |
Q. Zhu, C. Xie, J. B. Liu, The impact of population agglomeration on ecological resilience: evidence from China, Math. Biosci. Eng., 20 (2023), 15898–15917. https://doi.org/10.3934/mbe.2023708 doi: 10.3934/mbe.2023708
|
| [15] |
L. Xu, D. Wang, J. Du, The heterogeneous influence of infrastructure construction on China's urban green and smart development—The threshold effect of urban scale, Land, 10 (2021), 1015. https://doi.org/10.3390/land10101015 doi: 10.3390/land10101015
|
| [16] |
M. Ahmad, G. Jabeen, Dynamic causality among urban agglomeration, electricity consumption, construction industry, and economic performance: generalized method of moments approach, Environ. Sci. Pollut. Res., 27 (2020), 2374–2385. https://doi.org/10.1007/s11356-019-06905-1 doi: 10.1007/s11356-019-06905-1
|
| [17] |
A. Yusuf, Dynamic effects of energy consumption, economic growth, international trade and urbanization on environmental degradation in Nigeria, Energy Strategy Rev., 50 (2023), 101228. https://doi.org/10.1016/j.esr.2023.101228 doi: 10.1016/j.esr.2023.101228
|
| [18] |
J. Wang, J. Chen, R. Li, Outward foreign direct investment and urban green productivity: promote or inhibit? International Rev. Econom. Finance, 88 (2023), 516–530. https://doi.org/10.1016/j.iref.2023.06.040 doi: 10.1016/j.iref.2023.06.040
|
| [19] |
Y. Long, S. Ayyoob, L. Huang, J. Chen, Urban carbon accounting: an overview, Urban Clim., 44 (2022), 101195. https://doi.org/10.1016/j.uclim.2022.101195 doi: 10.1016/j.uclim.2022.101195
|
| [20] |
H. Lu, J. Bao, Spatial differentiation effect of rural logistics in urban agglomerations in China based on the fuzzy neural network, Sustainability, 14 (2022), 9268. https://doi.org/10.3390/su14159268 doi: 10.3390/su14159268
|
| [21] |
D. Zhang, L. Wang, J. Xu, K. Chen, Simulation analysis of the evolutionary mechanism of low-carbon rural logistics, DYNA-Ingeniería e Industria, 96 (2021), 484–491. https://doi.org/10.6036/10236 doi: 10.6036/10236
|
| [22] |
W. Yao, W. Zhang, W. Li, Promoting the development of marine low carbon through the digital economy, J. Innov. Knowl., 8 (2023), 100285. https://doi.org/10.1016/j.jik.2022.100285 doi: 10.1016/j.jik.2022.100285
|
| [23] |
Z. Zhang, G. Hu, X. Mu, L. Kong, From low carbon to carbon neutrality: a bibliometric analysis of the status, evolution and development trend, J. Environ. Manage., 322 (2022), 116087. https://doi.org/10.1016/j.jenvman.2022.116087 doi: 10.1016/j.jenvman.2022.116087
|
| [24] |
S. Behrends, Recent developments in urban logistics research – A review of the proceedings of the international conference on city logistics 2009-2013, Transport. Res. Procedia, 12 (2016), 278–287. https://doi.org/10.1016/j.trpro.2016.02.065 doi: 10.1016/j.trpro.2016.02.065
|
| [25] |
T. Y. Liu, C. W. Su, Is transportation improving urbanization in China? Socio-Econom. Planning Sci., 77 (2021), 101034. https://doi.org/10.1016/j.seps.2021.101034 doi: 10.1016/j.seps.2021.101034
|
| [26] |
R. P. Pradhan, M. B. Arvin, M. Nair, Urbanization, transportation infrastructure, ICT, and economic growth: a temporal causal analysis, Cities, 115 (2021), 103213. https://doi.org/10.1016/j.cities.2021.103213 doi: 10.1016/j.cities.2021.103213
|
| [27] |
M. Chanieabate, H. He, C. Guo, B. Abrahamgeremew, Y. Huang, Examining the relationship between transportation infrastructure, urbanization level and rural-urban income gap in China, Sustainability, 15 (2023), 8410. https://doi.org/10.3390/su15108410 doi: 10.3390/su15108410
|
| [28] |
C. T. Tan, W. He, Y. R. Liu, Interregional transaction costs, industrial productivity and spatially-differentiated urbanization, Nankai Econom. Studies, 2021 (2021), 162–178+252. http://doi.org/10.14116/j.nkes.2021.06.010 doi: 10.14116/j.nkes.2021.06.010
|
| [29] |
H. C. Liu, X. L. Chen, X. F. Wang, Research on the threshold effect of urbanization and logistics total factor productivity, Rev. Econ. Manage., 36 (2020), 123–132. http://doi.org/10.13962/j.cnki.37-1486/f.2020.02.012 doi: 10.13962/j.cnki.37-1486/f.2020.02.012
|
| [30] | B. Liu, K. Cheng, Z. Ma, Research on the impacts of urbanization on logistics carbon emission changes, China Popul. Resour. Environ., 26 (2016), 54–60. |
| [31] |
J. Lin, S. Lu, X. He, F. Wang, Analyzing the impact of three-dimensional building structure on CO2 emissions based on random forest regression, Energy, 236 (2021), 121502. https://doi.org/10.1016/j.energy.2021.121502 doi: 10.1016/j.energy.2021.121502
|
| [32] |
Y. Tan, Y. Liu, Y. Chen, Z. Zhang, D. Wu, H. Chen, et al., The impact of urban construction land change on carbon emissions—A case study of Wuhan city, Int. J. Environ. Res. Public Health, 20 (2023), 922. https://doi.org/10.3390/ijerph20020922 doi: 10.3390/ijerph20020922
|
| [33] |
S. Z. Huang, M. Sadiq, F. Chien, The impact of natural resource rent, financial development, and urbanization on carbon emission, Environ. Sci. Pollut. Res., 30 (2023), 42753–42765. https://doi.org/10.1007/s11356-021-16818-7 doi: 10.1007/s11356-021-16818-7
|
| [34] |
S. Zeng, A. Tanveer, X. Fu, Y. Gu, M. Irfan, Modeling the influence of critical factors on the adoption of green energy technologies, Renew. Sustain. Energy Rev., 168 (2022), 112817. https://doi.org/10.1016/j.rser.2022.112817 doi: 10.1016/j.rser.2022.112817
|
| [35] | X. Wang, Y. Cheng, Research on the influencing mechanism of urbanization on carbon emission efficiency—Based on an empirical study of 118 countries, World Regional Studies, 29 (2020), 503–511. |
| [36] |
D. Zhang, Z. Wang, S. Li, H. Zhang, Impact of land urbanization on carbon emissions in urban agglomerations of the middle reaches of the Yangtze River, Int. J. Environ. Res. Public Health, 18 (2021), 1403. https://doi.org/10.3390/ijerph18041403 doi: 10.3390/ijerph18041403
|
| [37] |
M. Shahbaz, N. Loganathan, A. T. Muzaffar, K. Ahmed, M. A. Jabran, How urbanization affects CO2 emissions in Malaysia? The application of STIRPAT model, Renew. Sustain. Energy Rev., 57 (2016), 83–93. https://doi.org/10.1016/j.rser.2015.12.096 doi: 10.1016/j.rser.2015.12.096
|
| [38] |
Y. Wang, W. Chen, M. Zhao, B. Wang, Analysis of the influencing factors on CO2 emissions at different urbanization levels: regional difference in China based on panel estimation, Nat. Hazards, 96 (2019), 627–645. https://doi.org/10.1007/s11069-018-3561-z doi: 10.1007/s11069-018-3561-z
|
| [39] |
J. Peng, Y. Zheng, C. Liu, The impact of urban construction land use change on carbon emissions: evidence from the China land market in 2000-2019, Land, 11 (2022), 1440. https://doi.org/10.3390/land11091440 doi: 10.3390/land11091440
|
| [40] |
Z. Cheng, X. Hu, The effects of urbanization and urban sprawl on CO2 emissions in China, Environ. Dev. Sustain., 25 (2023), 1792–1808. https://doi.org/10.1007/s10668-022-02123-x doi: 10.1007/s10668-022-02123-x
|
| [41] |
S. Lu, Y. Liu, Evaluation system for the sustainable development of urban transportation and ecological environment based on SVM, J. Intell. Fuzzy Syst., 34 (2018), 831–838. https://doi.org/10.3233/JIFS-169376 doi: 10.3233/JIFS-169376
|
| [42] |
W. L. Zheng, J. W. Wang, X. H. Mao, J. F. Li, Ecological efficiency evaluation and spatiotemporal characteristics analysis of the linkage development of the logistics industry and manufacturing industry, Front. Energy Res., 9 (2022), 709582. https://doi.org/10.3389/fenrg.2021.709582 doi: 10.3389/fenrg.2021.709582
|
| [43] |
C. Zhu, M. Wang, Y. Yang, Analysis of the influencing factors of regional carbon emissions in the Chinese transportation industry, Energies, 13 (2020), 1100. https://doi.org/10.3390/en13051100 doi: 10.3390/en13051100
|
| [44] |
H. A. Karaduman, A. Karaman-Akgül, M. Çağlar, H. E. Akbaş, The relationship between logistics performance and carbon emissions: an empirical investigation on Balkan countries, Int. J. Clim. Change Strat. Manage., 12 (2020), 449–461. https://doi.org/10.1108/IJCCSM-05-2020-0041 doi: 10.1108/IJCCSM-05-2020-0041
|
| [45] |
S. Zhang, J. Wang, W. Zheng, Decomposition analysis of energy-related CO2 emissions and decoupling status in China's logistics industry, Sustainability, 10 (2018), 1340. https://doi.org/10.3390/su10051340 doi: 10.3390/su10051340
|
| [46] |
C. Zhang, W. Zhang, W. Luo, X. Gao, B. Zhang, Analysis of influencing factors of carbon emissions in China's logistics industry: a GDIM-based indicator decomposition, Energies, 14 (2021), 5742. https://doi.org/10.3390/en14185742 doi: 10.3390/en14185742
|
| [47] | G. L. Zhang, D. Li, An analysis of relationship among energy consumption, carbon emissions, and economic growth on China's logistics, Sci. Technol. Manage. Res., 35 (2015), 238–243. |
| [48] |
W. Liang, Z.H. Fang, Study on the dynamic relationship between logistics industry growth, urbanization, and carbon emissions, Jianghan Academ., 38 (2019), 73–81. http://doi.org/10.16388/j.cnki.cn42-1843/c.2019.04.008 doi: 10.16388/j.cnki.cn42-1843/c.2019.04.008
|
| [49] |
B. Liu, Y. Wang, X. Chang, B. Nie, L. Meng, Y. Li, Does land urbanization affect the catch-up effect of carbon emissions reduction in China's logistics? Land, 11 (2022), 1503. https://doi.org/10.3390/land11091503 doi: 10.3390/land11091503
|
| [50] |
C. Rossi, C. Falcomer, L. Biondani, D. Pontara, Genetically optimized extended Kalman filter for state of health estimation based on Li-Ion batteries parameters, Energies, 15 (2022), 3404. https://doi.org/10.3390/en15093404 doi: 10.3390/en15093404
|
| [51] |
J. Lin, X. Li, Y. Wen, P. He, Modeling urban land-use changes using a landscape-driven patch-based cellular automaton (LP-CA), Cities, 132 (2023), 103906. https://doi.org/10.1016/j.cities.2022.103906 doi: 10.1016/j.cities.2022.103906
|
| [52] |
W. Liu, S. Wang, D. Dong, J. Wang, Evaluation of the intelligent logistics eco-index: evidence from China, J. Cleaner Prod., 274 (2020), 123127. https://doi.org/10.1016/j.jclepro.2020.123127 doi: 10.1016/j.jclepro.2020.123127
|
| [53] |
Y. C. Lin, C. L. Chen, C. F. Chao, W. H. Chen, H. Pandia, The study of evaluation index of growth evaluation of science and technological innovation micro-enterprises, Sustainability, 12 (2020), 6233. https://doi.org/10.3390/su12156233 doi: 10.3390/su12156233
|
| [54] |
G. X. Yao, X. Y. Bian, Y. He, Construction and simulation of rural logistics system dynamics model from the perspective of low-carbon economy, Soft Sci., 32 (2018), 60–66. http://doi.org/10.13956/j.ss.1001-8409.2018.02.13 doi: 10.13956/j.ss.1001-8409.2018.02.13
|
| [55] |
C. Gu, Urbanization: processes and driving forces, Sci. China Earth Sci., 62 (2019), 1351–1360. https://doi.org/10.1007/s11430-018-9359-y doi: 10.1007/s11430-018-9359-y
|
| [56] |
Y. Shen, J. Liu, W. Tian, Interaction between international trade and logistics carbon emissions, Energy Rep., 8 (2022), 10334–10345. https://doi.org/10.1016/j.egyr.2022.07.159 doi: 10.1016/j.egyr.2022.07.159
|


Figures(6) / Tables(3)

Dongmei Zhang. Unveiling dynamics of urbanization, rural logistics, and carbon emissions: A study based on China's empirical data[J]. Mathematical Biosciences and Engineering, 2024, 21(2): 2731-2752. doi: 10.3934/mbe.2024121


 DownLoad: