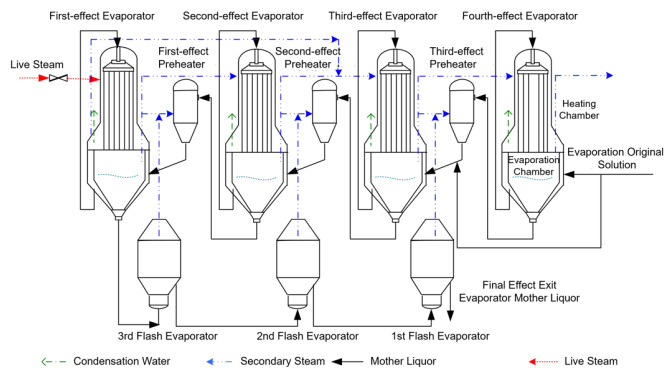
To address the significant soft measurement errors in traditional static models for evaporation process parameters, which are characterized by continuity and cumulativity, this paper proposes a dynamic correction method for soft measurement models of evaporation process parameters based on the autoregressive moving-average model (ARMA). Initially, the Powell's directional evolution (Powell-DE) algorithm is utilized to identify the autoregressive order and moving average order of the ARMA model. Subsequently, the prediction error of a mechanism-reduced robust least squares support vector machine ensemble model is utilized as input. An error time series prediction model, which compensates for the errors in the autoregressive moving average model, is then applied for dynamic estimation of the prediction error. Finally, an integration strategy using the entropy method is employed to combine the static soft measurement model, based on the mechanism-reduced robust least squares support vector machine, with the dynamic correction soft measurement model, which is based on the error time series compensation of the ARMA model. The new model is analyzed and validated using production data from an alumina plant's evaporation process. Compared to traditional models, the new model demonstrates significantly improved prediction accuracy and is capable of dynamic prediction of evaporation process parameters.
Citation: Xiaoshan Qian, Lisha Xu, Xinmei Yuan. Dynamic correction of soft measurement model for evaporation process parameters based on ARMA[J]. Mathematical Biosciences and Engineering, 2024, 21(1): 712-735. doi: 10.3934/mbe.2024030
To address the significant soft measurement errors in traditional static models for evaporation process parameters, which are characterized by continuity and cumulativity, this paper proposes a dynamic correction method for soft measurement models of evaporation process parameters based on the autoregressive moving-average model (ARMA). Initially, the Powell's directional evolution (Powell-DE) algorithm is utilized to identify the autoregressive order and moving average order of the ARMA model. Subsequently, the prediction error of a mechanism-reduced robust least squares support vector machine ensemble model is utilized as input. An error time series prediction model, which compensates for the errors in the autoregressive moving average model, is then applied for dynamic estimation of the prediction error. Finally, an integration strategy using the entropy method is employed to combine the static soft measurement model, based on the mechanism-reduced robust least squares support vector machine, with the dynamic correction soft measurement model, which is based on the error time series compensation of the ARMA model. The new model is analyzed and validated using production data from an alumina plant's evaporation process. Compared to traditional models, the new model demonstrates significantly improved prediction accuracy and is capable of dynamic prediction of evaporation process parameters.

| [1] |
Z. Chen, S. X. Ding, K. Zhang, Z. Li, Z. Hu, Canonical correlation analysis-based fault detection methods with application to alumina evaporation process, Control. Eng. Pract., 46 (2016), 51–58. https://doi.org/10.1016/j.conengprac.2015.10.006 doi: 10.1016/j.conengprac.2015.10.006

|
| [2] |
K. Zhang, K. Peng, S. Zhao, F. Wang, A novel feature-extraction-based process monitoring method for multimode processes with common features and its applications to a rolling process, IEEE Trans. Ind. Inf., 17 (2021), 6466–6475. https://doi.org/10.1109/TII.2020.3012024 doi: 10.1109/TII.2020.3012024
|
| [3] |
Z. Zhang, H. Cheng, Z. Ye, H. Mei, G. Zhang, Tensor-temporal extension locality preserving projection algorithm for dynamic chemical process fault detection (in Chinese), J. East China Univ. Technol., 44 (2028), 496–503. https://doi.org/10.14135/j.cnki.1006-3080.20171213004 doi: 10.14135/j.cnki.1006-3080.20171213004
|
| [4] |
X. Zhang, Z. Ge, Local parameter optimization of lssvm for industrial soft sensing with big data and cloud implementation, IEEE Trans. Ind. Inf., 16 (2020), 2917–2928. https://doi.org/10.1109/TII.2019.2900479 doi: 10.1109/TII.2019.2900479
|
| [5] |
H. Su, W. Qi, Y. Hu, H. R. Karimi, G. Ferrigno, E. De Momi, An incremental learning framework for human-like redundancy optimization of anthropomorphic manipulators, IEEE Trans. Ind. Inf., 18 (2022), 1864–1872. https://doi.org/10.1109/TII.2020.3036693 doi: 10.1109/TII.2020.3036693
|
| [6] |
X. Song, J. Zhao, J. Song, F. Dong, L. Xu, J. Zhao, Local demagnetization fault recognition of permanent magnet synchronous linear motor based on s-transform and pso–lssvm, IEEE Trans. Power Electron., 35 (2020), 7816–7825. https://doi.org/10.1109/TPEL.2020.2967053 doi: 10.1109/TPEL.2020.2967053
|
| [7] |
M. Kano, K. Fujiwara, Virtual sensing technology in process industries: Trends and challenges revealed by recent industrial applications, J. Chem. Eng. Jpn., 46 (2013), 1–17. https://doi.org/10.1252/jcej.12we167 doi: 10.1252/jcej.12we167
|
| [8] | J. Wang, Y. Yin, L. Zhang, G. Xiao, J. Cui, S. Zhang, Online monitoring system of alumina concentration in aluminum electrolytic cell, in 2016 IEEE International Conference on Information and Automation (ICIA), IEEE, (2016), 1100–1104. https://doi.org/10.1109/ICInfA.2016.7831983 |
| [9] |
Y. Wang, Z. Liu, J. Xu, W. Yan, Heterogeneous network representation learning approach for ethereum identity identification, IEEE Trans. Comput. Social Syst., 10 (2023), 890–899. https://doi.org/10.1109/TCSS.2022.3164719 doi: 10.1109/TCSS.2022.3164719
|
| [10] |
W. Qi, H. Fan, H. R. Karimi, H. Su, An adaptive reinforcement learning-based multimodal data fusion framework for human–robot confrontation gaming, Neural Networks, 164 (2023), 489–496. https://doi.org/10.1016/j.neunet.2023.04.043 doi: 10.1016/j.neunet.2023.04.043
|
| [11] |
J. Zhao, Y. Lv, Output-feedback robust tracking control of uncertain systems via adaptive learning, Int. J. Control Autom. Syst., 21 (2023), 1108–1118. https://doi.org/10.1007/s12555-021-0882-6 doi: 10.1007/s12555-021-0882-6
|
| [12] | J. A. Suykens, L. Lukas, J. Vandewalle, Sparse least squares support vector machine classifiers, in ESANN 2000, 8th European Symposium on Artificial Neural Networks, (2000), 26–28. |
| [13] |
Q. Zhu, Y. Zhen, Process neural network based on moving windows for chemical soft-sensing (in Chinese), J. Tsinghua Univ., 52 (2012), 1165–1170. https://doi.org/10.16511/j.cnki.qhdxxb.2012.09.006 doi: 10.16511/j.cnki.qhdxxb.2012.09.006
|
| [14] |
X. Li, H. Su, J. Chu, Multiple models soft-sensing technique based on online clustering arithmetic (in Chinese), J. Chem. Ind. Eng. China, 58 (2007), 2834. https://doi.org/10.3321/j.issn:0438-1157.2007.11.025 doi: 10.3321/j.issn:0438-1157.2007.11.025
|
| [15] |
M. Huang, H. Hang, J. Chu, Q. Ye, S. Zhang, Application of artificial neural network to state estimation of process of erythromycin fermentation (in Chinese), J. East China Univ. Technol., 2000 (2000), 162–164+176. https://doi.org/10.14135/j.cnki.1006-3080.2000.02.015 doi: 10.14135/j.cnki.1006-3080.2000.02.015
|
| [16] | K. Liu, Y. Tan, X. He, Particle swarm optimization based learning algorithm for process neural networks, in Advances in Neural Networks-ISNN 2010, Springer, (2010), 280–287. https://doi.org/10.1007/978-3-642-13278-0_36 |
| [17] |
Y. Wang, Z. Li, C. Liu, Prediction forcoal bed gasoutput based on fractal and arima (in Chinese), Nat. Gas Oil, 29 (2011), 45–48. https://doi.org/10.3969/j.issn.1006-5539.2011.03.014 doi: 10.3969/j.issn.1006-5539.2011.03.014
|
| [18] |
W. Cai, J. Li, Mobile Ad Hoc network path length prediction based on MA model (in Chinese), J. Inner Mongolia Norm. Univ., 2015 (2015), 533–537. https://doi.org/10.3969/j.issn.1001-8735.2015.04.025 doi: 10.3969/j.issn.1001-8735.2015.04.025
|
| [19] |
H. Wang, Bayesian analysis of moving average model ma under time series (in Chinese), J. Huaihai Inst. Technol., 28 (2019), 1–4. https://doi.org/10.3969/j.issn.1672-6685.2019.02.001 doi: 10.3969/j.issn.1672-6685.2019.02.001
|
| [20] |
A. Zeroual, F. Harrou, Y. Sun, N. Messai, Integrating model-based observer and kullback–leibler metric for estimating and detecting road traffic congestion, IEEE Sens. J., 18 (2018), 8605–8616. https://doi.org/10.1109/JSEN.2018.2866678 doi: 10.1109/JSEN.2018.2866678
|
| [21] |
M. Gan, H. X. Li, H. Peng, A variable projection approach for efficient estimation of rbf-arx model, IEEE Trans. Cybern., 45 (2015), 462–471. https://doi.org/10.1109/TCYB.2014.2328438 doi: 10.1109/TCYB.2014.2328438
|
| [22] |
L. Liu, J. Zuo, J. Wu, Q. Deng, Predictive control of three-tank water tank system based on rbf-arx mode (in Chinese), Comput. Digit. Eng., 45 (2017), 1774–1778. https://doi.org/10.3969/j.issn.1672-9722.2017.09.018 doi: 10.3969/j.issn.1672-9722.2017.09.018
|
| [23] |
S. Huang, Application of fuzzy arx-rbf model on car hydraulic braking system fault diagnosis (in Chinese), Small Intern. Combust. Eng. Veh. Tech., 47 (2018), 51–53. https://doi.org/10.3969/j.issn.1671-0630.2018.01.010 doi: 10.3969/j.issn.1671-0630.2018.01.010
|
| [24] |
R. Sarwar, H. Cho, S. J. Cox, P. J. Mago, R. Luck, Field validation study of a time and temperature indexed autoregressive with exogenous (ARX) model for building thermal load prediction, Energy, 119 (2017), 483–496. https://doi.org/10.1016/j.energy.2016.12.083 doi: 10.1016/j.energy.2016.12.083
|
| [25] |
M. Baptista, S. Sankararaman, I. P. de Medeiros, C. Nascimento Júnior, H. Prendinger, E. M. Henriques, Forecasting fault events for predictive maintenance using data-driven techniques and arma modeling, Comput. Ind. Eng., 115 (2018), 41–53. https://doi.org/10.1016/j.cie.2017.10.033 doi: 10.1016/j.cie.2017.10.033
|
| [26] |
Y. Shen, J. Guo, X. Liu, Q. Kong, L. Guo, W. Li, Long-term prediction of polar motion using a combined SSA and ARMA model, J. Geod., 92 (2018), 333–343. https://doi.org/10.1007/s00190-017-1065-3 doi: 10.1007/s00190-017-1065-3
|
| [27] |
H. Geng, W. Wang, Photovoltaic power day-ahead prediction method based on data residual components and arma model (in Chinese), Ind. Instrum. Autom., 2019 (2019), 3–7. https://doi.org/10.3969/j.issn.1000-0682.2019.01.001 doi: 10.3969/j.issn.1000-0682.2019.01.001
|
| [28] |
Y. Fu, A dynamic soft sensor modeling method and its industrial application (in Chinese), Autom. Instrum., 32 (2011), 67–70. https://doi.org/10.16086/j.cnki.issn1000-0380.2011.09.012 doi: 10.16086/j.cnki.issn1000-0380.2011.09.012
|
| [29] |
L. Wang, D. Li, M. Yu, Z. Zhang, Z. Niu, A method of model updating based on dynamic weighting coefficients and multi-objective evolution (in Chinese), J. Vib. Shock, 39 (2020), 284–290. https://doi.org/10.13465/j.cnki.jvs.2020.04.038 doi: 10.13465/j.cnki.jvs.2020.04.038
|
| [30] |
Z. Jiang, X. Li, W. Gui, Y. Xie, C. Yang, Blast furnace stockline prediction by segmented linear-regression and dynamic weighting neural network (in Chinese), Control Theory Appl., 32 (2015), 801–809. https://doi.org/10.7641/CTA.2015.50033 doi: 10.7641/CTA.2015.50033
|
| [31] |
K. Di, Y. Wang, C. Shang, D. Huang, Dynamic soft sensor modeling based on nonlinear slow feature regression (in Chinese), Comput. Appl. Chem., 33 (2016), 1160–1164. https://doi.org/10.16866/j.com.app.chem201611004 doi: 10.16866/j.com.app.chem201611004
|
| [32] |
Anamika, R. Peesapati, N. Kumar, Electricity price forecasting and classification through wavelet–dynamic weighted PSO–FFNN approach, IEEE Syst. J., 12 (2018), 3075–3084. https://doi.org/10.1109/JSYST.2017.2717446 doi: 10.1109/JSYST.2017.2717446
|
| [33] | D. Hu, B. Liu, Determining the structure of arma models using neural networks, Prediction, 17 (1998), 33–35. |
| [34] | X. Qian, C. Yang, L. Xu, Powell-DE algorithm and its application in estimating soft sensor parameter, J. Hunan Univ. Nat. Sci., 40 (2013), 67–73. |
| [35] | G. Chen, New technique for determining the order of arma model based on genetic algorithm, J. Mech. Eng., 41 (2005), 41–45. |
| [36] | C. Li, S. Wang, X. Zhang, Dynamic soft sensor modeling based on multiple least squares support vector machines, in 2008 7th World Congress on Intelligent Control and Automation, IEEE, (2008), 4315–4319. https://doi.org/10.1109/WCICA.2008.4593616 |
| [37] |
W. Qi, H. Su, A cybertwin based multimodal network for ECG patterns monitoring using deep learning, IEEE Trans. Ind. Inf., 18 (2022), 6663–6670. https://doi.org/10.1109/TII.2022.3159583 doi: 10.1109/TII.2022.3159583
|
| [38] |
W. Qi, S. E. Ovur, Z. Li, A. Marzullo, R. Song, Multi-sensor guided hand gesture recognition for a teleoperated robot using a recurrent neural network, IEEE Rob. Autom. Lett., 6 (2021), 6039–6045. https://doi.org/10.1109/LRA.2021.3089999 doi: 10.1109/LRA.2021.3089999
|
| [39] |
D. S. Lee, M. W. Lee, S. H. Woo, Y. J. Kim, J. M. Park, Nonlinear dynamic partial least squares modeling of a full-scale biological wastewater treatment plant, Process Biochem., 41 (2006), 2050–2057. https://doi.org/10.1016/j.procbio.2006.05.006 doi: 10.1016/j.procbio.2006.05.006
|
| [40] |
D. M. Himmelblau, Accounts of experiences in the application of artificial neural networks in chemical engineering, Ind. Eng. Chem. Res., 47 (2008), 5782–5796. https://doi.org/10.1021/ie800076s doi: 10.1021/ie800076s
|
| [41] |
T. H. Pan, D. S. H. Wong, S. S. Jang, Development of a novel soft sensor using a local model network with an adaptive subtractive clustering approach, Ind. Eng. Chem. Res., 49 (2010), 4738–4747. https://doi.org/10.1021/ie901098w doi: 10.1021/ie901098w
|
| [42] |
X. Dai, W. Wang, Y. Ding, Z. Sun, "Assumed inherent sensor" inversion based ann dynamic soft-sensing method and its application in erythromycin fermentation process, Comput. Chem. Eng., 30 (2006), 1203–1225. https://doi.org/10.1016/j.compchemeng.2006.02.001 doi: 10.1016/j.compchemeng.2006.02.001
|
| [43] | X. He, J. Liang, S. Xu, Learning and applications of procedure neural networks, Eng. Sci., 3 (2001), 31–35. |
| [44] | J. Ohl, M. Ayoubi, M. Kurth, Identification of a high efficiency boiler based on neural networks with locally distributed dynamics, in Proceedings of the 1996 IEEE International Symposium on Intelligent Control, IEEE, (1996), 426–431. https://doi.org/10.1109/ISIC.1996.556239 |
| [45] | H. Sun, Research on Wind Speed Prediction of Wind Turbines Based on ARMA Model, PhD thesis, North China Electric Power University (Beijing), 2011. |
| [46] |
H. Su, W. Qi, C. Yang, J. Sandoval, G. Ferrigno, E. De Momi, Deep neural network approach in robot tool dynamics identification for bilateral teleoperation, IEEE Rob. Autom. Lett., 5 (2020), 2943–2949. https://doi.org/10.1109/LRA.2020.2974445 doi: 10.1109/LRA.2020.2974445
|
| [47] |
H. Su, Y. Hu, H. R. Karimi, A. Knoll, G. Ferrigno, E. De Momi, Improved recurrent neural network-based manipulator control with remote center of motion constraints: Experimental results, Neural Networks, 131 (2020), 291–299. https://doi.org/10.1016/j.neunet.2020.07.033 doi: 10.1016/j.neunet.2020.07.033
|
| [48] | X. Qian, Soft Sensor Modeling and Application of Alumina Multi-effect Falling Film Evaporation Process, Master's thesis, Central South University, 2016. |
| [49] | T. Zhang, Time Series Mining Based on ARMA Model, Master's thesis, Hefei University of Technology, 2013. |
| [50] | T. Chen, Coke Oven Fire Channel Temperature Soft Measurement Integrated Model Based on Multi-rate Sampling, Master's thesis, Central South University, 2008. |
| [51] | Y. Wang, Research on Intelligent Integrated Modeling Theory and Its Application in Optimal Control of Non-ferrous Smelting Process, PhD thesis, Central South University, 2001. |
| [52] |
M. Y. Yan, W. H. Gui, C. H. Yang, Prediction model of cobalt ion concentration based on intelligent fusion strategy (in Chinese), Control Decis., 26 (2011), 707–711. https://doi.org/10.13195/j.cd.2011.05.70.yanmy.004 doi: 10.13195/j.cd.2011.05.70.yanmy.004
|
| [53] | X. Fu, M. Zou, Application of combination weighting method in contract risk's evaluation of third party logistics, J. Southeast Univ., 23 (2007), 128–132. |


Figures(11) / Tables(2)

Xiaoshan Qian, Lisha Xu, Xinmei Yuan. Dynamic correction of soft measurement model for evaporation process parameters based on ARMA[J]. Mathematical Biosciences and Engineering, 2024, 21(1): 712-735. doi: 10.3934/mbe.2024030


 DownLoad: