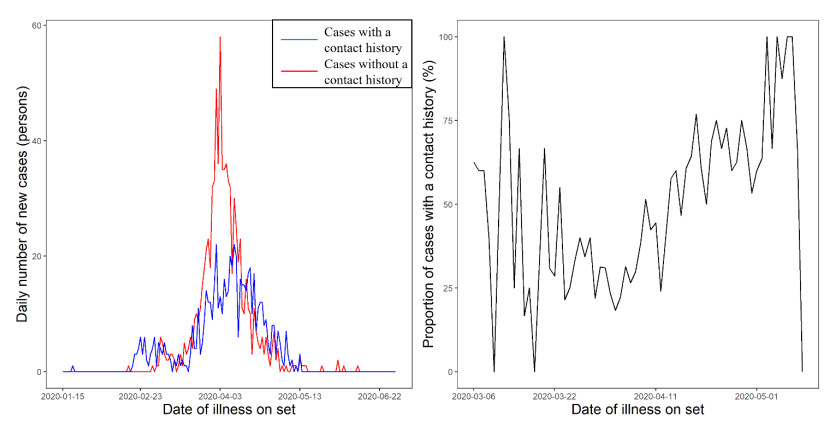
The purpose of the present study was to develop a transmission model of COVID-19 cases with and without a contact history to understand the meaning of the proportion of infected individuals with a contact history over time. We extracted epidemiological information regarding the proportion of coronavirus disease 2019 (COVID-19) cases with a contact history and analyzed incidence data stratified by the presence of a contact history in Osaka from January 15 to June 30, 2020. To clarify the relationship between transmission dynamics and cases with a contact history, we used a bivariate renewal process model to describe transmission among cases with and without a contact history. We quantified the next-generation matrix as a function of time; thus, the instantaneous (effective) reproduction number was calculated for different periods of the epidemic wave. We objectively interpreted the estimated next-generation matrix and replicated the proportion of cases with a contact $ p\left(t\right) $ over time, and we examined the relevance to the reproduction number. We found that $ p\left(t\right) $ does not take either the maximum or minimum value at a threshold level of transmission with $ R\left(t\right) = 1.0 $. With R(t) < 1 (subcritical level), p(t) was a decreasing function of R(t). Qualitatively, the minimum $ p\left(t\right) $ was seen in the domain with $ R\left(t\right) $ > 1. An important future implication for use of the proposed model is to monitor the success of ongoing contact tracing practice. A decreasing signal of $ p\left(t\right) $ reflects the increasing difficulty of contact tracing. The present study findings indicate that monitoring $ p\left(t\right) $ would be a useful addition to surveillance.
Citation: Tong Zhang, Hiroshi Nishiura. COVID-19 cases with a contact history: A modeling study of contact history-stratified data in Japan[J]. Mathematical Biosciences and Engineering, 2023, 20(2): 3661-3676. doi: 10.3934/mbe.2023171
The purpose of the present study was to develop a transmission model of COVID-19 cases with and without a contact history to understand the meaning of the proportion of infected individuals with a contact history over time. We extracted epidemiological information regarding the proportion of coronavirus disease 2019 (COVID-19) cases with a contact history and analyzed incidence data stratified by the presence of a contact history in Osaka from January 15 to June 30, 2020. To clarify the relationship between transmission dynamics and cases with a contact history, we used a bivariate renewal process model to describe transmission among cases with and without a contact history. We quantified the next-generation matrix as a function of time; thus, the instantaneous (effective) reproduction number was calculated for different periods of the epidemic wave. We objectively interpreted the estimated next-generation matrix and replicated the proportion of cases with a contact $ p\left(t\right) $ over time, and we examined the relevance to the reproduction number. We found that $ p\left(t\right) $ does not take either the maximum or minimum value at a threshold level of transmission with $ R\left(t\right) = 1.0 $. With R(t) < 1 (subcritical level), p(t) was a decreasing function of R(t). Qualitatively, the minimum $ p\left(t\right) $ was seen in the domain with $ R\left(t\right) $ > 1. An important future implication for use of the proposed model is to monitor the success of ongoing contact tracing practice. A decreasing signal of $ p\left(t\right) $ reflects the increasing difficulty of contact tracing. The present study findings indicate that monitoring $ p\left(t\right) $ would be a useful addition to surveillance.

| [1] | World Health Organization, Weekly epidemiological update on COVID-19-5 October 2022. Available from: https://www.who.int/publications/m/item/weekly-epidemiological-update-on-covid-19---5-october-2022. |
| [2] |
A. Nunez-Delgado, E. Bontempi, M. Coccia, M. Kumar, K. Farkas, J. L. Domingo, SARS-CoV-2 and other pathogenic microorganisms in the environment, Environ. Res., 201 (2021), 111606. https://doi.org/10.1016/j.envres.2021.111606 doi: 10.1016/j.envres.2021.111606

|
| [3] | European Centre for Disease Prevention and Control, SARS-CoV-2 variants of concern as of 6 October 2022. Available from: https://www.ecdc.europa.eu/en/covid-19/variants-concern. |
| [4] |
M. Coccia, High health expenditures and low exposure of population to air pollution as critical factors that can reduce fatality rate in COVID-19 pandemic crisis: a global analysis, Environ. Res., 199 (2021), 111339. https://doi.org/10.1016/j.envres.2021.111339 doi: 10.1016/j.envres.2021.111339
|
| [5] |
M. Coccia, The relation between length of lockdown, numbers of infected people and deaths of Covid-19, and economic growth of countries: Lessons learned to cope with future pandemics similar to Covid-19 and to constrain the deterioration of economic system, Sci. Total Environ., 775 (2021), 145801. https://doi.org/10.1016/j.scitotenv.2021.145801 doi: 10.1016/j.scitotenv.2021.145801
|
| [6] |
Y. C. Wu, C. S. Chen, Y. J. Chan, The outbreak of COVID-19: An overview, J. Chin. Med. Assoc., 83 (2020), 217–220. https://doi.org/10.1097/JCMA.0000000000000270 doi: 10.1097/JCMA.0000000000000270
|
| [7] |
R. M. Anderson, C. Fraser, A. C. Ghani, C. A. Donnelly, S. Riley, N. M. Ferguson, et al., Epidemiology, transmission dynamics and control of SARS: The 2002-2003 epidemic, Phil. Trans. R. Soc. Lond. B, 359 (2004), 1091–1105. https://doi.org/10.1098/rstb.2004.1490 doi: 10.1098/rstb.2004.1490
|
| [8] |
T. Chowdhury, H. Chowdhury, E. Bontempi, M. Coccia, H. Masrur, S.M. Sait, et al., Are mega-events super spreaders of infectious diseases similar to COVID-19? A look into Tokyo 2020 Olympics and Paralympics to improve preparedness of next international events, Environ. Sci. Pollut. Res. Int., 2022. https://doi.org/10.1007/s11356-022-22660-2 doi: 10.1007/s11356-022-22660-2
|
| [9] |
W. Zhou, Y. Bai, S. Tang, The effectiveness of various control strategies: An insight from a comparison modelling study, J. Theor. Biol., 549 (2022), 111205. https://doi.org/10.1016/j.jtbi.2022.111205 doi: 10.1016/j.jtbi.2022.111205
|
| [10] |
I. Benati, M. Coccia, Effective contact tracing system minimizes COVID-19 related infections and deaths: policy lessons to reduce the impact of future pandemic diseases, J. Public Adm. Gov., 12 (2022), 19–33. https://doi.org/10.5296/jpag.v12i2.19834 doi: 10.5296/jpag.v12i2.19834
|
| [11] |
M. Mahmood, A. V. R. Amaral, J. Mateu, P. Moraga, Modeling infectious disease dynamics: Integrating contact tracing-based stochastic compartment and spatio-temporal risk models, Spat. Stat., 51 (2022), 100691. https://doi.org/10.1016/j.spasta.2022.100691 doi: 10.1016/j.spasta.2022.100691
|
| [12] |
M. Arim, D. Herrera-Esposito, P. Bermolen, A. Cabana, M. L. Fariello, M. Lima, et al., Contact tracing-induced Allee effect in disease dynamics, J. Theor. Biol., 542 (2022), 111109. https://doi.org/10.1016/j.jtbi.2022.111109 doi: 10.1016/j.jtbi.2022.111109
|
| [13] |
J. Mondal, S. Khajanchi, Mathematical modeling and optimal intervention strategies of the COVID-19 outbreak, Nonlinear Dyn., 109 (2022), 177–202. https://doi.org/10.1007/s11071-022-07235-7 doi: 10.1007/s11071-022-07235-7
|
| [14] |
Y. B. Ruhomally, M. Mungur, A. A. H. Khoodaruth, V. Oree, M. Z. Dauhoo, Assessing the impact of contact tracing, quarantine and red zone on the dynamical evolution of the covid-19 pandemic using the cellular automata aapproach and the resulting mean field system: A case study in mauritius, Appl. Math. Modell., 111 (2022), 567–589. https://doi.org/10.1016/j.apm.2022.07.008 doi: 10.1016/j.apm.2022.07.008
|
| [15] |
I. Benati, M. Coccia, Global analysis of timely COVID-19 vaccinations: improving governance to reinforce response policies for pandemic crises, Int. J. Health Gov., 27 (2022), 240–253. https://doi.org/10.1108/IJHG-07-2021-0072 doi: 10.1108/IJHG-07-2021-0072
|
| [16] |
R. Liu, J. Zhong, R. Hong, E. Chen, K. Aihara, P. Chen, Predicting local COVID-19 outbreaks and infectious disease epidemics based on landscape network entropy, Sci. Bull., 66 (2021), 2265–2270. https://doi.org/10.1016/j.scib.2021.03.022 doi: 10.1016/j.scib.2021.03.022
|
| [17] |
B. Yuan, R. Liu, S. Tang, A quantitative method to project the probability of the end of an epidemic: Application to the COVID-19 outbreak in Wuhan, J. Theor. Biol., 545 (2022), 111149. https://doi.org/10.1016/j.jtbi.2022.111149 doi: 10.1016/j.jtbi.2022.111149
|
| [18] |
M. E. Kretzschmar, G. Rozhnova, M. C. J. Bootsma, M. V. Boven, J. H. H. M. van de Wijgert, M. J. M. Bonten, Impact of delays on effectiveness of contact tracing strategies for COVID-19: A modelling study, Lancet Public Health, 5 (2020), e452–e459. https://doi.org/10.1016/S2468-2667(20)30157-2 doi: 10.1016/S2468-2667(20)30157-2
|
| [19] |
L. Ferretti, C. Wymant, M. Kendall, L. Zhao, A. Nurtay, L. Abeler-Dörner, et al., Quantifying SARS-CoV-2 transmission suggests epidemic control with digital contact tracing, Science, 368 (2020), eabb6936. https://doi.org/10.1126/science.abb6936 doi: 10.1126/science.abb6936
|
| [20] |
S. Muthaiyah, T. O. K. Zaw, K. S. M. Anbananthen, B. Park, M. J. Kim, Data driven models for contact tracing prediction: A systematic review of COVID-19, Emerg. Sci. J., 7 (2023), 17–28. https://doi.org/10.28991/ESJ-2023-SPER-02 doi: 10.28991/ESJ-2023-SPER-02
|
| [21] |
E. Mbunge, Integrating emerging technologies into COVID-19 contact tracing: Opportunities, challenges and pitfalls, Diabetes Metabol. Syndr., 14 (2020), 1631–1636. https://doi.org/10.1016/j.dsx.2020.08.029 doi: 10.1016/j.dsx.2020.08.029
|
| [22] |
N. Ahmed, R. A. Michelin, W. Xue, S. Ruj, R. Malaney, S. S. Kanhere, et al., A survey of COVID-19 contact tracing apps, IEEE Access, 8 (2020), 134577–134601. https://doi.org/10.1109/ACCESS.2020.3010226 doi: 10.1109/ACCESS.2020.3010226
|
| [23] |
I. Braithwaite, T. Callender, M. Bullock, R. W. Aldridge, Automated and partly automated contact tracing: A systematic review to inform the control of COVID-19, Lancet Digit Health, 2 (2020), e607–e621. https://doi.org/10.1016/S2589-7500(20)30184-9 doi: 10.1016/S2589-7500(20)30184-9
|
| [24] |
J. Abeler, M. Bäcker, U. Buermeyer, H. Zillessen, COVID-19 contact tracing and data protection can go together, JMIR mHealth uHealth, 8 (2020), e19359. https://doi.org/10.2196/19359 doi: 10.2196/19359
|
| [25] |
R. Cappi, L. Casini, D. Tosi, M. Roccetti, Questioning the seasonality of SARS-COV-2: a Fourier spectral analysis, BMJ Open, 12 (2022), e061602. http://dx.doi.org/10.1136/bmjopen-2022-061602 doi: 10.1136/bmjopen-2022-061602
|
| [26] |
M. A. Johansson, T. M. Quandelacy, S. Kada, P. V. Prasad, M. Steele, J. T. Brooks, et al., SARS-CoV-2 transmission from people without COVID-19 symptoms, JAMA Network Open, 4 (2021), e2035057. https://doi.org/10.1001/jamanetworkopen.2020.35057 doi: 10.1001/jamanetworkopen.2020.35057
|
| [27] |
C. J. L. Murray, COVID-19 will continue but the end of the pandemic is near, Lancet, 399 (2022), 417–419. https://doi.org/10.1016/S0140-6736(22)00100-3 doi: 10.1016/S0140-6736(22)00100-3
|
| [28] |
H. Nishiura, T. Kobayashi, T. Miyama, A. Suzuki, S. Jung, K. Hayashi, et al., Estimation of the asymptomatic ratio of novel coronavirus infections (COVID-19), Int. J. Infect. Dis., 94 (2020), 154–155. https://doi.org/10.1016/j.ijid.2020.03.020 doi: 10.1016/j.ijid.2020.03.020
|
| [29] |
M. Arun, E. Baraneetharan, A. Kanchana, Detection and monitoring of the asymptotic COVID-19 patients using IoT devices and sensors, Int. J. Pervas. Comput. Commun., 18 (2020), 407–418. https://doi.org/10.1108/IJPCC-08-2020-0107 doi: 10.1108/IJPCC-08-2020-0107
|
| [30] |
A. Aleta, D. Martín-Corral, A. P. y Piontti, M. Ajelli, M. Litvinova, M. Chinazzi, et al., Modelling the impact of testing, contact tracing and household quarantine on second waves of COVID-19, Nat. Hum. Behav., 4 (2020), 964–971. https://doi.org/10.1038/s41562-020-0931-9 doi: 10.1038/s41562-020-0931-9
|
| [31] |
S. Tian, N. Hu, J. Lou, K. Chen, X. Kang, Z. Xiang, et al., Characteristics of COVID-19 infection in Beijing, J. Infect., 80 (2020), 401–406. https://doi.org/10.1016/j.jinf.2020.02.018 doi: 10.1016/j.jinf.2020.02.018
|
| [32] |
K. Mizumoto, K. Kagaya, G. Chowell, Effect of a wet market on coronavirus disease (COVID-19) transmission dynamics in China, 2019–2020, Int. J. Infect. Dis., 97 (2020), 96–101. https://doi.org/10.1016/j.ijid.2020.05.091 doi: 10.1016/j.ijid.2020.05.091
|
| [33] |
F. Y. Lan, C. F. Wei, Y. T. Hsu, D. C. Christiani, S. N. Kales, Work-related COVID-19 transmission in six Asian countries/areas: A follow-up study, PLoS One, 15 (2020), e0233588. https://doi.org/10.1371/journal.pone.0233588 doi: 10.1371/journal.pone.0233588
|
| [34] |
X. Xiao, X. Zhu, S. Fu, Y. Hu, X. Li, J. Xiao, Psychological impact of healthcare workers in China during COVID-19 pneumonia epidemic: A multi-center cross-sectional survey investigation, J. Affect. Disord., 274 (2020), 405–410. https://doi.org/10.1016/j.jad.2020.05.081 doi: 10.1016/j.jad.2020.05.081
|
| [35] |
C. Wang, C. Tripp, S. F. Sears, L. Xu, Y. Tan, D. Zhou, et al., The impact of the COVID-19 pandemic on physical and mental health in the two largest economies in the world: a comparison between the United States and China, J. Behav. Med., 44 (2021), 741–759. https://doi.org/10.1007/s10865-021-00237-7 doi: 10.1007/s10865-021-00237-7
|
| [36] |
J. Gómez-Salgado, M. Andrés-Villas, S. Domínguez-Salas, D. Díaz-Milanés, C. Ruiz-Frutos, Related health factors of psychological distress during the COVID-19 pandemic in Spain, Int. J. Environ. Res. Public Health, 17 (2020), 3947. https://doi.org/10.3390/ijerph17113947 doi: 10.3390/ijerph17113947
|
| [37] |
L. Sun, Z. Sun, L. Wu, Z. Zhu, F. Zhang, Z. Shang, et al., Prevalence and risk factors for acute posttraumatic stress disorder during the COVID-19 outbreak, J. Affect. Disord., 283 (2021), 123–129. https://doi.org/10.1016/j.jad.2021.01.050 doi: 10.1016/j.jad.2021.01.050
|
| [38] |
M. L. Tee, C. A. Tee, J. P. Anlacan, K. J. G. Aligam, P. W. C. Reyes, V. Kuruchittham, Psychological impact of COVID-19 pandemic in the Philippines, J. Affect. Disord., 277 (2020), 379–391. https://doi.org/10.1016/j.jad.2020.08.043 doi: 10.1016/j.jad.2020.08.043
|
| [39] |
C. Wang, M. I. López-Núñez, R. Pan, X. Wan, Y. Tan, L. Xu, et al., The impact of the COVID-19 pandemic on physical and mental health in China and Spain: Cross-sectional study, JMIR Form Res., 5 (2021), e27818. https://doi.org/10.2196/27818 doi: 10.2196/27818
|
| [40] |
M. Varshney, J. T. Parel, N. Raizada, S. K. Sarin, Initial psychological impact of COVID-19 and its correlates in Indian Community: An online (FEEL-COVID) survey, PLoS One, 15 (2020), e0233874. https://doi.org/10.1371/journal.pone.0233874 doi: 10.1371/journal.pone.0233874
|
| [41] |
H. Oshitani, Cluster-based approach to coronavirus disease 2019 (COVID-19) response in Japan, from February to April 2020, Jpn. J. Infect. Dis., 73 (2020), 491–493. https://doi.org/10.7883/yoken.JJID.2020.363 doi: 10.7883/yoken.JJID.2020.363
|
| [42] | Osaka Prefectural Government, Incidence of new coronavirus infection, 2020. Available from: https://www.pref.osaka.lg.jp/koho/corona_link/index.html. |
| [43] |
S. M. Jung, A. Endo, R. Kinoshita, H. Nishiura, Projecting a second wave of COVID-19 in Japan with variable interventions in high-risk settings, R. Soc. Open Sci., 8 (2021), 202169. https://doi.org/10.1098/rsos.202169 doi: 10.1098/rsos.202169
|
| [44] |
O. Diekmann, J. A. P. Heesterbeek, J. A. J. Metz, On the definition and the computation of the basic reproduction ratio R0 in models for infectious diseases in heterogeneous populations, J. Math. Biol., 28 (1990), 365–382. https://doi.org/10.1007/BF00178324 doi: 10.1007/BF00178324
|
| [45] | National Institute of Infectious Diseases, Outbreak of novel coronavirus infection (COVID-19) in Toky, 2020. Available from: https://www.niid.go.jp/niid/ja/2019-ncov/2502-idsc/iasr-in/9818-486d01.html. |
| [46] |
K. Nakajo, H. Nishiura, Assessing interventions against coronavirus disease 2019 (COVID-19) in Osaka, Japan: A modeling study, J. Clin. Med., 10 (2021), 1256. https://doi.org/10.3390/jcm10061256 doi: 10.3390/jcm10061256
|
| [47] | Osaka Prefectural Government, Requests and measures for the past, 2020. Available from: https://www.pref.osaka.lg.jp/kikaku/kinkyuzitai-yousei/index.html. |
| [48] |
Y. Liu, A. A. Gayle, A. Wilder-Smith, J. Rocklöv, The reproductive number of COVID-19 is higher compared to SARS coronavirus, J. Travel Med., 27 (2020), taaa021. https://doi.org/10.1093/jtm/taaa021 doi: 10.1093/jtm/taaa021
|
| [49] |
H. Nishiura, T. Kobayashi, Y. Yang, K. Hayashi, T. Miyama, R. Kinoshita, et al., The rate of underascertainment of novel coronavirus (2019‐ncov) infection: Estimation using Japanese passengers data on evacuation flights, J. Clin. Med., 9 (2020), 419. https://doi.org/10.3390/jcm9020419 doi: 10.3390/jcm9020419
|
| [50] | M. Coccia, Comparative Critical Decisions in Management, in Global Encyclopedia of Public Administration, Public Policy, and Governance, Springer, Cham, (2020), 1–10. https://doi.org/10.1007/978-3-319-31816-5_3969-1 |
| [51] |
M. Coccia, Pandemic prevention: Lessons from COVID-19, Encyclopedia, 1 (2021), 433–444. https://doi.org/10.3390/encyclopedia1020036 doi: 10.3390/encyclopedia1020036
|
| [52] |
M. J. Plank, A. James, A. Lustig, N. Steyn, R. N. Binny, S. C. Hendy, Potential reduction in transmission of COVID-19 by digital contact tracing systems: a modelling study, Math. Med. Biol., 39 (2022), 156–168. https://doi.org/10.1093/imammb/dqac002 doi: 10.1093/imammb/dqac002
|


Figures(3)

Tong Zhang, Hiroshi Nishiura. COVID-19 cases with a contact history: A modeling study of contact history-stratified data in Japan[J]. Mathematical Biosciences and Engineering, 2023, 20(2): 3661-3676. doi: 10.3934/mbe.2023171


 DownLoad: