Ultrasound Elastography is a late-model Ultrasound imaging technique mainly used to diagnose tumors and diffusion diseases that can't be detected by traditional Ultrasound imaging. However, artifact noise, speckle noise, low contrast and low signal-to-noise ratio in images make disease diagnosing a challenging task. Medical images denoising, as the first step in the follow-up processing of medical images, has been concerned by many people. With the widespread use of deep learning technique in the research field, dictionary learning method are once again receiving attention. Dictionary learning, as a traditional machine learning method, requires less sample size, has high training efficiency, and can describe images well. In this work, we present a novel strategy based on K-clustering with singular value decomposition (K-SVD) and principal component analysis (PCA) to reduce noise in Ultrasound Elastography images. At this stage of dictionary training, we implement a PCA method to transform the way dictionary atoms are updated in K-SVD. Finally, we reconstructed the image based on the dictionary atoms and sparse coefficients to obtain the denoised image. We applied the presented method on datasets of clinical Ultrasound Elastography images of lung cancer from Nanjing First Hospital, and compared the results of the presented method and the original method. The experimental results of subjective and objective evaluation demonstrated that presented approach reached a satisfactory denoising effect and this research provides a new technical reference for computer aided diagnosis.
Citation: Yihua Song, Chen Ge, Ningning Song, Meili Deng. A novel dictionary learning-based approach for Ultrasound Elastography denoising[J]. Mathematical Biosciences and Engineering, 2022, 19(11): 11533-11543. doi: 10.3934/mbe.2022537
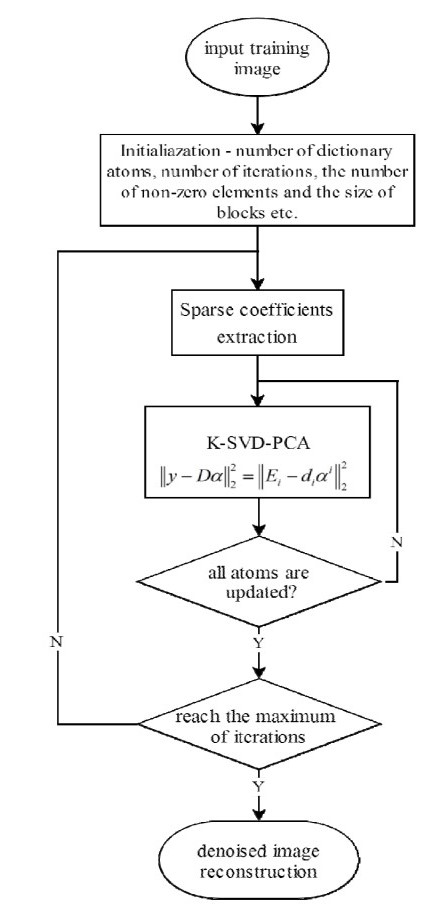
Ultrasound Elastography is a late-model Ultrasound imaging technique mainly used to diagnose tumors and diffusion diseases that can't be detected by traditional Ultrasound imaging. However, artifact noise, speckle noise, low contrast and low signal-to-noise ratio in images make disease diagnosing a challenging task. Medical images denoising, as the first step in the follow-up processing of medical images, has been concerned by many people. With the widespread use of deep learning technique in the research field, dictionary learning method are once again receiving attention. Dictionary learning, as a traditional machine learning method, requires less sample size, has high training efficiency, and can describe images well. In this work, we present a novel strategy based on K-clustering with singular value decomposition (K-SVD) and principal component analysis (PCA) to reduce noise in Ultrasound Elastography images. At this stage of dictionary training, we implement a PCA method to transform the way dictionary atoms are updated in K-SVD. Finally, we reconstructed the image based on the dictionary atoms and sparse coefficients to obtain the denoised image. We applied the presented method on datasets of clinical Ultrasound Elastography images of lung cancer from Nanjing First Hospital, and compared the results of the presented method and the original method. The experimental results of subjective and objective evaluation demonstrated that presented approach reached a satisfactory denoising effect and this research provides a new technical reference for computer aided diagnosis.

| [1] |
C. G. Wang, W. Liu, D. Q. Liu, Noise suppression method for ultrasound strain imaging based on coded excitation, Appl. Res. Comput., 30 (2013), 1596-1600. https://doi.org/10.3969/j.jssn.1001-3695.2013.05.083 doi: 10.3969/j.jssn.1001-3695.2013.05.083

|
| [2] |
Y. He, S. Cao, H. Zhang, H. Sun, L. Lu, Dynamic PET image denoising with deep learning-based joint filtering, IEEE Access, 9 (2021), 41998-42012. https://doi.org/10.1109/ACCESS.2021.3064926 doi: 10.1109/ACCESS.2021.3064926
|
| [3] |
P. Liu, M. D. E. Basha, Y. Li, Y, Xiao, P. C. Sanelli, R. Fang, Deep evolutionary networks with expedited genetic algorithms for medical image denoising, Med. Image Anal., 54 (2019), 306-315. https://doi.org/10.1016/j.media.2019.03.004 doi: 10.1016/j.media.2019.03.004
|
| [4] | C. Broaddus, A. Krull, M. Weigert, U. Schmidt, G. Myers, Removing structured noise with self-supervised blind-spot networks, in IEEE 17th International Symposium on Biomedical Imaging (ISBI), IEEE, (2020), 159-163. https://doi.org/10.1109/ISBI45749.2020.9098336 |
| [5] | M. Green, E. M. Marom, E. Konen, N. Kiryati, A. Mayer, Learning real noise for ultra-low dose lung CT denoising, in Patch-Based Techniques in Medical Imaging Patch-MI 2018 (eds. W. Bai, G. Sanroma, G. Wu, B. Munsell, Y. Zhan, P. Coupé), Springer, Cham, (2018), 3-11. https://doi.org/10.1007/978-3-030-00500-9_1 |
| [6] | L. Tao, C. Zhu, G. Xiang, Y. Li, H. Jia, X. Xie, Llcnn: A convolutional neural network for low-light image enhancement, in 2017 IEEE Visual Communications and Image Processing (VCIP), IEEE, (2018), 1-4. https://doi.org/10.1109/VCIP.2017.8305143 |
| [7] |
D. Wu, H. Ren, Q. Li, Self-supervised dynamic CT perfusion image denoising with deep neural networks, IEEE Trans. Radiat. Plasma Med. Sci., 5 (2021), 350-361. https://doi.org/10.48550/arXiv.2005.09766 doi: 10.48550/arXiv.2005.09766
|
| [8] | A. Ouahabi, Signal and Image Multiresolution Analysis, John Wiley & Sons, 2012. https://doi.org/10.1002/9781118568767 |
| [9] | A. Ouahabi, A review of wavelet denoising in medical imaging, in 2013 8th International Workshop on Systems, Signal Processing and their Applications (WoSSPA), IEEE, (2013), 19-26. https://doi.org/10.1109/WoSSPA.2013.6602330 |
| [10] |
H. Jomaa, R. Mabrouk, N. Khlifa, F. Morain-Nicolier, Denoising of dynamic pet images using a multi-scale transform and non-local means filter, Biomed. Signal Process. Control, 41 (2017), 69-80. https://doi.org/10.1016/j.bspc.2017.11.002 doi: 10.1016/j.bspc.2017.11.002
|
| [11] | A. Gupta, V. Bhateja, A. Srivastava, A. Gupta, S. C. Satapathy, Speckle noise suppression in Ultrasound images by using an improved non-local mean filter, in Soft Computing and Signal Processing, Springer, Singapore, (2019), 13-19. https://doi.org/10.1007/978-981-13-3393-4_2 |
| [12] |
F. Baselice, G. Ferraioli, V. Pascazio, A. Sorriso, Denoising of MR images using Kolmogorov-Smirnov distance in a non local framework, Magn. Reson. Imaging, 57 (2019), 176-193. https://doi.org/10.1016/j.mri.2018.11.022 doi: 10.1016/j.mri.2018.11.022
|
| [13] | M. Xu, X. Xie, An efficient feature-preserving PDE algorithm for image denoising based on a spatial-fractional anisotropic diffusion equation, preprint, arXiv: 2101.01496. |
| [14] |
H. Wang, S. Cao, K. Jiang, H. Wang, Q. Zhang, Seismic data denoising for complex structure using BM3D and local similarity, J. Appl. Geophys., 170 (2019), 103759. https://doi.org/10.1016/j.jappgeo.2019.04.018 doi: 10.1016/j.jappgeo.2019.04.018
|
| [15] |
C. Feng, D. Zhao, M. Huang, Image segmentation using CUDA accelerated non-local means denoising and bias correction embedded fuzzy c-means (BCEFCM), Signal Process., 122 (2016), 164-189. https://doi.org/10.1016/j.sigpro.2015.12.007 doi: 10.1016/j.sigpro.2015.12.007
|
| [16] |
C. Feng, M. Huang, D. Zhao, Segmentation of longitudinal brain MR images using bias correction embedded fuzzy c-means with non-locally spatio-temporal regularization, J. Visual Commun. Image Represent., 38 (2016), 517-529. https://doi.org/10.1016/j.jvcir.2016.03.027 doi: 10.1016/j.jvcir.2016.03.027
|
| [17] |
C. Feng, W. Li, J. Hu, K. Yu, D. Zhao, BCEFCM_S: Bias correction embedded fuzzy c-means with spatial constraint to segment multiple spectral images with intensity inhomogeneities and noises, Signal Process., 168 (2020), 107347. https://doi.org/10.1016/j.sigpro.2019.107347 doi: 10.1016/j.sigpro.2019.107347
|
| [18] | S. Valiollahzadeh, H. Firouzi, M. Babaie-Zadeh, C. Jutten, Image denoising using sparse representations, in International Conference on Independent Component Analysis and Signal Separation, (2009), 557-564. https://doi.org/10.1007/978-3-642-00599-2_70 |
| [19] |
H. R. Shahdoosti, S. M. Hazavei, A new compressive sensing based image denoising method using block-matching and sparse representations over learned dictionaries, Multimedia Tools Appl., 78 (2018), 12561-12582. https://doi.org/10.1007/s11042-018-6818-3 doi: 10.1007/s11042-018-6818-3
|
| [20] | F. I. Miertoiu, B. Dumitrescu, Sparse representation and denoising for images affected by generalized Gaussian noise, U.P.B. Sci. Bull., Ser. C, 84 (2022), 75-86. |
| [21] |
L. Nasser, T. Boudier, A novel generic dictionary-based denoising method for improving noisy and densely packed nuclei segmentation in 3D time-lapse fluorescence microscopy images, Sci. Rep., 9 (2019), 1-13. https://doi.org/10.1038/s41598-019-41683-3 doi: 10.1038/s41598-019-41683-3
|
| [22] |
H. Haneche, A. Ouahabi, B. Boudraa, New mobile communication system design for Rayleigh environments based on compressed sensing-source coding, IET Commun., 13 (2019), 2375-2385. https://doi.org/10.1049/iet-com.2018.5348 doi: 10.1049/iet-com.2018.5348
|
| [23] |
A. E. Mahdaoui, A. Ouahabi, M. S. Moulay, Image denoising using a compressive sensing approach based on regularization constraints, Sensors, 22 (2022), 2199. https://doi.org/10.3390/s22062199 doi: 10.3390/s22062199
|
| [24] |
H. Zhu, L. Han, R. Chen, Seismic data denoising method combining principal component analysis and dictionary learning, Global Geol., 39 (2020), 656-662. https://doi.org/10.3969/j.issn.1004-5589.2020.03.015 doi: 10.3969/j.issn.1004-5589.2020.03.015
|


Figures(4)

Yihua Song, Chen Ge, Ningning Song, Meili Deng. A novel dictionary learning-based approach for Ultrasound Elastography denoising[J]. Mathematical Biosciences and Engineering, 2022, 19(11): 11533-11543. doi: 10.3934/mbe.2022537


 DownLoad: