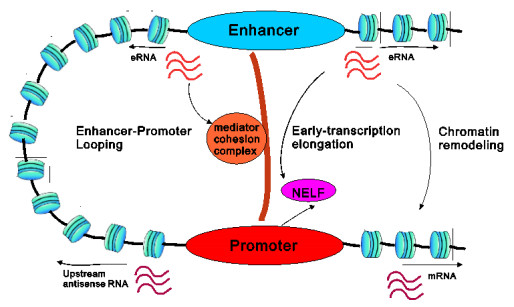
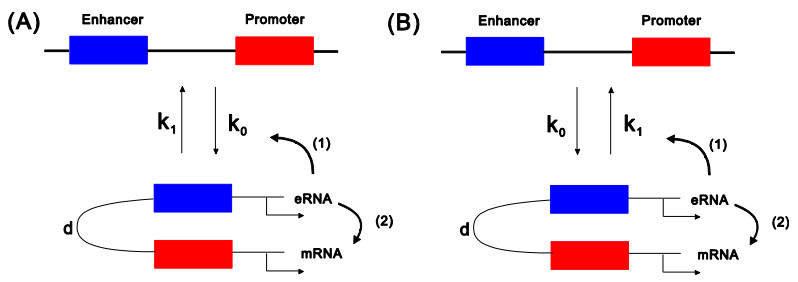
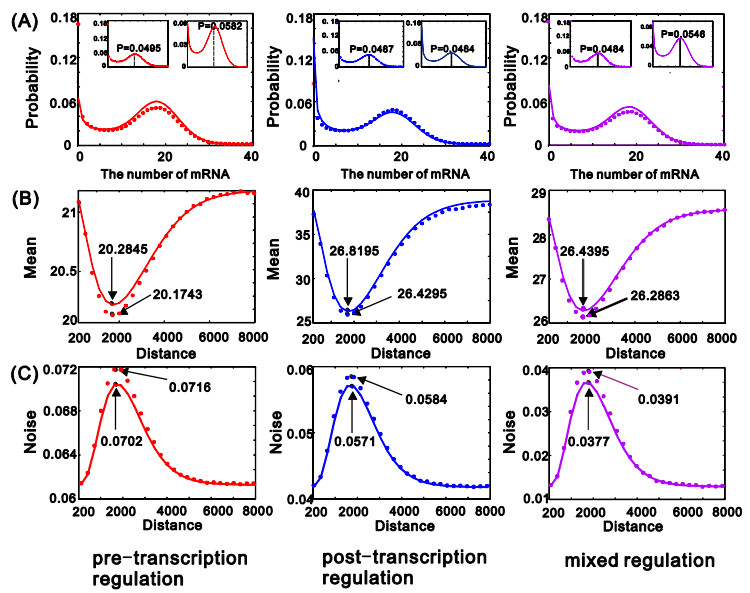
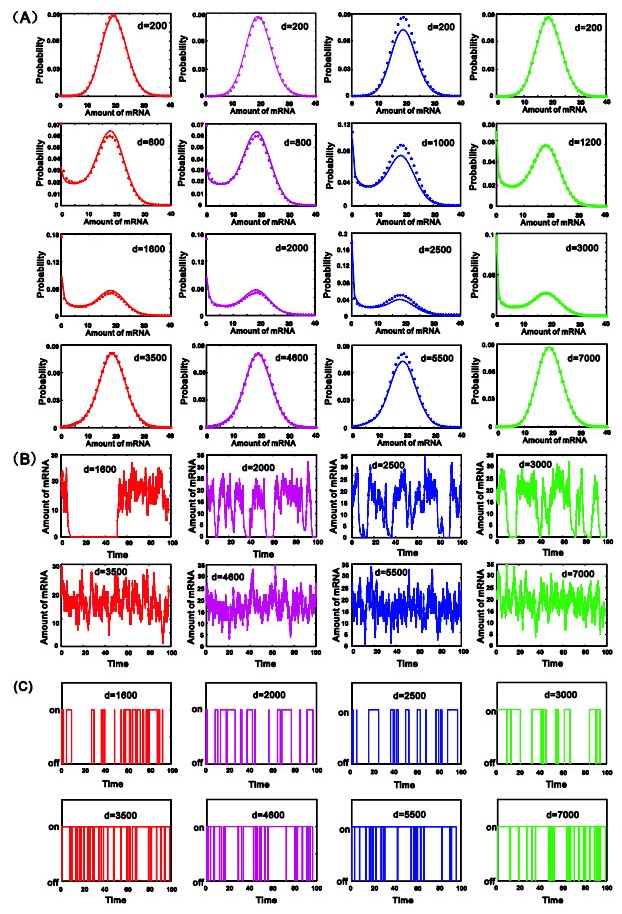
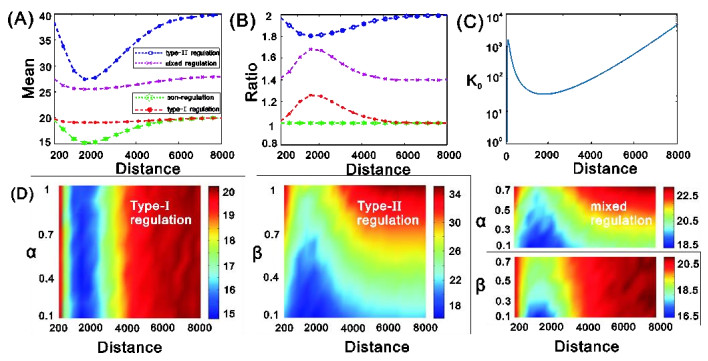
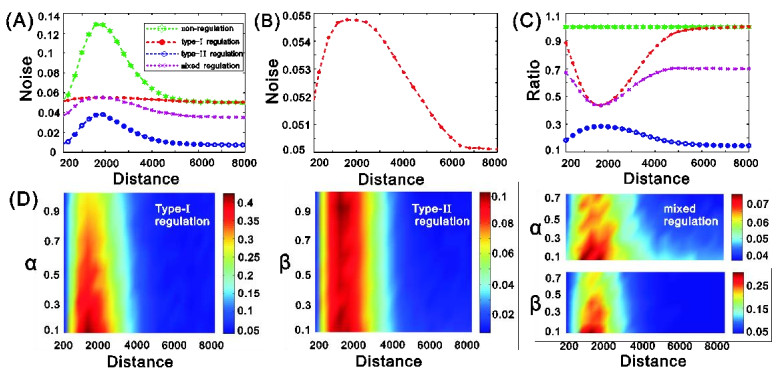
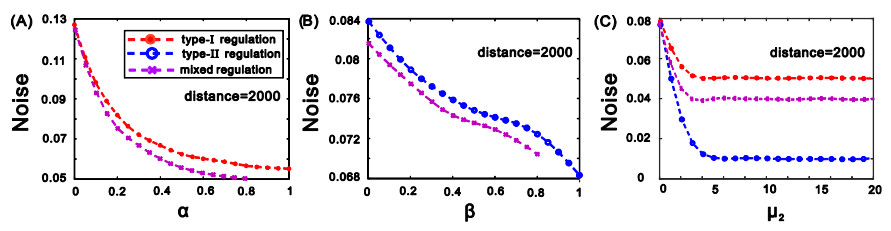
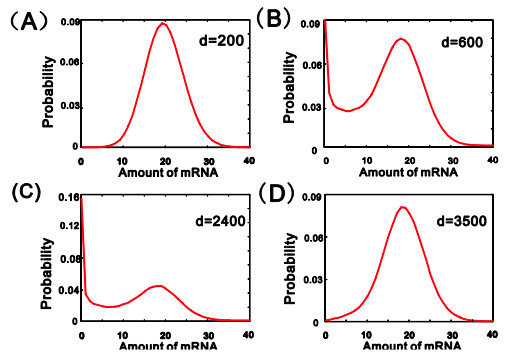
eRNAs as the products of enhancers can regulate gene expression via various possible ways, but which regulation way is more reasonable is debatable in biology, and in particular, how eRNAs impact gene expression remains unclear. Here we introduce a mechanistic model of gene expression to address these issues. This model considers three possible regulation ways of eRNA: Type-I by which eRNA regulates transcriptional activity by facilitating the formation of enhancer-promoter (E-P) loop, Type-II by which eRNA directly promotes the mRNA production rate, and mixed regulation (i.e., the combination of Type-I and Type-II). We show that with the increase of the E-P loop length, mRNA distribution can transition from unimodality to bimodality or vice versa in all the three regulation cases. However, in contrast to the other two regulations, Type-II regulation can lead to the highest mean mRNA level and the lowest mRNA noise, independent of the E-P loop length. These results would not only reveal the essential mechanism of how eRNA regulates gene expression, but also imply a new mechanism for phenotypic switching, namely the E-P loop can induce phenotypic switching.
Citation: Heli Tan, Tuoqi Liu, Tianshou Zhou. Exploring the role of eRNA in regulating gene expression[J]. Mathematical Biosciences and Engineering, 2022, 19(2): 2095-2119. doi: 10.3934/mbe.2022098
eRNAs as the products of enhancers can regulate gene expression via various possible ways, but which regulation way is more reasonable is debatable in biology, and in particular, how eRNAs impact gene expression remains unclear. Here we introduce a mechanistic model of gene expression to address these issues. This model considers three possible regulation ways of eRNA: Type-I by which eRNA regulates transcriptional activity by facilitating the formation of enhancer-promoter (E-P) loop, Type-II by which eRNA directly promotes the mRNA production rate, and mixed regulation (i.e., the combination of Type-I and Type-II). We show that with the increase of the E-P loop length, mRNA distribution can transition from unimodality to bimodality or vice versa in all the three regulation cases. However, in contrast to the other two regulations, Type-II regulation can lead to the highest mean mRNA level and the lowest mRNA noise, independent of the E-P loop length. These results would not only reveal the essential mechanism of how eRNA regulates gene expression, but also imply a new mechanism for phenotypic switching, namely the E-P loop can induce phenotypic switching.

| [1] |
T. Maniatis, S. Goodbourn, J. A. Fischer, Regulation of inducible and tissue -specific gene expression, Science, 236 (1987), 1237–1245. doi: 10.1126/science.3296191. doi: 10.1126/science.3296191

|
| [2] |
E. M. Blackwood, J. T. Kadonaga, Going the Distance: A Current View of Enhancer Action, Science, 281 (1998), 60–63. doi: 10.1126/science.281.5373.60. doi: 10.1126/science.281.5373.60
|
| [3] |
L. A. Pennacchio, W. Bickmore, A. Dean, M. A. Nobrega, G. Bejerano, Enhancers: five essential questions, Nat. Rev. Genet., 14 (2013), 288–295. doi: 10.1126/science.281.5373.60 doi: 10.1126/science.281.5373.60
|
| [4] |
G. A. Maston, S. K. Evans, M. R. Green, Transcriptional Regulatory Elements in the Human Genome, Annu. Rev. Genom. Hum. G., 7 (2006), 29–59. doi: 10.1146/annurev.genom.7.080505.115623. doi: 10.1146/annurev.genom.7.080505.115623
|
| [5] |
O. I. Kulaeva, E. V. Nizovtseva, Y. S. Polikanov, S. V. Ulianov, V. M. Studitsky, Distant activation of transcription: mechanisms of enhancer action, Mol. Cell Biol., 32 (2012), 4892–4897. doi: 10.1128/MCB.01127-12. doi: 10.1128/MCB.01127-12
|
| [6] |
C. Buecker, J. Wysocka, Enhancers as information integration hubs in development: lessons from genomics, Trends Genet., 28 (2012), 276–284. doi: 10.1016/j.tig.2012.02.008. doi: 10.1016/j.tig.2012.02.008
|
| [7] |
W. Xie, B. Ren, Enhancing Pluripotency and Lineage Specification, Science, 341 (2013), 245-247. doi: 10.1126/science.1236254. doi: 10.1126/science.1236254
|
| [8] |
K. Lee, C. C. Hsiung, P. Huang, A. Raj, G. A. Blobel, Dynamic enhancer–gene body contacts during transcription elongation, Genes. Dev., 29 (2015), 1992–1997. doi: 10.1101/gad.255265.114. doi: 10.1101/gad.255265.114
|
| [9] |
J. G. Azofeifa, M. A. Allen, J. R. Hendrix, T. Read, J. D. Rubin, R. D. Dowell, Enhancer RNA profiling predicts transcription factor activity, Genome Res., 28 (2018), 334–344. doi: 10.1101/gr.225755.117. doi: 10.1101/gr.225755.117
|
| [10] |
E. Zlotorynski, Gene expression: Developmental enhancers in action, Nat. Rev. Genet., 19 (2018), 187–187. doi: 10.1038/nrg.2018.13. doi: 10.1038/nrg.2018.13
|
| [11] |
A. Smallwood, B. Ren, Genome organization and long-range regulation of gene expression by enhancers, Curr. Opin. Cell Biol., 25 (2013), 387–394. doi: 10.1016/j.ceb.2013.02.005. doi: 10.1016/j.ceb.2013.02.005
|
| [12] |
A. Maruyama, J. Mimura, K. Itoh, Non-coding RNA derived from the region adjacent to the human HO-1 E2 enhancer selectively regulates HO-1 gene induction by modulating Pol II binding, Nucleic Acids Res., 42 (2014), 13599–13614. doi: 10.1093/nar/gku1169. doi: 10.1093/nar/gku1169
|
| [13] |
C. L. Yin, C. Benner, R. Mansson, S. Heinz, K. Miyazaki, M. Miyazaki, et al., Global changes in nuclear positioning of genes and intra- and inter-domain genomic interactions that orchestrate B cell fate, Nat. Immunol., 13 (2012), 1196–1204. doi: 10.1038/ni.2432. doi: 10.1038/ni.2432
|
| [14] |
A. Sanyal, B. R. Lajoie, G. Jain, J. Dekker, The long-range interaction landscape of gene promoters, Nature 489 (2012), 109–113. doi: 10.1038/nature11279. doi: 10.1038/nature11279
|
| [15] |
G. Natoli, J. Andrau, Noncoding transcription at enhancers: general principles and functional models, Annu. Rev. Genet., 46 (2012), 1–19. doi: 10.1146/annurev-genet-110711-155459. doi: 10.1146/annurev-genet-110711-155459
|
| [16] |
M. D. Young, T. A. Willson, M. J. Wakefield, T. Evelyn, D. J. Hilton, M. E. Blewitt, et al., Chip-seq analysis reveals distinct h3k27me3 profiles that correlate with transcriptional activity, Nucleic Acids Res., 39 (2011), 7415–7427. doi: 10.1093/nar/gkr416. doi: 10.1093/nar/gkr416
|
| [17] |
F. Koch, R. Fenouil, M. Gut, P. Cauchy, T. K. Albert, J. Za Ca Rias-Cabeza, et al., Transcription initiation platforms and GTF recruitment at tissue-specific enhancers and promoters, Nat. Struct. Mol. Bio., 18 (2011), 956–963. doi: 10.1038/nsmb.2085. doi: 10.1038/nsmb.2085
|
| [18] |
M. S. Kowalczyk, J. R. Hughes, D. Lynch, M. D. Garrick, D. R. Higgs, Intragenic enhancers act as alternative promoters, Mol. Cell, 45 (2012), 447–458. doi: 10.1016/j.molcel.2011.12.021. doi: 10.1016/j.molcel.2011.12.021
|
| [19] |
D. Wang, I. Garcia-Bassets, C. Benner, W. Li, S. Xue, Y. Zhou, et al., Reprogramming transcription by distinct classes of enhancers functionally defined by eRNA, Nature, 474 (2011), 390–394. doi: 10.1038/nature10006. doi: 10.1038/nature10006
|
| [20] |
J. Lacava, J. Houseley, C. Saveanu, E. Petfalski, E. Thompson, A. Jacquier, et al., RNA degradation by the exosome is promoted by a nuclear polyadenylation complex, Cell, 121 (2005), 713–724. doi: 10.1016/j.cell.2005.04.029. doi: 10.1016/j.cell.2005.04.029
|
| [21] |
F. Wyers, M. Rougemaille, G. Badis, J. C. Rousselle, A. Jacquier, Cryptic pol II transcripts are degraded by a nuclear quality control pathway involving a new poly(A) polymerase, Cell, 121 (2005), 725–737. doi: 10.1016/j.cell.2005.04.030. doi: 10.1016/j.cell.2005.04.030
|
| [22] |
I. Miguel-Escalada, R. Andersson, E. Al, C. Gebhard, I. Hoof, J. Bornholdt, An atlas of active enhancers across human cell types and tissues, Nature, 507 (2014), 455–461. doi: 10.1038/nature12787. doi: 10.1038/nature12787
|
| [23] |
R. A. Flynn, A. E. Almada, J. R. Zamudio, P. A. Sharp, Antisense RNA polymerase II divergent transcripts are P-TEFb dependent and substrates for the RNA exosome, Proc. Natl. Acad. Sci. USA., 108 (2011), 10460–10465. doi: 10.1073/pnas.1106630108. doi: 10.1073/pnas.1106630108
|
| [24] |
N. Hah, S. Murakami, A. Nagari, C. G.Danko, W. L. Kraus, Enhancer transcripts mark active estrogen receptor binding sites, Genome Res., 23 (2013), 1210–1223. doi: 10.1101/gr.152306.112. doi: 10.1101/gr.152306.112
|
| [25] |
A. Sandelin, P. Carninci, B. Lenhard, J. Ponjavic, Y. Hayashizaki, D. A. Hume, Mammalian RNA polymerase II core promoters: insights from genome-wide studies, Nat. Rev. Genet., 8 (2007), 424–436. doi: 10.1038/nrg2026. doi: 10.1038/nrg2026
|
| [26] |
Struhl, Kevin, Transcriptional noise and the fidelity of initiation by RNA polymerase II, Nat. Struct. Mol. Bio., 14 (2007), 103–105. doi: 10.1038/nsmb0207-103. doi: 10.1038/nsmb0207-103
|
| [27] |
W. Li, D. Notani, Q. Ma, B. Tanasa, E. Nunez, A. Y. Chen, et al., Functional roles of enhancer RNAs for oestrogen-dependent transcriptional activation, Nature, 498 (2013), 516–520. doi: 10.1038/nature12210. doi: 10.1038/nature12210
|
| [28] |
M. T. Y. Lam, C. Han, H. P. Lesch, D. Gosselin, S. Heinz, Y. Tanaka-Oishi, et al., Rev-Erbs repress macrophage gene expression by inhibiting enhancer-directed transcription, Nature, 498 (2013), 511–515. doi: 10.1038/nature12209. doi: 10.1038/nature12209
|
| [29] |
C. L. Hsieh, T. Fei, Y. Chen, T. Li, Y. Gao, X. Wang, et al., Enhancer RNAs participate in androgen receptor-driven looping that selectively enhances gene activation, Proc. Natl. Acad. Sci. USA., 111 (2014), 7319–7324. doi: 10.1073/pnas.1324151111. doi: 10.1073/pnas.1324151111
|
| [30] |
C. Melo, J. Drost, P. Wijchers, H. Van De Werken, E. De Wit, J. F. Vrielink, et al., eRNAs are required for p53-dependent enhancer activity and gene transcription, Mol. Cell, 49 (2013), 524–535. doi: 10.1016/j.molcel.2012.11.021. doi: 10.1016/j.molcel.2012.11.021
|
| [31] |
K. Mousavi, H. Zare, S. Dell'orso, L. Grøntved, G. Gutierrez-Cruz, A. Derfoul, et al., eRNAs promote transcription by establishing chromatin accessibility at defined genomic loci, Mol. Cell, 51 (2013), 606–617. doi: 10.1016/j.molcel.2013.07.022. doi: 10.1016/j.molcel.2013.07.022
|
| [32] |
N. E. Ilott, J. A. Heward, B. Roux, E. Tsitsiou, P. S. Fenwick, L. Lenzi, et al., Long non-coding RNAs and enhancer RNAs regulate the lipopolysaccharide-induced inflammatory response in human monocytes, Nat. Commun., 5 (2014), 3979–3979. doi: 10.1038/ncomms4979. doi: 10.1038/ncomms4979
|
| [33] |
K. Schaukowitch, J. Y. Joo, X. Liu, J. K. Watts, C. Martinez, T. K. Kim, Enhancer RNA facilitates NELF release from immediate early genes, Mol. Cell, 56 (2014), 29–42. doi: 10.1016/j.molcel.2014.08.023. doi: 10.1016/j.molcel.2014.08.023
|
| [34] |
T. K. Kim, R. Shiekhattar, Architectural and functional commonalities between enhancers and promoters, Cell, 162 (2015), 948–959. doi: 10.1016/j.cell.2015.08.008. doi: 10.1016/j.cell.2015.08.008
|
| [35] |
E. Savitskaya, L. Melnikova, M. Kostuchenko, E. Kravchenko, E. Pomerantseva, T. Boikova, et al., Study of long-distance functional interactions between Su(Hw) insulators that can regulate enhancer-promoter communication in Drosophila melanogaster, Mol. Cell Biol., 26 (2006), 754–761. doi: 10.1128/MCB.26.3.754-761.2006. doi: 10.1128/MCB.26.3.754-761.2006
|
| [36] |
D. Chetverina, M. Fujioka, M. Erokhin, P. Georgiev, J. B. Jaynes, P. Schedl, Boundaries of loop domains (insulators): Determinants of chromosome form and function in multicellular eukaryotes, Bioessays., 39 (2017), 10.1002. doi: 10.1002/bies.201600233. doi: 10.1002/bies.201600233
|
| [37] |
J. Mozziconacci, M. Merle, A. Lesne, The 3D Genome Shapes the Regulatory Code of Developmental Genes, J. Mol. Biol., 432 (2020), 712–723. doi: 10.1016/j.jmb.2019.10.017. doi: 10.1016/j.jmb.2019.10.017
|
| [38] |
C.P. Fulco, J. Nasser, T. R. Jones, G. Munson, D.T. Bergman, V. Subramanian, et al., Activity-by-contact model of enhancer-promoter regulation from thousands of CRISPR perturbations, Nat Genet., 51 (2019):1664–1669. doi: 10.1038/s41588-019-0538-0. doi: 10.1038/s41588-019-0538-0
|
| [39] |
T. Q. Liu, J. J. Zhang, T. S. Zhou, Effect of Interaction between Chromatin Loops on Cell-to-Cell Variability in Gene Expression, PLoS Comput. Biol., 12 (2016), e1004917. doi: 10.1371/journal.pcbi.1004917. doi: 10.1371/journal.pcbi.1004917
|
| [40] |
J. J. Zhang, T. S. Zhou, Promoter architecture-mediated transcriptional dynamics, Biophys. J., 106 (2014), 479–488. doi: 10.1016/j.bpj.2013.12.011. doi: 10.1016/j.bpj.2013.12.011
|
| [41] |
J. Peccoud, B. Ycart, Markovian Modeling of Gene-Product Synthesis, Theor. Popul. Biol., 48 (1995), 222–234. doi: 10.1006/tpbi.1995.1027. doi: 10.1006/tpbi.1995.1027
|
| [42] |
A. F. Ramos, G. Innocentini, F. M. Forger, J. Hornos, Symmetry in biology: from genetic code to stochastic gene regulation, Iet Syst. Biol., 4 (2010), 311–329. doi: 10.1049/iet-syb.2010.0058. doi: 10.1049/iet-syb.2010.0058
|
| [43] |
G. Giovanini, A. U. Sabino, L. R. C. Barros, A. F. Ramos, A comparative analysis of noise properties of stochastic binary models for a self-repressing and for an externally regulating gene, Math. Biosci. Eng., 17 (2020), 5477–5503. doi: 10.3934/mbe.2020295. doi: 10.3934/mbe.2020295
|
| [44] |
N. Kumar, T. Platini, R. V. Kulkarni, Exact distributions for stochastic gene expression models with bursting and feedback, Phys. Rev. Lett., 113 (2014), 268105–268105. doi: 10.1103/PhysRevLett.113.268105. doi: 10.1103/PhysRevLett.113.268105
|
| [45] |
R. Grima, D. R. Schmidt, T. J. Newman, Steady-state fluctuations of a genetic feedback loop: An exact solution. J. Chem. Phys., 137 (2012), 051907. doi: 10.1063/1.4736721. doi: 10.1063/1.4736721
|
| [46] | G. Innocentini, A. F. Ramos, J. Hornos, Comment on "Steady-state fluctuations of a genetic feedback loop: an exact solution" [J. Chem. Phys. {\bf 137, 035104 (2012).], J. Chem. Phys., 142 (2015), 027101. doi: 10.1063/1.4905217. |
| [47] |
A. Sanchez, H. G. Garcia, D.Jones, R. Phillips, J. Kondev, Effect of promoter architecture on the cell-to-cell variability in gene expression, Plos Comput. Biol., 7(2011), e1001100. doi: 10.1371/journal.pcbi.1001100. doi: 10.1371/journal.pcbi.1001100
|
| [48] |
L. Bintu, N. E. Buchler, H. G. Garcia, U. Gerland, T. Hwa, J. Kondev, et al., Transcriptional regulation by the numbers: applications, Curr. Opin. Genet. De., 15 (2005), 125–135. doi: 10.1016/j.gde.2005.02.006. doi: 10.1016/j.gde.2005.02.006
|
| [49] | H. Yamakawa, In Helical Wormlike Chains in Polymer Solutions, Springer Press, New York, 1997. doi: 10.1007/978-3-642-60817-9. |
| [50] |
F. De Santa, I. Barozzi, F. Mietton, S. Ghisletti, S. Polletti, B. K. Tusi, et al., A large fraction of extragenic RNA pol II transcription sites overlap enhancers, PLoS Biol., 8 (2010), e1000384. doi: 10.1371/journal.pbio.1000384. doi: 10.1371/journal.pbio.1000384
|
| [51] |
T. K. Kim, M. Hemberg, J. M. Gray, A. M. D. M. Costa, J. Bear, D. Wu, et al., Widespread transcription at neuronal activity-regulated enhancers, Nature, 465 (2010), 182–187. doi: 10.1038/nature09033. doi: 10.1038/nature09033
|
| [52] | L. J. Slater, Confluent Hypergeometric Functions, Cambridge University Press, Cambridge, 1960. |
| [53] |
D.T. Gillespie, Exact stochastic simulation of coupled chemical reactions, J. Phys. Chem., 81 (1977), 2340–2361. doi: 10.1021/j100540a008. doi: 10.1021/j100540a008
|
| [54] |
D. Fraser, M. Kaern, A chance at survival: gene expression noise and phenotypic diversification strategies, Mol. Microbiol., 71 (2009), 1333–1340. doi: 10.1111/j.1365-2958.2009.06605.x. doi: 10.1111/j.1365-2958.2009.06605.x
|
| [55] |
M. Acar, J. T. Mettetal, A. Van Oudenaarden, Stochastic switching as a survival strategy in fluctuating environments, Nat. Genet., 40 (2008), 471–475. doi: 10.1038/ng.110. doi: 10.1038/ng.110
|
| [56] |
S. Iyer-Biswas, F. Hayot, C. Jayaprakash, Stochasticity of gene products from transcriptional pulsing, Phys. Rev. E. Stat. Nonlin. Soft Matter Phys., 79 (2009), 031911. doi: 10.1103/PhysRevE.79.031911. doi: 10.1103/PhysRevE.79.031911
|
| [57] |
R. Hermsen, D. W. Erickson, T. Hwa, Speed, sensitivity, and bistability in auto-activating signaling circuits, Plos Comput. Biol., 7 (2011), e1002265. doi: 10.1371/journal.pcbi.1002265. doi: 10.1371/journal.pcbi.1002265
|
| [58] |
E. Lenters-Westra, T. Røraas, R. K. Schindhelm, R. J. Slingerland, S. Sandberg, Biological variation of hemoglobin A1c: consequences for diagnosing diabetes mellitus, Clin. Chem., 60 (2014), 1570–1572. doi: 10.1373/clinchem.2014.227983. doi: 10.1373/clinchem.2014.227983
|
| [59] |
L. Pnueli, S. Rudnizky, Y. Yosefzon, P. Melamed, RNA transcribed from a distal enhancer is required for activating the chromatin at the promoter of the gonadotropin α-subunit gene, Proc. Natl. Acad. Sci. USA., 112 (2015), 4369–4374. doi: 10.1073/pnas.1414841112. doi: 10.1073/pnas.1414841112
|
| [60] |
C. Benner, T. Isoda, C. Murre, New roles for DNA cytosine modification, eRNA, anchors, and superanchors in developing B cell progenitors, Proc. Natl. Acad. Sci. USA., 112 (2015), 12776–12781. doi: 10.1073/pnas.1512995112. doi: 10.1073/pnas.1512995112
|
| [61] |
D. Holoch, D. Moazed, RNA-mediated epigenetic regulation of gene expression, Nat. Rev. Genet., 16 (2015), 71–84. doi: 10.1038/nrg3863. doi: 10.1038/nrg3863
|
| [62] |
J. M. Engreitz, K. Sirokman, P. McDonel, A. A., Shishkin, C. Surka, P. Russell, et al., RNA-RNA interactions enable specific targeting of noncoding RNAs to nascent pre-mRNAs and chromatin sites, Cell, 159 (2014), 188–199. doi: 10.1016/j.cell.2014.08.018. doi: 10.1016/j.cell.2014.08.018
|
| [63] |
J. Quinn, H. Chang, Unique features of long non-coding RNA biogenesis and function, Nat. Rev. Genet., 17 (2016), 47–62. doi: 10.1038/nrg.2015.10. doi: 10.1038/nrg.2015.10
|
| [64] |
F. Aguilo, S. Li, N. Balasubramaniyan, A. Sancho, S. Benko, F. Zhang, et al., Deposition of 5- methylcytosine on enhancer RNAs enables the coactivator function of PGC-1α, Cell Rep., 14 (2016), 479–492. doi: 10.1016/j.celrep.2015.12.043. doi: 10.1016/j.celrep.2015.12.043
|
| [65] |
W. Li, D. Notani, M. G. Rosenfeld, Enhancers as non-coding RNA transcription units: recent insights and future perspectives, Nat. Rev. Genet., 17 (2016), 207–223. doi: 10.1038/nrg.2016.4. doi: 10.1038/nrg.2016.4
|
Figures(8)

Heli Tan, Tuoqi Liu, Tianshou Zhou. Exploring the role of eRNA in regulating gene expression[J]. Mathematical Biosciences and Engineering, 2022, 19(2): 2095-2119. doi: 10.3934/mbe.2022098


 DownLoad: