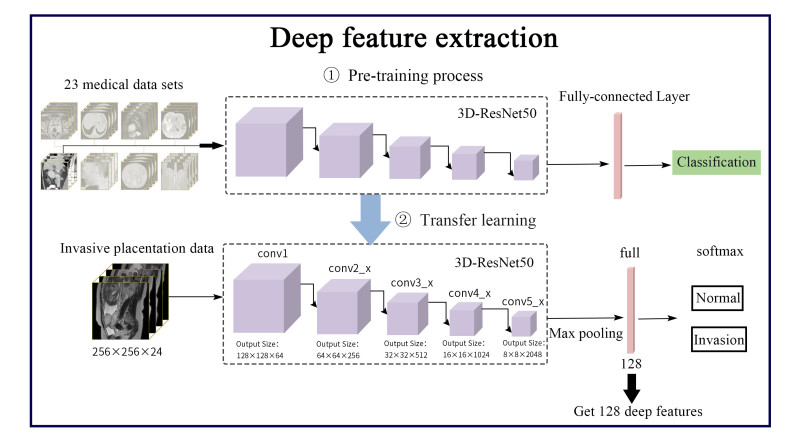
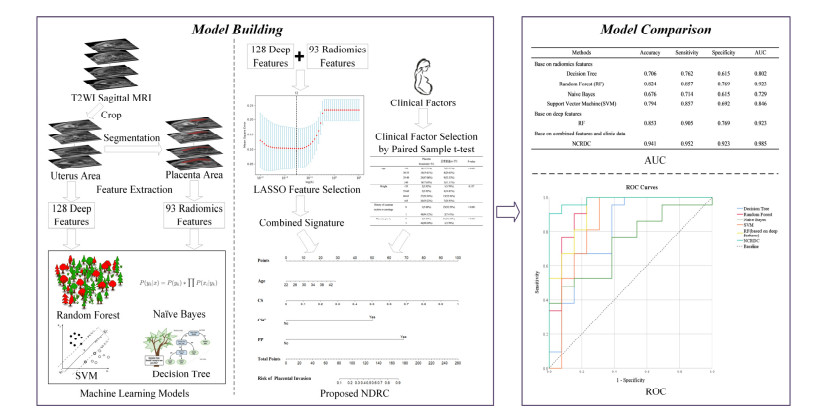
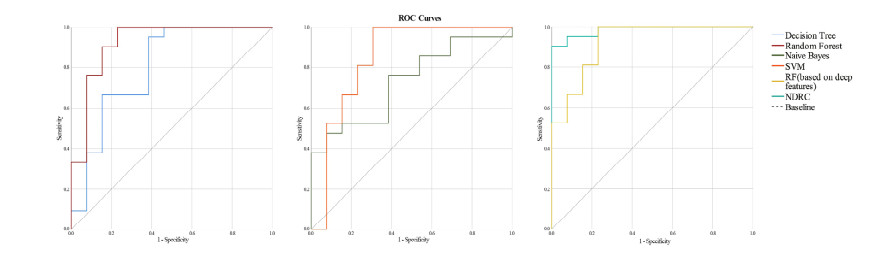
The purpose of this study was to explore whether the Nomogram, which was constructed by combining the Deep learning and Radiomic features of T2-weighted MR images with Clinical factors (NDRC), could accurately predict placenta invasion. This retrospective study included 72 pregnant women with pathologically confirmed placenta invasion and 40 pregnant women with normal placenta. After 24 gestational weeks, all participants underwent magnetic resonance imaging. The uterus and placenta regions were segmented in magnetic resonance images on sagittal T2WI. Ninety-three radiomics features were extracted from the placenta region, and 128 deep features were extracted from the uterus region using a deep neural network. The least absolute shrinkage and selection operator (LASSO) algorithm was used to filter these 221 features and to form the combined signature. Then the combined signature (CS) and clinical factors were combined to construct a nomogram. The accuracy, sensitivity, specificity and AUC of the nomogram were compared with four machine learning methods. The model NDRC was trained on the dataset of 78 pregnant women in the training cohort. Finally, the model NDRC was compared with four machine learning methods on the independent validation cohort of 34 pregnant women. The results showed that the prediction accuracy, sensitivity, specificity and AUC of the NDRC model were 0.941, 0.952, 0.923 and 0.985 respectively, which outperforms the traditional machine learning methods which rely on radiomics features and deep learning features alone.
Citation: Qian Shao, Rongrong Xuan, Yutao Wang, Jian Xu, Menglin Ouyang, Caoqian Yin, Wei Jin. Deep learning and radiomics analysis for prediction of placenta invasion based on T2WI[J]. Mathematical Biosciences and Engineering, 2021, 18(5): 6198-6215. doi: 10.3934/mbe.2021310
The purpose of this study was to explore whether the Nomogram, which was constructed by combining the Deep learning and Radiomic features of T2-weighted MR images with Clinical factors (NDRC), could accurately predict placenta invasion. This retrospective study included 72 pregnant women with pathologically confirmed placenta invasion and 40 pregnant women with normal placenta. After 24 gestational weeks, all participants underwent magnetic resonance imaging. The uterus and placenta regions were segmented in magnetic resonance images on sagittal T2WI. Ninety-three radiomics features were extracted from the placenta region, and 128 deep features were extracted from the uterus region using a deep neural network. The least absolute shrinkage and selection operator (LASSO) algorithm was used to filter these 221 features and to form the combined signature. Then the combined signature (CS) and clinical factors were combined to construct a nomogram. The accuracy, sensitivity, specificity and AUC of the nomogram were compared with four machine learning methods. The model NDRC was trained on the dataset of 78 pregnant women in the training cohort. Finally, the model NDRC was compared with four machine learning methods on the independent validation cohort of 34 pregnant women. The results showed that the prediction accuracy, sensitivity, specificity and AUC of the NDRC model were 0.941, 0.952, 0.923 and 0.985 respectively, which outperforms the traditional machine learning methods which rely on radiomics features and deep learning features alone.

| [1] | K. E. Fitzpatrick, S. Sellers, P. Spark, J. J. Kurinczuk, P. Brocklehurst, M. Knight, Incidence and risk factors for placenta accreta/increta/percreta in the UK: a national casecontrol study, PLoS One, 7 (2012), 1-6. |
| [2] |
Y. Oyelese, J. C. Smulian, Placenta previa, placenta accreta, and vasa previa, Obstet. Gynecol., 107 (2006), 927-941. doi: 10.1097/01.AOG.0000207559.15715.98

|
| [3] | G. Garmi, R. Salim, Epidemiology, etiology, diagnosis, and management of placenta accrete, Obstet. Gynecol. Int., 2012 (2012), 1-7. |
| [4] |
W. C. Baughman, J. E. Corteville, R. R. Shah, Placenta accreta: spectrum of US and MR imaging findings, Radiographics, 28 (2008), 1905-1916. doi: 10.1148/rg.287085060
|
| [5] |
M. R. Kocher, D. H. Sheafor, E. Bruner, C. Newman, J. F. M. Nino, Diagnosis of abnormally invasive posterior placentation: the role of MR imaging, Radiol. Case Rep., 12 (2017), 295-299. doi: 10.1016/j.radcr.2017.01.014
|
| [6] |
D. Pizzi, A. Tavoletta, R. Narciso, D. Mastrodicasa, S. Trebeschi, C. Celentano, et al., Prenatal planning of placenta previa: diagnostic accuracy of a novel MRI-based prediction model for placenta accreta spectrum (PAS) and clinical outcome, Abdom. Radiol., 44 (2019), 1873-1882. doi: 10.1007/s00261-018-1882-8
|
| [7] | L. Alamo, A. Anaye, J. Rey, Denys A, Bongartz G, Terraz S et al., Detection of suspected placental invasion by MRI: do the results depend on observer' experience?, Eur. J. Radiol., 82 (2013), 51-57. |
| [8] |
Y. Ueno, K. Kitajima, F. Kawakami, T. Maeda, Y. Suenaga, S. Takahashi, et al., Novel MRI finding for diagnosis of invasive placenta praevia: evaluation of findings for 65 patients using clinical and histopathological correlations, Eur. Radiol., 24 (2014), 881-888. doi: 10.1007/s00330-013-3076-7
|
| [9] |
A. Lax, M. R. Prince, K. W. Mennitt, J. R. Schwebach, N. E. Budorick, The value of specific MRI features in the evaluation of suspected placental invasion, Magn. Reson. Imaging, 25 (2007), 87-93. doi: 10.1016/j.mri.2006.10.007
|
| [10] |
H. Sun, H. Qu, L. Chen, W. Wang, Y. Liao, L. Zou, et al., Identification of suspicious invasive placentation based on clinical mri data using textural features and automated machine learning, Eur. Radiol., 29 (2019), 6152-6162. doi: 10.1007/s00330-019-06372-9
|
| [11] |
P. Lambin, E. Rios-Velazquez, R. Leijenaar, S. Carvalho, R. Stiphout, P. Granton, et al., Radiomics: extracting more information from medical images using advanced feature analysis, Eur. J. Cancer, 48 (2012), 441-446. doi: 10.1016/j.ejca.2011.11.036
|
| [12] | R. J. Gillies, P. E. Kinahan, H. Hricak, Radiomics: images are more than pictures, they are data, Radiology, 278 (2016), 563-577. |
| [13] | G. Langs, S. Röhrich, J. Hofmanninger, F. Prayer, J. Pan, C. Herold, et al., Machine learning: from radiomics to discovery and routine, Radiologe, 58 (2018), 1-6. |
| [14] | K. He, X. Zhang, S. Ren, J. Sun, Deep residual learning for image recognition, IEEE Conference on Computer Vision and Pattern Recognition, (2016), 770-778. |
| [15] | A. Krizhevsky, I. Sutskever, G. Hinton, Imagenet classification with deep convolutional neural networks, Adv. Neural Inf. Proc. Syst., 25 (2012), 1097-1105. |
| [16] |
H. B. Marcos, R. C. Semelka, S. Worawattanakul, Normal placenta: gadolinium-enhanced dynamic MR imaging, Radiology, 205 (1997), 493-496. doi: 10.1148/radiology.205.2.9356634
|
| [17] |
Y. O. Tanaka, S. Sohda, S. Shigemitsu, M. Niitsu, Y. Itai, High temporal resolution dynamic contrast MRI in a high-risk group for placenta accrete, Magn. Reson. Imaging, 19 (2001), 635-642. doi: 10.1016/S0730-725X(01)00388-5
|
| [18] |
D. Levine, P. D. Barnes, R. R. Edelman, Obstetric MR imaging, Radiology, 211 (1999), 609-617. doi: 10.1148/radiology.211.3.r99jn20609
|
| [19] | M. Zhu, MR imaging: a new clinical application, Chin. J. Magn. Reson. Imaging, 2 (2011), 7-12. |
| [20] |
J. J. M. Griethuysen, A. Fedorov, C. Parmar, A. Hosny, N. Aucoin, V. Narayan, et al., Computational Radiomics System to Decode the Radiographic Phenotype, Cancer Res., 77 (2017), 104-107. doi: 10.1158/0008-5472.CAN-17-0339
|
| [21] | R. Girshick, J. Donahue, T. Darrell, J. Malik, Rich feature hierarchies for accurate object detection and semantic segmentation, IEEE Conference on Computer Vision and Pattern Recognition, (2014), 580-587. |
| [22] | S. Chen, K. Ma, Y. Zheng, Med3D: Transfer Learning for 3D Medical Image Analysis, 2019. Available from: https://arXiv.org/abs/1904.00625v1. |
| [23] | N. Meinshausen, P. Bühlmann, High-dimensional graphs and variable selection with the Lasso, Ann. Stat., 34 (2006), 1436-1462. |
| [24] |
N. S. A. Rahaim, E. H. Whitby, The MRI features of placental adhesion disorder and their diagnostic significance: systematic review, Clin Radiol., 70 (2015), 917-925. doi: 10.1016/j.crad.2015.04.010
|
| [25] | T. Eshkoli, A. Y. Weintraub, R. Sergienko, E. Sheiner, Placenta accreta: risk factors, perinatal outcomes, and consequences for subsequent births, Am. J. Obstet. Gynecol., 208 (2013), 219.e1-7. |
| [26] | Z. S. Bowman, A. G. Eller, T. R. Bardsley, T. Greene, M. W. Varner, R. M. Silver, Risk factors for placenta accreta: a large prospective cohort, Am. J. Perinatol., 31 (2014), 799-804. |
| [27] |
R. M. Silver, M. B. Landon, D. J. Rouse, K. J. Leveno, C. Y. Spong, E. A. Thom, et al., Maternal morbidity associated with multiple repeat cesarean deliveries, Obstet. Gynecol., 107 (2006), 1226-1232. doi: 10.1097/01.AOG.0000219750.79480.84
|
| [28] | A. A. Shamshirsaz, K. A. Fox, B. Salmanian, C. R. Diaz-Arrastia, W. Lee, B. W. Baker, et al., Maternal morbidity in patients with morbidly adherent placenta treated with and without a standardized multidisciplinary approach, Am. J. Obstet. Gynecol., 212 (2015), 218.e1-9. |
| [29] | A. A. Shamshirsaz, K. A. Fox, H. Erfani, S. L. Clark, B. Salmanian, B. W. Baker, et al., Multidisciplinary team learning in the management of the morbidly adherent placenta: outcome improvements over time, Am. J. Obstet. Gynecol., 216 (2017), 612.e1-5. |
| [30] |
R. M. Silver, K. A. Fox, J. R. Barton, A. Z. Abuhamad, H. Simhan, C. K. Huls, et al., Center of excellence for placenta accrete, Am. J. Obstet. Gynecol., 212 (2015), 561-568. doi: 10.1016/j.ajog.2014.11.018
|


Figures(7) / Tables(5)

Qian Shao, Rongrong Xuan, Yutao Wang, Jian Xu, Menglin Ouyang, Caoqian Yin, Wei Jin. Deep learning and radiomics analysis for prediction of placenta invasion based on T2WI[J]. Mathematical Biosciences and Engineering, 2021, 18(5): 6198-6215. doi: 10.3934/mbe.2021310


 DownLoad: