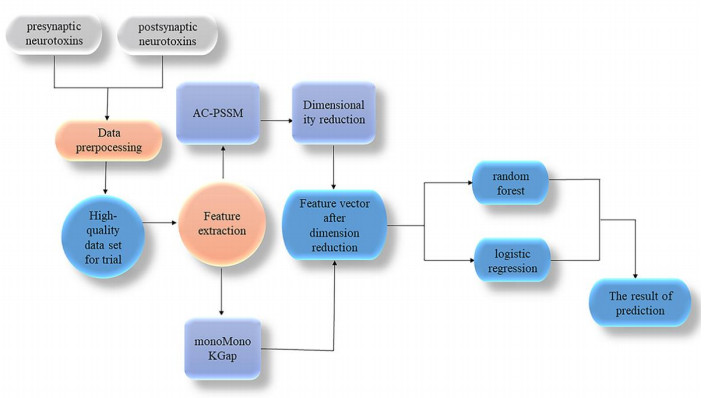
A neurotoxin is essentially a protein that mainly acts on the nervous system; it has a selective toxic effect on the central nervous system and neuromuscular nodes, can cause muscle paralysis and respiratory paralysis, and has strong lethality. According to their principle of action, neurotoxins are divided into presynaptic neurotoxins and postsynaptic neurotoxins. Correctly identifying presynaptic and postsynaptic nerve toxins provides important clues for future drug development and the discovery of drug targets. Therefore, a predictive model, Neu_LR, was constructed in this paper. The monoMonokGap method was used to extract the frequency characteristics of presynaptic and postsynaptic neurotoxin sequences and carry out feature selection, then, based on the important features obtained after dimensionality reduction, the prediction model Neu_LR was constructed using a logistic regression algorithm, and ten-fold cross-validation and independent test set validation were used. The final accuracy rates were 99.6078 and 94.1176%, respectively, which proved that the Neu_LR model had good predictive performance and robustness, and could meet the prediction requirements of presynaptic and postsynaptic neurotoxins. The data and source code of the model can be freely download from https://github.com/gyx123681/.
Citation: Wen Zhu, Yuxin Guo, Quan Zou. Prediction of presynaptic and postsynaptic neurotoxins based on feature extraction[J]. Mathematical Biosciences and Engineering, 2021, 18(5): 5943-5958. doi: 10.3934/mbe.2021297
A neurotoxin is essentially a protein that mainly acts on the nervous system; it has a selective toxic effect on the central nervous system and neuromuscular nodes, can cause muscle paralysis and respiratory paralysis, and has strong lethality. According to their principle of action, neurotoxins are divided into presynaptic neurotoxins and postsynaptic neurotoxins. Correctly identifying presynaptic and postsynaptic nerve toxins provides important clues for future drug development and the discovery of drug targets. Therefore, a predictive model, Neu_LR, was constructed in this paper. The monoMonokGap method was used to extract the frequency characteristics of presynaptic and postsynaptic neurotoxin sequences and carry out feature selection, then, based on the important features obtained after dimensionality reduction, the prediction model Neu_LR was constructed using a logistic regression algorithm, and ten-fold cross-validation and independent test set validation were used. The final accuracy rates were 99.6078 and 94.1176%, respectively, which proved that the Neu_LR model had good predictive performance and robustness, and could meet the prediction requirements of presynaptic and postsynaptic neurotoxins. The data and source code of the model can be freely download from https://github.com/gyx123681/.

| [1] |
F. Afifiyan, A. Armugam, P. Gopalakrishnakone, N. H. Tan, C. H. Tan, K. Jeyaseelan, Four new postsynaptic neurotoxins from Naja naja sputatrix venom: cDNA cloning, protein expression, and phylogenetic analysis, Toxicon, 36 (1998), 1871-1885. doi: 10.1016/S0041-0101(98)00108-1

|
| [2] |
A. J. Alexandrou, R. S. Duncan, A. Sullivan, J. C. Hancox, D. J. Leishman, H. J. Witchel, et al., Mechanism of hERG K+ channel blockade by the fluoroquinolone antibiotic moxifloxacin, Brit. J. Pharmacol., 147 (2006), 905-916. doi: 10.1038/sj.bjp.0706678
|
| [3] |
J. P. Forder, M. Tymianski, Postsynaptic mechanisms of excitotoxicity: Involvement of postsynaptic density proteins, radicals, and oxidant molecules, Neuroscience, 158 (2009), 293-300. doi: 10.1016/j.neuroscience.2008.10.021
|
| [4] | F. Li, M. Luo, W. Zhou, J. Li, X. Jin, Z. Xu, et al., Single cell RNA and immune repertoire profiling of COVID-19 patients reveal novel neutralizing antibody, Protein Cell, (2020), 1-5. |
| [5] |
R. Su, X. Liu, L. Wei, Q. Zou, Deep-Resp-Forest: A deep forest model to predict anti-cancer drug response, Methods, 166 (2019), 91-102. doi: 10.1016/j.ymeth.2019.02.009
|
| [6] |
R. Su, X. Liu, G. Xiao, L. Wei, Meta-GDBP: A high-level stacked regression model to improve anticancer drug response prediction, Briefings Bioinf., 21 (2020), 996-1005. doi: 10.1093/bib/bbz022
|
| [7] | H. Tang, Y. Yang, C. Zhang, R. Chen, P. Huang, C. Duan, et al., Predicting presynaptic and postsynaptic neurotoxins by developing feature selection technique, BioMed. Res. Int., 2017 (2017), 3267325. |
| [8] |
Y. Ding, J. Tang, F. Guo, Identification of drug-target interactions via dual laplacian regularized least squares with multiple kernel fusion, Knowl.-Based Syst., 204 (2020), 106254. doi: 10.1016/j.knosys.2020.106254
|
| [9] |
Y. Ding, J. Tang, F. Guo, Identification of drug-side effect association via multiple information integration with centered kernel alignment, Neurocomputing, 325 (2019), 211-224. doi: 10.1016/j.neucom.2018.10.028
|
| [10] | Z. Hong, X. Zeng, L. Wei, X. Liu, Identifying enhancer-promoter interactions with neural network based on pre-trained DNA vectors and attention mechanism, Bioinformatics, 36 (2020), 1037-1043. |
| [11] |
Y. Shen, J. Tang, F. Guo, Identification of protein subcellular localization via integrating evolutionary and physicochemical information into Chou's general PseAAC, J. Theor. Biol., 462 (2019), 230-239. doi: 10.1016/j.jtbi.2018.11.012
|
| [12] | D. Zhang, H. D. Chen, H. Zulfiqar, S. Yuan, Q. Huang, Z. Zhang, et al., iBLP: An XGBoost-Based Predictor for Identifying Bioluminescent Proteins, Comput. Math. Methods Med., 2021 (2021). |
| [13] |
X. J. Zhu, C. Q. Feng, H. Y. Lai, W. Chen, L. Hao, Predicting protein structural classes for low-similarity sequences by evaluating different features, Knowl.-Based Syst., 163 (2019), 787-793. doi: 10.1016/j.knosys.2018.10.007
|
| [14] |
J. X. Tan, S. H. Li, Z. M. Zhang, C. Chen, W. Chen, H. Tang, et al., Identification of hormone binding proteins based on machine learning methods, Math. Biosci. Eng., 16 (2019), 2466-2480. doi: 10.3934/mbe.2019123
|
| [15] |
Z. Guo, P. Wang, Z. Liu, Y. Zhao, Discrimination of thermophilic proteins and non-thermophilic proteins using feature dimension reduction, Front. Bioeng. Biotechnol., 8 (2020), 584807. doi: 10.3389/fbioe.2020.584807
|
| [16] |
L. Cheng, Y. Hu, J. Sun, M. Zhou, Q. Jiang, DincRNA: a comprehensive web-based bioinformatics toolkit for exploring disease associations and ncRNA function, Bioinformatics, 34 (2018), 1953-1956. doi: 10.1093/bioinformatics/bty002
|
| [17] |
B. Liu, X. Wang, Q. Zou, Q. Dong, Q. Chen, Protein remote homology detection by combining Chou's pseudo amino acid composition and profile-based protein representation, Mol. Inf., 32 (2013), 775-782. doi: 10.1002/minf.201300084
|
| [18] |
X. Zeng, Y. Zhong, W. Lin, Q. Zou, Predicting disease-associated circular RNAs using deep forests combined with positive-unlabeled learning methods, Briefings Bioinf., 21 (2020), 1425-1436. doi: 10.1093/bib/bbz080
|
| [19] |
S. Jin, X. Zeng, F. Xia, W. Huang, X. Liu, Application of deep learning methods in biological networks, Briefings Bioinf., 22 (2021), 1902-1917. doi: 10.1093/bib/bbaa043
|
| [20] |
B. Liu, X. Gao, H. Zhang, BioSeq-Analysis2.0: an updated platform for analyzing DNA, RNA and protein sequences at sequence level and residue level based on machine learning approaches, Nucleic Acids Res., 47 (2019), e127. doi: 10.1093/nar/gkz740
|
| [21] | J. Shao, K. Yan, B. Liu, FoldRec-C2C: protein fold recognition by combining cluster-to-cluster model and protein similarity network, Briefings Bioinf., 22 (2021). |
| [22] |
L. Yu, M. Wang, Y. Yang, F. Xu, X. Zhang, F. Xie, et al., Predicting therapeutic drugs for hepatocellular carcinoma based on tissue-specific pathways, PLoS Comput. Biol., 17 (2021), e1008696. doi: 10.1371/journal.pcbi.1008696
|
| [23] |
Y. Lei, Q. Li, Prediction of presynaptic and postsynaptic neurotoxins by the increment of diversity, Toxicol. Vitro, 23 (2009), 346-348. doi: 10.1016/j.tiv.2008.12.015
|
| [24] |
X. Zhao, Q. Jiao, H. Li, Y. Wu, H. Wang, S. Huang, et al., ECFS-DEA: an ensemble classifier-based feature selection for differential expression analysis on expression profiles, BMC Bioinf., 21 (2020), 43. doi: 10.1186/s12859-020-3388-y
|
| [25] |
R. Su, J. Hu, Q. Zou, B. Manavalan, L. Wei, Empirical comparison and analysis of web-based cell-penetrating peptide prediction tools, Briefings Bioinf., 21 (2020), 408-420. doi: 10.1093/bib/bby124
|
| [26] | L. Yu, D. Zhou, L. Gao, Y. Zha, Prediction of drug response in multilayer networks based on fusion of multiomics data, Methods, 2020. |
| [27] | J. Zhang, Y. Ju, H. Lu, P. Xuan, Q. Zou, Accurate identification of cancerlectins through hybrid machine learning technology, Int. J. Genomics, 2016 (2016). |
| [28] |
X. Zeng, W. Lin, M. Guo, Q. Zou, A comprehensive overview and evaluation of circular RNA detection tools, Plos Comput. Biol., 13 (2017), e1005420. doi: 10.1371/journal.pcbi.1005420
|
| [29] | J. Shao, B. Liu, ProtFold-DFG: protein fold recognition by combining Directed Fusion Graph and PageRank algorithm, Briefings Bioinf., 22 (2021). |
| [30] |
Y. Shang, L. Gao, Q. Zou, L. Yu, Prediction of drug-target interactions based on multi-layer network representation learning, Neurocomputing, 434 (2021), 80-89. doi: 10.1016/j.neucom.2020.12.068
|
| [31] |
X. Pan, H. Li, T. Zeng, Z. Li, L. Chen, T. Huang, et al., Identification of protein subcellular localization with network and functional embeddings, Front. Genet., 11 (2021), 626500. doi: 10.3389/fgene.2020.626500
|
| [32] |
L. Wei, S. Wan, J. Guo, K. Wong, A novel hierarchical selective ensemble classifier with bioinformatics application, Artif. Intell. Med., 83 (2017), 82-90. doi: 10.1016/j.artmed.2017.02.005
|
| [33] |
W. Yu, Z. Jiang, J. Wang, R. Tao, Using feature selection technique for drug-target interaction networks prediction, Current Med. Chem., 18 (2011), 5687-5693. doi: 10.2174/092986711798347270
|
| [34] |
W. Su, M. L. Liu, Y. H. Yang, J. Wang, S. Li, H. Lv, et al., PPD: A Manually Curated Database for Experimentally Verified Prokaryotic Promoters, J. Mol. Biol., 433 (2021), 166860. doi: 10.1016/j.jmb.2021.166860
|
| [35] | Z. Y. Liang, H. Lai, H. Yang, C. Zhang, H. Yang, H. Wei, et al., Pro54DB: a database for experimentally verified sigma-54 promoters, Bioinformatics, 33 (2017), 467-469. |
| [36] |
The UniProt Consortium, The universal protein resource (UniProt) in 2010, Nucleic Acids Res., 38 (2010), D142-148. doi: 10.1093/nar/gkp846
|
| [37] |
B. Liu, BioSeq-Analysis: a platform for DNA, RNA and protein sequence analysis based on machine learning approaches, Briefings Bioinf., 20 (2019), 1280-1294. doi: 10.1093/bib/bbx165
|
| [38] |
B. Manavalan, S. Basith, T. H. Shin, D. Y. Lee, L. Wei, G. Lee, 4mCpred-EL: an ensemble learning framework for identification of DNA N4-methylcytosine sites in the mouse genome, Cells, 8 (2019), 1332. doi: 10.3390/cells8111332
|
| [39] |
M. Mandal, A. Mukhopadhyay, U. Maulik, Prediction of protein subcellular localization by incorporating multiobjective PSO-based feature subset selection into the general form of Chou's PseAAC, Med. Biol. Engi. Comput., 53 (2015), 331-344. doi: 10.1007/s11517-014-1238-7
|
| [40] |
R. Muhammod, S. Ahmed, D. M. Farid, S. Shatabda, A. Sharma, A. Dehzangi, et al., PyFeat: a Python-based effective feature generation tool for DNA, RNA and protein sequences, Bioinformatics, 35 (2019), 3831-3833. doi: 10.1093/bioinformatics/btz165
|
| [41] |
L. Dou, X. Li, H. Ding, L. Xu, H. Xiang, Prediction of m5C modifications in RNA sequences by combining multiple sequence features, Mol. Ther. Nucleic Acids, 21 (2020), 332-342. doi: 10.1016/j.omtn.2020.06.004
|
| [42] |
E. Teimoury, M. R. Gholamian, B. Masoum, M. Ghanavati, An optimized clustering algorithm based on K-means using Honey Bee Mating algorithm, Sensors, 16 (2016), 1-19. doi: 10.1109/JSEN.2016.2616227
|
| [43] |
Y. Freund, R. E. Schapire, A decision-theoretic generalization of on-line learning and an application to boosting, J. Comput. Syst. Sci., 55 (1997), 119-139. doi: 10.1006/jcss.1997.1504
|
| [44] | Y. Freund, R. E. Schapire, Experiments with a new boosting algorithm, in icml, 96 (1996), 148-156. |
| [45] |
L. Cai, X. Ren, X. Fu, L. Peng, M. Gao, X. Zeng, iEnhancer-XG: Interpretable sequence-based enhancers and their strength predictor, Bioinformatics, 37 (2021). 1060-1067. doi: 10.1093/bioinformatics/btaa914
|
| [46] |
Q. Dong, S. Zhou, J. Guan, A new taxonomy-based protein fold recognition approach based on autocross-covariance transformation, Bioinformatics, 25 (2009), 2655-2662. doi: 10.1093/bioinformatics/btp500
|
| [47] | B. Liu, H. Wu, K. C. Chou, Pse-in-One 2.0: an improved package of web servers for generating various modes of pseudo components of DNA, RNA, and protein sequences, Nat. Sci., 9 (2017). |
| [48] |
S. F. Altschul, T. L. Madden, A. A. Schaffer, J. Zhang, Z. Zhang, W. Miller, et al., Gapped BLAST and PSI-BLAST: a new generation of protein database search programs, Nucleic Acids Res., 25 (1997), 3389-3402. doi: 10.1093/nar/25.17.3389
|
| [49] |
L. Yu, Y. Shi, Q. Zou, S. Wang, L. Zheng, L. Gao, Exploring drug treatment patterns based on the action of drug and multilayer network model, Int. J. Mol. Sci., 21 (2020), 5014. doi: 10.3390/ijms21145014
|
| [50] | Z. Tao, Y. Li, Z. Teng, Y. Zhao, A method for identifying vesicle transport proteins based on LibSVM and MRMD, Comput. Math. Methods Med., 2020 (2020), 1-9. |
| [51] | I. M. Javed, F. Ibrahima, S. B. Belhaouari, A. M. Said, Efficient feature selection and classification of protein sequence data in bioinformatics, Sci. World J., 2014 (2014), 314-319. |
| [52] |
L. Xu, G. Liang, L. Wang, C. Liao, A novel hybrid sequence-based model for identifying anticancer peptides, Genes, 9 (2018), 158. doi: 10.3390/genes9030158
|
| [53] |
Y. H. Zhang, H. Li, T. Zeng, L. Chen, Z. Li, T. Huang, et al., Identifying transcriptomic signatures and rules for SARS-CoV-2 infection, Front. Cell Dev. Biol., 8 (2021), 627302. doi: 10.3389/fcell.2020.627302
|
| [54] | X. Zhou, T. Liu, D. Yan, X. Shi, X. Jin, An action-based Markov chain modeling approach for predicting the window operating behavior in office spaces, in Building Simulation, 14 (2021), 301-315. |
| [55] |
Y. H. Zhang, T. Zeng, L. Chen, T. Huang, Y. Cai, Determining protein-protein functional associations by functional rules based on gene ontology and KEGG pathway, Biochim. Biophys. Acta (BBA)-Proteins Proteomics, 1869 (2021), 140621. doi: 10.1016/j.bbapap.2021.140621
|
| [56] |
H. Yang, Y. Luo, X. Ren, M. Wu, X. He, B. Peng, et al., Risk prediction of diabetes: big data mining with fusion of multifarious physical examination indicators, Inf. Fusion, 75 (2021), 140-149. doi: 10.1016/j.inffus.2021.02.015
|
| [57] |
H. Wang, Y. Ding, J. Tang, F. Guo, Identification of membrane protein types via multivariate information fusion with Hilbert-Schmidt Independence Criterion, Neurocomputing, 383 (2020), 257-269. doi: 10.1016/j.neucom.2019.11.103
|
| [58] |
Y. Ding, J. Tang, F. Guo, Identification of drug-target interactions via fuzzy bipartite local model, Neural Comput. Appl., 32 (2020), 10303-10319. doi: 10.1007/s00521-019-04569-z
|
| [59] | R. Su, H. Wu, X. Bo, X. Liu, L. Wei, Developing a multi-dose computational model for drug-induced hepatotoxicity prediction based on toxicogenomics data, IEEE/ACM Trans. Comput. Biol. Bioinf., 16 (2018), 1231. |
| [60] |
L. Wei, P. Xing, J. Zeng, J. Chen, R. Su, F. Guo, Improved prediction of protein-protein interactions using novel negative samples, features, and an ensemble classifier, Artif. Intell. Med., 83 (2017), 67-74. doi: 10.1016/j.artmed.2017.03.001
|
| [61] |
X. Zeng, S. Zhu, X. Liu, Y. Zhou, R. Nussinov, F. Cheng, deepDR: a network-based deep learning approach to in silico drug repositioning, Bioinformatics, 35 (2019), 5191-5198. doi: 10.1093/bioinformatics/btz418
|
| [62] |
R. W. Snow, C. A. Guerra, A. M. Noor, H. Y. Myint, S. I. Hay, The global distribution of clinical episodes of Plasmodium falciparum malaria, Nature, 434 (2005), 214-217. doi: 10.1038/nature03342
|
| [63] | H. Wang, J. Tang, Y. Ding, F. Guo, Exploring associations of non-coding RNAs in human diseases via three-matrix factorization with hypergraph-regular terms on center kernel alignment, Briefings Bioinf., 2021. |
| [64] | J. Li, Y. Pu, J. Tang, Q. Zou, F. Guo, DeepATT: a hybrid category attention neural network for identifying functional effects of DNA sequences, Briefings Bioinf., 22 (2021). |
| [65] |
Y. Shen, Y. Ding, J. Tang, Q. Zou, F. Guo, Critical evaluation of web-based prediction tools for human protein subcellular localization, Briefings Bioinf., 21 (2020), 1628-1640. doi: 10.1093/bib/bbz106
|
| [66] |
X. Fu, L. Cai, X. Zeng, Q. Zou, StackCPPred: a stacking and pairwise energy content-based prediction of cell-penetrating peptides and their uptake efficiency, Bioinformatics, 36 (2020), 3028-3034. doi: 10.1093/bioinformatics/btaa131
|
| [67] | L. Yu, F. Xu, L. Gao, Predict new therapeutic drugs for hepatocellular carcinoma based on gene mutation and expression, Front. Bioeng. Biotechnol., 8 (2020). |
| [68] | L. Cai, L. Wang, X. Fu, C. Xia, X. Zeng, Q. Zou, ITP-Pred: an interpretable method for predicting, therapeutic peptides with fused features low-dimension representation, Briefings Bioinf., 2020. |
| [69] |
Z. Chen, P. Zhao, F. Li, A. Leier, T. T. Marquez-Lago, Y. Wang, et al., iFeature: a python package and web server for features extraction and selection from protein and peptide sequences, Bioinformatics, 34 (2018), 2499-2502. doi: 10.1093/bioinformatics/bty140
|
| [70] | L. Wei, M. Liao, Y. Gao, R. Ji, Z. He, Q. Zou, Improved and promising identification of human microRNAs by incorporating a high-quality negative set, IEEE/ACM Trans. Comput. Biol. Bioinf., 11 (2013), 192-201. |
| [71] |
L. Wei, H. Chen, S. Ran, M6APred-EL: a sequence-based predictor for identifying N6-methyladenosine sites using ensemble learning, Mol. Ther. Nucleic Acids, 12 (2018), 635-644. doi: 10.1016/j.omtn.2018.07.004
|

Figures(2) / Tables(7)

Wen Zhu, Yuxin Guo, Quan Zou. Prediction of presynaptic and postsynaptic neurotoxins based on feature extraction[J]. Mathematical Biosciences and Engineering, 2021, 18(5): 5943-5958. doi: 10.3934/mbe.2021297


 DownLoad: