1.
Introduction
The traditional healthcare business model is mainly based on the technological effects of blocking. At the same time, it has been confirmed that preventive measures are much more effective and economically feasible. Most EU countries are aging (around 17–20% according to Europa.eu), and by 2050 a third of the population is projected to reach 60 years of age and older [1]. A significant part of this population (14.1% based on Europa.eu) lives alone (Europa, 2016). But living alone means getting more professional help [2], which imposes enormous costs on the public health system. Until 2030, when mortality is declining, and the number of newborns is reaching an older population, this dependent population in Europe is expected to increase to around 70%. Although the percentage of healthy older people has increased, it is reported that more than 80% of older people have at least one chronic disease, and 50% have at least two [3].
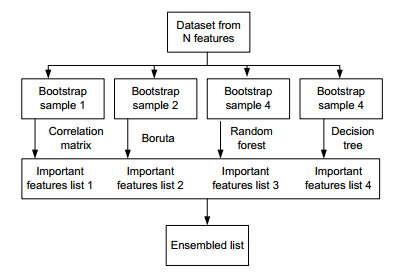
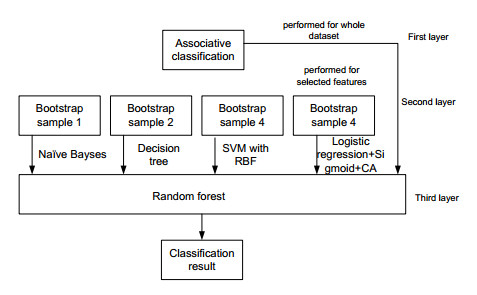
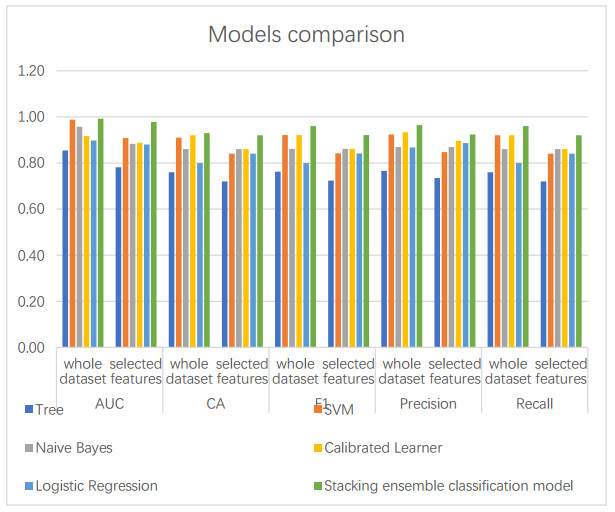
Starting from December 2019, the COVID-19 pandemic has globally strained medical resources and caused significant mortality. As of 25 December 2021, more than 280,000,000 coronavirus cases have been reported worldwide, with more than 800,000 daily new cases, and over 5,400,000 patients have died with about 8,000 daily deaths [4]. About 80% of SARS-CoV-2 patients have mild illnesses whose symptoms usually disappear within two weeks [5]. However, 20% need hospitalization and increased medical support with a mortality rate of about 13.4% [5]. Therefore, there is a constant need for a SARS-CoV-2 severity risk assessment and prediction, preferably quantitatively, which is extremely important for patient management and medical resource allocation.
Biomarkers of aging are used to predict possible changes in the body that lead to disability due to functional age-related changes. Biomarkers of aging are markers that can predict the functional capacity of an organism at a certain age better than chronological age. The immune system is a leading factor in the aging; its main impact is manifested through increased inflammation and reduced effectiveness of cellular immunity. Hence, the need to involve relevant markers to develop interventions to increase the duration of healthy longevity becomes clearer. Thus, control of chronic age-related diseases (diabetes and obesity) and biological markers can predict functional changes in the body. Besides, the analysis of other personal indicators will determine how to reduce the harmful effects of such changes by extending the period of active activity longevity. Sociological research also shows that people in certain regions remain active for a long time, and there are far fewer people who are obese. Therefore, it is also advisable to analyze the environment and habitat parameters and their impact on the parameters of the organism.
Diabetes increases the likelihood of severe COVID-19. New clinical data and experiments show that this can work in the opposite direction: scientists are recording new cases where COVID-19 has sharply provoked type 1 diabetes in humans. The World Health Organization views diabetes as a disease, on a par with respectable age, making someone more vulnerable to severe COVID-19 infection. Cellular immunity is an essential part of protection against viral diseases. Its effectiveness decreases with age due to a decrease in the pool of T-cell receptors. This process explains the significant increase in mortality of COVID-19 with age [6]. Therefore, another critical factor is the search for possible relationships between biomarkers of aging and COVID resistance.
This paper aims to develop and validate a novel ensemble machine-learning model based on clinical and immunological features for severity risk assessment and post-COVID rehabilitation duration for SARS-CoV-2 patients.
The main contribution of the paper is as follows:
1) A new hybrid ensemble feature selection model for a COVID-19 severity prediction system is proposed as an automatic feature cut-off rank identifier.
2) A high accuracy three-layer stacking ensemble classification model for intelligent analysis of short sets of medical data is proposed. Together with weak predictors, the associative rules were used to improve the classification quality. The proposed ensemble allows using a random forest model as an aggregator for weak repressors' results generalization.
The remainder of the paper is organized as follows: Section 2 highlights the motivations of this paper and discusses related works and their limitations. Section 3 presents the dataset puts forward the proposed feature selection ensemble and three-layer stacking ensemble. Section 4 describes the experimental setup, presents and discusses the main results. Finally, Section 5 concludes this paper.
2.
State of the art
The study of the SARS-CoV-2 severity and its prediction began from the first pandemic stages when the first data collections became available (see, e.g., [5,7,8,9]). The immune-based machine learning model for COVID-19 severity prediction was developed in paper [10] using a bioinformatics approach to study and forecast the immunologic phases of SARS-CoV-2 disease. The authors [10] have explored the role of CCR5 and its ligands to build an effective COVID-19 treatment strategy. The trial includes 26 moderate COVID-19 patients, 48 severe ones, 121 patients with post-acute sequelae of COVID-19 symptoms, accompanied by a 29 individual control group. The paper [10] concludes that severe patients are characterized by excessive inflammation and dysregulated T-cell activation, recruitment, and counteracting activities. The class imbalance problem in that study has been solved by minority class synthetic oversampling. Random forest was used as a classifier in paper [10] with multi-class accuracy of 0.8, precision 0.62, recall 0.65, and F1 value of 0.63. The paper concludes that the cytokine profiles could be used as a feature for effective COVID-19 severity classification. Paper [13] identifies the top ten proteins responsible for COVID-19 severity using an artificial intelligence approach, namely the gradient boosted tree algorithm. The authors of [11] showed that the proposed techniques outperform in classifying COVID-19 severity compared to deep learning and random forest models and concluded that effective predictive biomarkers for COVID-19 analysis and modeling could be revealed in further comprehensive studies.
The extensive study of COVID-19 severity for 1,926,526 US patients was reported in reference [12] using the National COVID Cohort Collaborative repository. The comorbidity, sex, race, ethnicity, body mass index (BMI), antimicrobial and immunomodulatory medication have been used for severity modeling and prediction in this study [12]. The authors conclude that patient demographic characteristics and comorbidities were associated with higher clinical severity in the developed statistical model. Another approach represents the study of X-Ray [13,14], computed tomography [15,16] or ultrasound [17] lung images with neural networks techniques to analyze and predict COVID-19 severity based on image processing. Thus, the authors of [17] present the rapid diagnosis approach to predict the disease course for COVID-19 patients based on lung ultrasound. They used a convolutional neural network architecture which includes an autoencoder network with long short-term memory layers to improve the classification accuracy.
A comprehensive review of the machine learning approaches in COVID-19 diagnosis, mortality, and severity risk prediction was published in reference [18]. The authors have analyzed 113 papers published in 2020 and 2021 dealing with machine learning applications in COVID-19 diagnosis and prediction tasks. The paper [18] shows that the most used methods for COVID-19 diagnosing are XGBoost, random forest and linear regression models, and the combination of several methods, like the random forest, Naïve Bayes, and linear regression, support vector machines and k-nearest neighbors. The main limitations for practical machine learning application in COVID-19 diagnosis and prediction, according to [18], are imbalanced data sets and selection bias. Nevertheless, the results of machine learning models reviewed in paper [18] are consistent with those of medical studies.
Paper [19] used multilayered perceptron and cross-validation for the COVID-19 regression task. The hyperparameters were selected based on the grid search algorithm. Gradient boost regressor is used for blood biomarkers predicting in paper [20]. The performed feature selection has extracted the ten best features from blood analysis.
In addition, genetic algorithms are used for new cases of COVID-19 prediction and the estimation of epidemiology curve in paper [21].
Studies based on the collected datasets using standard machine learning methods [22,23,24,25] have not demonstrated high prediction accuracy. Hence, different machine learning algorithms are combined in papers [26,27,28,29,30].
Paper [31] uses feature selection, XGBoost and decision tree to determine COVID biomarkers; however, the F1-score does not rise above 0.7. In paper [32], the CH4 and CH8 immunodeficiency markers and their association with coronavirus infections were analyzed using statistical models, including the Cox model. Accordingly, it was not possible to prevent harmful situations. In paper [33], the empirical mode decomposition (EEMD) and the artificial neural network (ANN) were used to predict the COVID-19 epidemic. Thus, to prolong the active period of life, it is necessary to track the dynamics of changes in molecular and biochemical markers, anthropometric indicators, behavioral factors, environmental parameters, habitat, etc. As a result, it is necessary to use a big data-based approach to collect information from disparate datasets, process them, and further analyze them. On the other hand, it is needed to analyze small data samples, including multimodal time series of changes in human parameters.
The analysis of literature sources showed the lack of a comprehensive approach to prolonging the active period of life and preventing exacerbation of chronic diseases. At the same time, as we see in the case of COVID, chronic diseases (diabetes and obesity) can reduce the ability to work and increase the likelihood of severe course of other diseases. Therefore, the paper's motivation is to identify changes that mean the probability of aging, as well as factors that prevent (postpone) this moment based on methods of small data samples analysis.
Many machine learning models can be used for small data samples analysis. The main problem is the generalization of the results. That is why forecasting models are often combined in an ensemble to obtain higher accuracy and stability in forecasting. Ensemble methods in classification problems are considered in paper [34]. Stacking technologies are often used to obtain higher generalized accuracy [35]. The idea of stacking is to combine predictive models into a multi-level ensemble [36]. At the first level, forecasts are obtained using machine learning models. The second level is the target level, at which the results of the first level are combined using some model. A cross-validation approach is often used to obtain a training data sample for the meta-level, in which the training sample is randomly divided into several subsamples. Then take one subsample to predict the target variable and the rest – to train the prediction model. This procedure is repeated to predict each subsample. In the case of non-stationary data, the validation subsample for forecasting is selected by time division, so the data for validation are on the time axis after the data samples for training.
The obtained forecast data on the validation subselection are used as independent variables for the forecast model of the second goal level of the stacking ensemble. The target variable on the target level is equal to the target variable on the data samples of the validation subsample. The cross-validation approach for obtaining a training sample at the meta-levels of the stacking ensemble is used to avoid retraining effects. The retraining occurs when subsamples of data samples for which forecasting is performed are used in model training. In this case, the forecasting accuracy for such subsamples may be overestimated while underestimated for new data. Stacking approaches make it possible to improve the forecasting results on a given data sample. A set of meta-model parameters also determines the effectiveness of stacking ensembles.
3.
Materials and methods
3.1. Dataset description
Dataset consists of 35 features and 122 instances collected from Lviv regional rehabilitation center for post-COVID patients with short- and long-term (more than 20 days) treatment and rehabilitation. The personal data were removed from the dataset and replaced with unique random identifiers. The next feature, sex, is processed using one-hot encoding technics and in the final dataset is presented in two components – female and male. Features like age, weight, height, BMI, CAT, pulse, the function of external respiration are taken as physiological parameters measured before inpatient treatment. The rest of the features were immune-based biomarkers as described below.
IL-8 is an important proinflammatory cytokine synthesized by neutrophils, monocytes, macrophages and endothelial cells. It has a pronounced chemoattractive activity against neutrophils; it protects the body from various pathogenic factors, especially infectious genesis, attracting neutrophils to the site of inflammation, thus inducing this neutrophilic interleukin type of inflammation.
IL-4 and IL-10 are the determining cytokines in the formation of CD4+ type of immunoreactivity, thereby determining a different kind of inflammation. The appearance of the CD4+ sort of immune response is essential in developing an eosinophilic type of inflammatory process in the tissues of the respiratory tract. Besides, IL-4 activates the synthesis of growth factors that contribute to the respiratory tract remodeling.
TNF-α is a protein that, by function, belongs to cellular signaling proteins, participates in systemic inflammation processes, and is one of the cytokines that form the acute phase reaction. Tumor necrosis factor is produced mainly by activated macrophages, less synthesized by other cell types (CD4+ lymphocytes, NK-cells, neutrophils, mast cells, eosinophils, and neutrophils). The primary role of TNF is to regulate the interaction of immune cells, to trigger the cell apoptosis process, causes cachexia, inflammation and tumor growth inhibition and virus replication, in sepsis governs the production of proinflammatory interleukins IL-1 and IL-6.
Zero cells (0-lymphocytes) do not carry markers like T- and B-cells. Zero cells make 10–20 % of the total lymphocytes in human peripheral blood. Some researchers consider them immature or overripe T- or B-lymphocytes because they have a small number of antigens common to B- and T-cells. Zero cells include K-cells and NK-cells.
CD3+ is a surface marker specific to all T-lymphocyte subpopulation cells. By function, it belongs to the family of proteins that form a complex of membrane signaling associated with the T-cell receptor. Mature T-lymphocytes are "responsible" for cellular immune responses and perform immunological monitoring of antigenic homeostasis in the body.
CD4+ is a characteristic of helper T-cells; also represented on monocytes, macrophages, dendritic cells. It binds to class II MHC molecules expressed on antigen-presenting cells, facilitating the recognition of peptide antigens. Helper T-lymphocytes (CD4+) are helpers (inducers) of the immune response, cells that regulate the strength of the body's immune response to a foreign antigen, as well as control the stability of the body's internal environment (antigenic homeostasis) and cause increased antibody synthesis.
CD8+ is a characteristic of suppressor and cytotoxic T-cells, NK-cells, mostly thymocytes. It is a T-cell activation receptor that facilitates the recognition of cell-bound class I MHC antigens.
CD16+ natural killers are part of innate immunity; they are involved in early response against viral infections and intracellular bacteria. Compared with cells of specific immunity (T- and B-lymphocytes), they have the advantage that they do not require long-term activation. Besides, NK-cells complement the action of T-cytotoxic cells can also regulate the immune response by producing various cytokines, including interferon-γ. They are the primary cells of antitumor protection. Their role is vital in manifesting cellular immunity in viral, protozoan, fungal and bacterial diseases caused by intracellular parasites. Their action is enhanced by interferon. The functions performed by natural killers can be divided into two main types: the production of cytokines that regulate the work of other cells of the immune system and the direct destruction of damaged cells.
CD22+ markers are expressed by mature B-lymphocytes. B-lymphocytes are responsible for the humoral adaptive immune response, primarily at removing extracellular infectious agents. After binding to a specific antigen, B-lymphocytes, in cooperation with T-lymphocytes and T-helpers proliferate, differentiate into plasma cells that secrete antibodies/immunoglobulins and memory cells. Defects of humoral immunity associated with the B-cells are sporadic, so a common hypoimmunoglobulinemia is mainly caused by other reasons.
CD4/CD8 immunoregulatory index reflects the ratio of CD4+ cells (T-helpers) to CD8+ cells (T-cytotoxic cells). It is a relative indicator that has an indicative value. Its small increase or decrease has no independent diagnostic value. Changes in the index force the clinician to focus on the reasons for the deviation of this index.
The immunoregulatory index is assessed relative to the phase of the immune response. In the period of exacerbation and remission of clinical manifestations, the immunoregulatory index reaches high values due to the high percentage of T-helpers (CD4+ T-cells). During the recovery period, the value of the indicator decreases due to the increase in the level of CD8+ T-cells (killers). Violation of this pattern indicates the inadequacy of the immune response and the possibility of chronic infection due to incomplete removal of the pathogen.
The indicators of the control group of almost healthy individuals are presented in Table 1.
CD4 and CD8 are known as aging biomarkers. Immunological studying of blood with the determination of the biomarkers of cellular (subpopulations of lymphocytes – CD3, CD4, CD8, CD16, CD22) and humoral immunity (specific immunoglobulins – IgA, IgM, IgG), cytokine status (IL-2, IL-6, IL-8) is obtained to diagnose the duration of rehabilitation after COVID-19.
3.2. Performance evaluation metrics
The random sampling method was used for the validity of the model, randomly splitting the data into the training and testing set in the 80:20 proportion; the whole procedure was repeated ten times. The general performance evaluation metrics of the model were determined by averaging the corresponding values.
For the categorical classification task, the following metrics were used to measure the prediction efficiency [31,36]:
● Area under ROC (AUC) is the area under the receiver-operating curve.
● Classification accuracy (CA) is the proportion of correctly classified examples:
where: TP – true positive; TN – true negative; FP – false positive; and FN – false negative.
● Precision is the proportion of true positives among instances classified as positive.
● Recall is the proportion of true positives among all positive instances in the data.
● F-1 is a weighted harmonic mean of precision and recall:
For regression analysis and prediction of the absolute value of post-COVID rehabilitation, the following performance evaluation metrics have been used:
● Mean squared error (MSE) measures the average of the squares of the errors or deviations (the difference between the estimator and what is estimated).
where: n – number of items, Σ – summation notation, Actual – the original or observed y-value, Forecast – y-value from regression.
● Root mean square error (RMSE) is the square root of the arithmetic mean of the squares of a set of numbers (a measure of the imperfection of the fit of the estimator to the data). RMSE is normalized by the mean value of actual values:
● Mean absolute error (MAE) is used to measure how close forecasts or predictions are to eventual outcomes:
where: n – the number of items, Σ – summation symbol, |xi – x| – the absolute errors.
● Mean absolute percentage error (MAPE) is commonly used as a loss function for regression problems and in model evaluation:
where: n – number of items, Σ – summation notation, Actual – original or observed y-value, Forecast – y-value from regression.
● R2 is interpreted as the proportion of the variance in the dependent variable that is predictable from the independent variable:
3.3. Preprocessing stage. A hybrid ensemble feature selection model development
Selection of the right features is a very significant task during data processing. For example, in medicine [37], finding the minimum set of optimal attributes for the classification problem can help develop a diagnostic test. Selection of the important features (for example, determining genes responsible for a particular type of cancer) can help decipher the mechanisms underlying the problem of interest. There are three main classes of feature selection algorithms – filters, wrappers and built-in algorithms [38].
Filters are based on some metrics that are independent of the classification method. For example, the correlation of features with the target vector and information content criteria. They are applied before classification. One of the benefits of filtering is that it can be used as preprocessing to reduce space dimensionality and overcome overfitting. Filtering methods are generally fast. Filters are used to select features in clustering, to build an initial approximation [39]. Unfortunately, such methods are not designed to detect complex relationships between features and, as a rule, are not sensitive enough to identify all dependencies in the data.
Embedded algorithms perform feature selection during the classifier training procedure, and they explicitly optimize the set of features used to achieve better accuracy [40]. The main advantage of the built-in algorithms is that they usually find solutions faster, avoiding retraining data from scratch while eliminating the need to separate data into training and test subsamples. However, these algorithms are not universal.
Wrappers rely on feature importance information from some classification or regression methods and can therefore find deeper patterns in the data than filters. Wrappers can use any classifier that determines the degree of importance of the features.
The baseline of the hybrid ensemble feature selection model looks like the following:
● Several selectors using.
● Aggregation of the results.
Several wrapper algorithms will be used in the preprocessing stage for the first stage.
The correlation matrix shows the numerical value of the correlation coefficient for all possible combinations of variables. It is used mainly to find out the relationship between more than two variables.
The decision tree returns the feature weight as the criterion for evaluating features. It allows building a ranked list of selected features using different measures. CART [23] was used for feature selection with Gini-index as a measure in our case.
Random Forest [27] is an ensemble of numerous training-sensitive algorithms (decision trees). These algorithms have a slight offset. The bias of the training method is the deviation of the average response of the trained algorithm from the response of the ideal algorithm. Each of these classifiers is built on a random subset of objects and a random subset of features.
Boruta is a heuristic algorithm for selecting significant features based on the use of Random Forest [41]. At each iteration, those features are removed for which the Z-measure is less than the maximum Z-measure among the added features. To get the Z-measure of a feature, it is necessary to calculate its importance, obtained using the built-in algorithm in Random Forest, and divide it by the standard deviation of the feature importance. Added features are obtained as follows: the characteristics available in the selection are copied, and then each new attribute is filled by shuffling its values. This procedure is repeated several times to get statistically significant results, and variables are generated independently at each iteration.
The Jaccard index measures the similarity of the feature subsets selected by separated feature selectors (each selector is organized as a separated iteration):
where Si is the subset of features at the i-th iteration, for i = 1, …, n. The value of the Jaccard index varies from 0 to 1, where 1 implies the absolute similarity of subsets.
The schema of the hybrid ensemble feature selection model is given in Figure 1.
3.4. Processing stage. A three-layer stacking ensemble model development
Three-layer stacking is proposed in the paper. Associative rules are often used in classification tasks [42,43]. Associative classification mining is an approach in data mining that utilizes the association rule discovery techniques to construct classification systems. First, the association rules are generated from the training dataset with given support and confidence thresholds. Next, a prediction for the test dataset is made, and the classifier's accuracy is measured. However, the accuracy of associative classification largely depends on the rules we have before the classification [44].
Hence, we propose combining associative classification with weak classifiers into an ensemble to generalize the results.
The baseline of proposed three-layer classification models consists of the following steps:
1) In the first layer, associative rules are built for hidden dependencies mining. The whole dataset is used.
2) In the second layer, weak classifiers are chosen for the dataset consisting of important features.
3) Random forest as an aggregative machine learning model is used in the last stacking layer.
The schema of the three-layer stacking ensemble classification model is given in Figure 2.
4.
Results and discussion
We implemented our approach in Rstudio [45]. The essential packages we used were caret, rpart, Metrics, Boruta, Randomforest, rules and ggplot2 for visualization. To generate associative rules, we set the minimal support threshold in the a priori algorithm to 0.0001. We filtered out all rules with confidence below 0.001.
First, a new hybrid ensemble feature selection model for a machine learning-based post-COVID prediction system is implemented as an automatic feature cut-off rank identifier. Correlation matrix, decision tree, random forest and Boruta are used. The results of feature selectors are collected in Table 2.
Jaccard-index is used for the results aggregation. Based on results obtained from different feature selectors the list of important features is created as (Vpeak25 + Vpeak50 + Vpeak75 + Force exhalation volume + 0-lymphocytes + IL8 + CD4/CD8).
Next, clustering is used for data discretization. First, the number of clusters was identified using gap statistics (Figure 3).
According to Figure 2, two clusters are used. Next, a k-means algorithm with two clusters is applied. The results show that almost all objects are in a single class (see Figure 4). The same effect is obtained using Self-organizing maps (Figure 5) [46]. Therefore, the predictive models were used for all samples.
First, the normalization is performed using the log function. The main goal of normalization is to bring various data in a wide variety of units and ranges of values to a single form, which allows them to be compared with each other or used to calculate the similarity of objects. Next, different machine learning models are used for treatment duration prediction (continuous variable is used). Random sampling; training test size 80%; repeat train/test = 10. Ten-fold cross-validation was used. The results are listed in Table 3.
Besides, five-fold cross-validation was used as well. The results are listed in Table 4. It can be seen from the tables that the difference between "vanilla models" and cross-validated is relatively small. It can be explained by the limited size of the dataset.
The same models are used in the prediction process for selected features. The results for this experiment are listed in Table 5.
As can be seen from Tables 3 and 5, we obtained better results in some cases, particularly for Linear regression, Regression tree, Random Forest, and k-NN. Both SVM models and ANN gave the worse outcomes for the selected features.
Next, the biomarkers indicating aging have been selected as features subset, and the regression analysis was applied to this model. These aging biomarkers include CD3, CD22, CD4, and CD8 features. The results of the COVID-19 duration prediction using the same set of ML models are presented in Table 6.
We tried to compare predictive accuracy for standard dimensionality reducing models during the next steps. We used Principal Component Analysis with eight components. The explained variance, in this case, is 86%. The results of COVID-19 duration prediction using ML models for all features and PCA-selected ones are summarized in Table 7.
From Table 7, one can see that the classification error has decreased after applying PCA analysis. In this experiment, the multilayered perceptron (MLP NN) is used with the following parameters: eight hidden layer neurons, ReLu activation function, Stochastic Gradient Descent solver, regularization (alpha) value – 65.
So, both neural networks with the above configuration (12 neurons + sigmoid function and eight neurons + ReLu function) give the second most accurate result and even the best prediction for a complete dataset. In our case, they are less sensitive to the dimensionality of the feature space. But the number of neurons in the hidden layer is equal to or higher than 8, i.e., the number of significant components selected by PCA, so it is possible the network can predict the whole dataset with high enough accuracy.
In the next stage, we solve the classification task. For this purpose, the target attribute "Duration" was transformed into a categorical variable. The binary classification task – short and long rehabilitation classes are presented. The dataset is unbalanced (90 long and 32 short), so balancing technics are used. Dataset was balanced by two methods: random selection of data from a larger class in an amount equal to the number of samples belonging to a smaller class and SMOTE strategy, which synthetically increases the number of samples of a minority class. After balancing dataset is presented with 62 instances for long class and 60 instances for short class.
The three-layer stacking ensemble classification model is now used for the transformed dataset. First, associative rules with the Apriori algorithm are used. The mined rules are presented in Table 8.
At the second layer, five classifiers are used in the proposed ensemble:
1) Tree – a tree algorithm with forward pruning
2) Naïve Bayes classifier
3) SVM with RBF kernel
4) Logistic Regression
5) Calibrated learner. This learner produces a model that calibrates the distribution of class probabilities and optimizes the decision threshold. A sigmoid function was used for probability calibration, while the decision threshold optimization was applied to optimize classification accuracy.
Table 9 presents the average over classes prediction efficiency using the AUC, CA, F1, Precision and Recall metrics. In contrast, Table 10 contains the same metrics for the classification model based on the eight PCA-selected features.
Tables 8 and 9 show some decrease in the prediction accuracy in the case of the classification model based on the eight selected features. This result needs further investigation and so far can be ascribed to the small size of the dataset, complex influence of the biomarkers on the COVID-19 duration (which is supported by poor classification efficiency of Naïve Bayes classifier), the existence of some features/comorbidities not included in the present dataset or to the sensitiveness of the classifiers to the dimensionality of the feature space.
Table 11 collects the "Long" target class prediction accuracy for the mentioned five ML classifiers and three-layer stacking ensemble classifier with Random forest aggregate for classification model based on the eight PCA selected features.
Figure 6 shows that, in general, using the existing dataset, the "Long" target class prediction efficiency is somewhat higher than that for the average over classes. On the other hand, one can note from the table that the Precision metric is higher for all the classifiers used, while the Recall has lower values. This stays for the fact that this kind of model is more precise in the classification of positive items. At the same time, it is worse for the classification of true positives among all positive instances in the dataset. On the other hand, a weighted harmonic mean of precision and recall (F1 metric) is a bit higher in the case of "Long" target class classification. Hence, we can conclude that higher precision compensates for lower recall value for this experiment.
Three-layer stacking ensemble classification model with Random Forest aggregate shows the best result compared with a decision tree, SVM and other classifiers.
5.
Conclusions and future work
Over the past two years, SARS-CoV-2 disease has become one of the most significant burdens to the global health care system, causing fatalities and significantly depleting health care resources. The disease can occur differently for different patients: from asymptomatic illness to hospitalization in the intensive care unit or even death. The question of what determines the severity of the disease is of interest to researchers worldwide. However, there is still no definitive answer to this question. It is commonly recognized that the severity of SARS-CoV-2 disease depends on both the comorbidity and the state of the patient's immune system, which is reflected in several biomarkers that can be obtained from biochemical laboratory studies.
Artificial intelligence techniques, particularly machine learning, can help conduct such clinical trials, as they can work with smaller data samples when using appropriate approaches. A study with a smaller sample of data, in this case, makes it possible to reduce the time to collect the dataset, which will reduce the number of clinical patients, and enable using predictive results faster, which will allow preventive measures for patients with potentially severe disease. This, in turn, can reduce the burden on the health care system and increase the effectiveness of treatment and rehabilitation of patients with severe cases.
Based on a dataset collected at the Lviv regional rehabilitation center, which contains anonymized information on the immune profile and other important diagnostic indicators, including external respiration function and oxygen saturation, a post-COVID rehabilitation duration classification model was built using ensembling of machine learning methods. A new hybrid ensemble feature selection model and a three-layer stacking ensemble classification model have been developed. The proposed hybrid ensemble feature selection model for a machine learning-based post-COVID prediction system can be used as an automatic feature cut-off rank identifier. The three-layer stacking ensemble classification model shows high accuracy for intelligent analysis of short medical datasets. The associative rules, together with weak predictors, improve the classification quality. The proposed ensemble uses a random forest model as an aggregator for weak repressors' results generalization.
The developed three-layer stacking ensemble classification model with Logistic Regression aggregate has the following values of performance evaluation metrics in the selected feature subset: area under ROC curve – 0.908; classification accuracy – 0.840; F1 score – 0.842; precision – 0.867; recall – 0.840. To summarize, the proposed model achieved a good prediction of SARS-CoV-2 disease severity based on the cytokines and physiological biomarkers. The results point out that changes in studied biomarkers associated with the severity of the disease may be used to monitor the severity and forecast the rehabilitation duration.
The main results are given below:
● COVID-19 treatment duration, both in days and categorical (i.e., long and short), is predicted based on the important biomarkers obtained by blood cytokines profiling using a machine learning approach.
● A new hybrid ensemble feature selection model for a machine learning-based post-COVID prediction system is proposed as an automatic feature cut-off rank identifier.
● The associative rules, together with weak predictors, improve the classification quality.
● The proposed three-layer stacking ensemble classification model uses the random forest model as an aggregator for weak generalization of repressor results.
● Aging-related biomarkers, viz. CD3+, CD4+, CD8+, CD22+ were examined to predict post-COVID rehabilitation duration.
● The research offers predictive attributes that can be used to monitor the severity of the disease and forecast the rehabilitation duration.
Further research will focus on increasing the data sample by adding information about new patients, refining the extended dataset model, and applying small data analysis approaches like input-doubling using nonlinear kernels [47] or RBF-based input-doubling [48] to improve prediction accuracy and reliability.
Conflict of interest
The authors declare no conflict of interest.
Acknowledgments
This research was supported by the National Research Foundation of Ukraine.