Our paper proposes a method to measure lung parenchyma parameters from pulmonary window computed tomography images based on ResU-Net model including the CT value, the density, the lung volume, and the surface area of the lungs of healthy rats, to help promote the quantitative analysis of lung parenchyma parameters of rats in medical respiratory researches. Through the analysis of the lung parenchyma parameters of the control group and the treatment group, the law of change among the lung parenchyma parameters is given in our paper. After comparing and analyzing the lung parenchyma parameter CT value and the density of the two groups, it is discovered that the lung parenchyma parameter CT value and the density significantly increase in the treatment group which is after continuously inhaling the nebulization of contrast agents. The change of the lung volume with the surface area in both two groups conforms to the law of lung changes during breathing. The relationship between the lung volume and the CT value or the density is analyzed and it is concluded that the lung volume is negatively correlated with the CT value or the density.
Citation: Yingjian Yang, Qiang Li, Yingwei Guo, Yang Liu, Xian Li, Jiaqi Guo, Wei Li, Lei Cheng, Huai Chen, Yan Kang. Lung parenchyma parameters measure of rats from pulmonary window computed tomography images based on ResU-Net model for medical respiratory researches[J]. Mathematical Biosciences and Engineering, 2021, 18(4): 4193-4211. doi: 10.3934/mbe.2021210
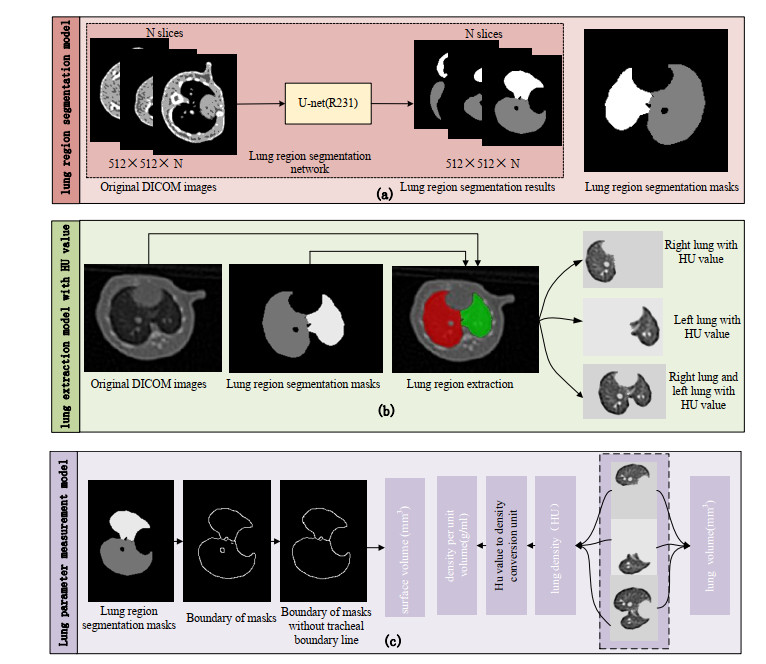
Our paper proposes a method to measure lung parenchyma parameters from pulmonary window computed tomography images based on ResU-Net model including the CT value, the density, the lung volume, and the surface area of the lungs of healthy rats, to help promote the quantitative analysis of lung parenchyma parameters of rats in medical respiratory researches. Through the analysis of the lung parenchyma parameters of the control group and the treatment group, the law of change among the lung parenchyma parameters is given in our paper. After comparing and analyzing the lung parenchyma parameter CT value and the density of the two groups, it is discovered that the lung parenchyma parameter CT value and the density significantly increase in the treatment group which is after continuously inhaling the nebulization of contrast agents. The change of the lung volume with the surface area in both two groups conforms to the law of lung changes during breathing. The relationship between the lung volume and the CT value or the density is analyzed and it is concluded that the lung volume is negatively correlated with the CT value or the density.

| [1] |
J. Morita, H. Yamashita, K. Sugihara, M. Wakamatsu, M. Sasaki, Spontaneous ocular abnormalities in sprague-dawley rats, Comp. Med., 70 (2020), 140-144. doi: 10.30802/AALAS-CM-19-000076

|
| [2] | J. H. Hwang, H. W. Jung, S. Y. Kang, A. N. Kang, J. N. Ma, X. L. Meng, et al., Therapeutic effects of acupuncture with MOK, a polyherbal medicine, on PTU-induced hypothyroidism in rats, Exp. Ther. Med., 16 (2018), 310-320. |
| [3] | J. F. Zhang, J. Liu, G. H. Gong, B. Zhang, C.X. Wei, Mongolian medicine RuXian-I treatment of estrogen-induced mammary gland hyperplasia in rats related to TCTP regulating apoptosis, Evidence-Based Complementary Altern. Med., 11 (2019), 1-10. |
| [4] |
Z. Wei, C. Xu, S. Liu, F. Song, Z. Liu, X. Qu, Metabonomics study of the effects of traditional Chinese medicine formula Ermiaowan on hyperuricemic rats, J. Sep. Sci., 41 (2018), 560-570. doi: 10.1002/jssc.201700985
|
| [5] | T. W. Shen, T. J. Liu, D. Uta, C. C. Lee, Acoustic perturbation of breathing: A newly discovered response to soft sounds in rats using an approach of image analysis, J. Med. Biol. Eng, 39 (2019), 43-53. |
| [6] | A. Morita, M. Ouchi, M. Terada, H. Kon, S. Kishimoto, K. Satoh, et al., Reproducible insulin secretion from isolated rat pancreas preparations using an organ bath, Exp. Anim., 67 (2017), 15-22. |
| [7] | J. d. M. Silveira, D. S. Rocha, G. de Morais, R. de Siqueira, J. Leal-Cardoso, J. Evangelista, Inhibitory effect of linalool in preparations of isolated smooth muscle of rat trachea with epithelium stimulated by electromechanical coupling, Ciência Anim., 27 (2017), 20-30. |
| [8] | C. Rohleder, F. Pahlisch, R. Graf, H. Endepols, F. M. Leweke, Different pharmaceutical preparations of 33 Δ9-tetrahydrocannabinol differentially affect its behavioral effects in rats, Addict. Biol., 25 (2020), 1-10. |
| [9] | R. Vega, C. Padilla, M. Trujillo, N. Quirk, E. Ferreira, Contribution of implanted, genetically modified muscle progenitor cells expressing BMP-2 to new bone formation in a rat osseous defect, Mol. Ther., 26 (2018), 208-218. |
| [10] |
X. Ren, D. A. Butterfield, Fidelity of the PINK1 knockout rat to oxidative stress and other characteristics of Parkinson disease, Free Radical Biol. Med., 163 (2021), 88-101. doi: 10.1016/j.freeradbiomed.2020.12.004
|
| [11] |
I. D. Apostolopoulos, S. I. Aznaouridis, M. A. Tzani, Extracting possibly representative COVID-19 biomarkers from X-ray images with deep learning approach and image data related to pulmonary diseases, J. Med. Biol. Eng, 40 (2020), 462-469. doi: 10.1007/s40846-020-00529-4
|
| [12] | H. Panwar, P. K. Gupta, M. K. Siddiqui, R. Morales-Menendez, V. Singh, Application of deep learning for fast detection of covid-19 in x-rays using nCOVnet, Chaos, Solitons Fractals, 138 (2020), 1-8. |
| [13] | A. Pan, L. Liu, C. Wang, H. Guo, X. Hao, Q. Wang, et al., Association of public health interventions with the epidemiology of the COVID-19 outbreak inWuhan, China, JAMA, 323 (2020), 1915-1923. |
| [14] | L. Wang, Z. Q. Lin, A. Wong, Covid-net: A tailored deep convolutional neural network design for detection of covid-19 cases from chest x-ray images, Sci. Rep., 10 (2020), 1-12. |
| [15] |
Y. Li, L. Xia, Coronavirus disease 2019 (COVID-19): role of chest CT in diagnosis and management, Am. J. Roentgenol., 214 (2020), 1-7. doi: 10.2214/AJR.19.22415
|
| [16] | K. Doi, M. L. Giger, R. M. Nishikawa, K. R. Hoffmann, H. MacMahon, R. A. Schmidt, et al., Digital radiography: A useful clinical tool for computer-aided diagnosis by quantitative analysis of radiographic images, Acta Radiol., 34 (1993), 426-439. |
| [17] | K. Li, J. Wu, F. Wu, D. Guo, L. Chen, Z. Fang, et al., The clinical and chest CT features associated with severe and critical COVID-19 pneumonia, Invest. Radiol., 55 (2020), 327-331. |
| [18] |
C. Bao, X. Liu, Z. B. Han, Y. Li, J. Liu, Coronavirus disease 2019 (COVID-19) CT findings: A systematic review and meta-analysis, J. Am. Coll. Radiol., 17 (2020), 701-709. doi: 10.1016/j.jacr.2020.03.006
|
| [19] | J. C. Cooke, D. C. Currie, A. D. Morgan, I. H. Kerr, D. Delany, B. Strickland, et al., Role of computed tomography in diagnosis of bronchiectasis, Thorax, 42 (1987), 272-277. |
| [20] | J. J. Meerburg, G. D. M. Veerman, S. Aliberti, H. Tiddens, Diagnosis and quantification of bronchiectasis using computed tomography or magnetic resonance imaging: A systematic review, Respir. Med., 170 (2020), 1-8. |
| [21] |
O. M. Mets, P. Jong, B. V. Ginneken, H. A. Gietema, J. Lammers, Quantitative computed tomography in COPD: possibilities and limitations, Lung, 190 (2012), 133-145. doi: 10.1007/s00408-011-9353-9
|
| [22] | N. L. Ford, I. Lee, A. Tam, D. D. Sin, Micro-computed tomography imaging of a rodent model of chronic obstructive pulmonary disease (copd), in Medical Imaging 2020: Biomedical Applications in Molecular, Structural, and Functional Imaging. International Society for Optics and Photonics, 11317 (2020). |
| [23] |
H. Ohkubo, H. Nakagawa, A. Niimi, Computer-based quantitative computed tomography image analysis in idiopathic pulmonary fibrosis: A mini review, Respir. Invest., 56 (2018), 5-13. doi: 10.1016/j.resinv.2017.10.003
|
| [24] | J. Zhifeng, A. Feng, T. Li, Consistency analysis of COVID-19 nucleic acid tests and the changes of lung CT, J. Clin. Virol., 127(2020), 1-3. |
| [25] | Z. Yongchen, H. Shen, X. Wang, X. Shi, Y. Li, J. Yan, et al., Different longitudinal patterns of nucleic acid and serology testing results based on disease severity of COVID-19 patients, Emerging Microbes Infect., 9 (2020), 1-14. |
| [26] | J. Wu, J. Liu, S. Li, Z. Peng, J. Luo, Detection and analysis of nucleic acid in various biological samples of COVID-19 patients, Travel Med. Infect. Dis., 37 (2020), 1-2. |
| [27] | A. M. Kunig, V. Balasubramaniam, N. E. Markham, D. Morgan, G. Montgomery, T. R. Grover, et al., Recombinant human VEGF treatment enhances alveolarization after hyperoxic lung injury in neonatal rats, Am. J. Physiol.-Lung Cell. Mol. Physiol., 289 (2005), 529-535. |
| [28] | R. He, L. Han, P. Liu, H. Hu, J. Yang, H. Cai, et al., Lung function decline after 24 weeks of moxa smoke exposure in rats, Evidence-Based Complementary Altern. Med., 2019 (2019), 1-7. |
| [29] |
M. Mao, J. Li, A. Bi, H. Jia, S. Xia, Thymoquinone ameliorates the PM2.5-induced lung injury in rats, Exp. Lung Res., 46 (2020), 297-307. doi: 10.1080/01902148.2020.1801895
|
| [30] |
U. Frey, J. Stocks, A. Coates, P. Sly, J. Bates, Specifications for equipment used for infant pulmonary function testing, Eur. Respir. J., 16 (2000), 1016-1022. doi: 10.1183/09031936.00.16510160
|
| [31] |
A. Virani, S. Baltaji, M. Young, T. Dumont, T. Cheema, Chronic obstructive pulmonary disease: diagnosis and gold classification, Crit. Care Nurs. Q., 44 (2021), 9-18. doi: 10.1097/CNQ.0000000000000335
|
| [32] |
A. K. Boutou, Z. Zoumot, A. Nair, C. Davey, D. M. Hansell, The impact of homogeneous versus heterogeneous emphysema on dynamic hyperinflation in patients with severe COPD assessed for lung volume reduction, COPD: J. Chronic Obstruct. Pulm. Dis., 12 (2015), 598-605. doi: 10.3109/15412555.2015.1020149
|
| [33] |
Y. Li, Y. L. Dai, N. Yu, Y. M. Guo, Sex-related differences in bronchial parameters and pulmonary function test results in patients with chronic obstructive pulmonary disease based on three-dimensional quantitative computed tomography, J. Int. Med. Res., 46 (2018), 135-142. doi: 10.1177/0300060517721309
|
| [34] |
N. Das, M. Topalovic, W. Janssens, Artificial intelligence in diagnosis of obstructive lung disease: current status and future potential, Current Opin. Pulm. Med., 24 (2018), 117-123. doi: 10.1097/MCP.0000000000000459
|
| [35] | H. Liang, B. Y. Tsui, H. Ni, C. C. Valentim, S. L.Baxter, G. Liu, et al., Evaluation and accurate diagnoses of pediatric diseases using artificial intelligence, Nat. Med., 25 (2019), 433-438. |
| [36] | L. Li, L. Qin, Z. Xu, Y. Yin, X. Wang, B. Kong, et al., Artificial intelligence distinguishes COVID-19 from community acquired pneumonia on chest CT, Radiology, 296 (2020), 65-72. |
| [37] | D. J. Maselli, H. Keyt, M. I. Restrepo, Inhaled antibiotic therapy in chronic respiratory diseases, Int. J. Mol. Sci., 18 (2017), 1-23. |
| [38] | A. Guillon, T. Sécher, L. A. Dailey, L. Vecellio, M. De Monte, N. Heuzé-Vourc'h, Insights on animal models to investigate inhalation therapy: relevance for biotherapeutics, Int. J. Pharmaceutics, 536 (2018), 116-126. |
| [39] |
J. E. Phillips, Inhaled phosphodiesterase 4 (PDE4) inhibitors for inflammatory respiratory diseases, Front. Pharmacol., 11 (2020), 1-7. doi: 10.3389/fphar.2020.00001
|
| [40] | N. M. Cheng, C. T. Yu, K. C. Ho, Y. C. Wu, Y. C. Liu, C. W. Wang, et al., Respiration-averaged CT for attenuation correction in non-small-cell lung cancer, Eur. J. Nucl. Med. Mol. Imaging, 36 (2009), 607-615. |
| [41] | H. Y. Santema, J. Stolk, M. Los, B. C. Stoel, R. Tsonaka, I. T. Merth, Prediction of lung function and lung density of young adults who had bronchopulmonary dysplasia, ERJ Open Res., 6 (2020), 1-9. |
| [42] |
D. M. Vasilescu, A. B. Phillion, D. Kinose, S. E. Verleden, J. C. Hogg, Comprehensive Stereological assessment of the human lung using multi-resolution computed tomography, J. Appl. Physiol., 128 (2020), 1604-1616. doi: 10.1152/japplphysiol.00803.2019
|
| [43] | J. Hofmanninger, F. Prayer, J. Pan, S. Rohrich, H. Prosch, G. Langs, Automatic lung segmentation in routine imaging is a data diversity problem, not a methodology problem, Eur. Radiol. Exp., 4 (2020), 1-13. |
| [44] |
Q. Li, L. Chen, X. Li, X. Lv, S. Xia, Y. Kang, PRF-RW: a progressive random forest-based random walk approach for interactive semi-automated pulmonary lobes segmentation, Int. J. Mach. Learn. Cybern., 11 (2020), 2221-2235. doi: 10.1007/s13042-020-01111-9
|
| [45] | Q. Li; L. Chen, X. Li, S. Xia, Y. Kang, An improved random forests approach for interactive lobar segmentation on emphysema detection, Granular Comput., 5 (2019), 503-512. |
| [46] |
F. Gibou, D. Levy, C Cárdenas, P. Liu, A. Boyer, Partial differential equations-based segmentation for radiotherapy treatment planning, Math. Biosci. Eng., 2 (2005), 209-226. doi: 10.3934/mbe.2005.2.209
|
| [47] | Y. Yang, Y. Guo, J. Guo, Y. Gao, Y. Kang, A method of abstracting single pulmonary lobe from computed tomography pulmonary images for locating COPD, in Proceedings of the Fourth International Conference on Biological Information and Biomedical Engineering (2020), 1-6. |


Figures(9)

Yingjian Yang, Qiang Li, Yingwei Guo, Yang Liu, Xian Li, Jiaqi Guo, Wei Li, Lei Cheng, Huai Chen, Yan Kang. Lung parenchyma parameters measure of rats from pulmonary window computed tomography images based on ResU-Net model for medical respiratory researches[J]. Mathematical Biosciences and Engineering, 2021, 18(4): 4193-4211. doi: 10.3934/mbe.2021210


 DownLoad: