Prostate cancer (PCa) is the most frequent cancer found in males worldwide, and its mortality rate is increasing every year. To discover key molecular changes in PCa development and metastasis, we analyzed microarray data of localized PCa, metastatic PCa and normal prostate tissue samples from clinical specimens.
Gene expression profiling datasets of PCa were analyzed online. The DAVID was used to perform GO functional and KEGG pathway enrichment analyses. CytoHubba in Cytoscape software was applied to identify hub genes. Survival data were downloaded from GEPIA. Gene expression data were obtained from ONCOMINE and UALCAN.
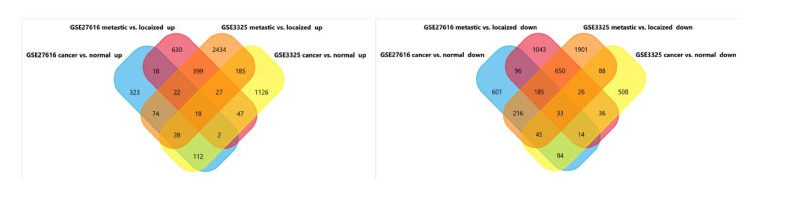
We obtained 4 sets of differentially expressed genes (DEGs), DEGs 1: a comparison of the gene expression between 4 normal prostate and 5 localized PCa samples in GSE27616; DEGs 2: a comparison of the gene expression between 6 normal prostate and 7 localized PCa samples in GSE3325; DEGs 3: a comparison of the gene expression between 5 localized PCa and 4 metastatic PCa samples in GSE27616; DEGs 4: a comparison of the gene expression between 7 localized PCa and 6 metastatic PCa samples in GSE3325. A comparison of these 4 sets of genes revealed 51 overlapped genes. GO function analysis revealed enrichment of the 51 DEGs in functions related to the proteinaceous extracellular matrix and centrosome, protein homodimerization activity and chromatin binding were the main functions of these genes, which participated in regulating cell division, mitotic nuclear division, proteinaceous extracellular matrix, cell adhesion and apoptotic process. KEGG pathway analysis indicated that these identified DEGs were mainly enriched in progesterone-mediated oocyte maturation, oocyte meiosis and cell cycle. We defined the 16 genes with the highest degree of connectivity as the hub genes in the 51 overlapped DEGs. Cox regression revealed TOP2A, CCNB2, BUB1, CDK1 and EZH2 were related to Disease-free survival (DFS). The expression levels of the 5 genes were 2.232-, 1.786-, 2.303-, 1.699-, and 1.986-fold higher in PCa than the levels in normal tissues, respectively (P < 0.05). We obtained 20 hub genes from DEGs by the comparison of normal prostate tissue vs. localized cancer tissue. Among them, KIF20A, CDKN3, PBK and CDCA2, were expressed higher in PCa than in normal tissues, and were associated with the DFS of PCa patients. Meanwhile, we obtained 20 hub genes from DEGs by the comparison of localized cancer tissue vs. metastatic cancer tissue. Cox regression revealed PLK1, CCNA2 and CDC20, were associated with both the DFS and overall survival of PCa patients.
The results suggested that the functions of KIF20A, CDKN3, PBK and CDCA2 may contribute to PCa development and the functions of PLK1, CCNA2 and CDC20 may contribute to PCa metastasis. Meanwhile, the functions of TOP2A, CCNB2, BUB1, CDK1 and EZH2 may contribute to both PCa development and metastasis.
Citation: Peng Gu, Dongrong Yang, Jin Zhu, Minhao Zhang, Xiaoliang He. Bioinformatics analysis identified hub genes in prostate cancer tumorigenesis and metastasis[J]. Mathematical Biosciences and Engineering, 2021, 18(4): 3180-3196. doi: 10.3934/mbe.2021158
Prostate cancer (PCa) is the most frequent cancer found in males worldwide, and its mortality rate is increasing every year. To discover key molecular changes in PCa development and metastasis, we analyzed microarray data of localized PCa, metastatic PCa and normal prostate tissue samples from clinical specimens.
Gene expression profiling datasets of PCa were analyzed online. The DAVID was used to perform GO functional and KEGG pathway enrichment analyses. CytoHubba in Cytoscape software was applied to identify hub genes. Survival data were downloaded from GEPIA. Gene expression data were obtained from ONCOMINE and UALCAN.
We obtained 4 sets of differentially expressed genes (DEGs), DEGs 1: a comparison of the gene expression between 4 normal prostate and 5 localized PCa samples in GSE27616; DEGs 2: a comparison of the gene expression between 6 normal prostate and 7 localized PCa samples in GSE3325; DEGs 3: a comparison of the gene expression between 5 localized PCa and 4 metastatic PCa samples in GSE27616; DEGs 4: a comparison of the gene expression between 7 localized PCa and 6 metastatic PCa samples in GSE3325. A comparison of these 4 sets of genes revealed 51 overlapped genes. GO function analysis revealed enrichment of the 51 DEGs in functions related to the proteinaceous extracellular matrix and centrosome, protein homodimerization activity and chromatin binding were the main functions of these genes, which participated in regulating cell division, mitotic nuclear division, proteinaceous extracellular matrix, cell adhesion and apoptotic process. KEGG pathway analysis indicated that these identified DEGs were mainly enriched in progesterone-mediated oocyte maturation, oocyte meiosis and cell cycle. We defined the 16 genes with the highest degree of connectivity as the hub genes in the 51 overlapped DEGs. Cox regression revealed TOP2A, CCNB2, BUB1, CDK1 and EZH2 were related to Disease-free survival (DFS). The expression levels of the 5 genes were 2.232-, 1.786-, 2.303-, 1.699-, and 1.986-fold higher in PCa than the levels in normal tissues, respectively (P < 0.05). We obtained 20 hub genes from DEGs by the comparison of normal prostate tissue vs. localized cancer tissue. Among them, KIF20A, CDKN3, PBK and CDCA2, were expressed higher in PCa than in normal tissues, and were associated with the DFS of PCa patients. Meanwhile, we obtained 20 hub genes from DEGs by the comparison of localized cancer tissue vs. metastatic cancer tissue. Cox regression revealed PLK1, CCNA2 and CDC20, were associated with both the DFS and overall survival of PCa patients.
The results suggested that the functions of KIF20A, CDKN3, PBK and CDCA2 may contribute to PCa development and the functions of PLK1, CCNA2 and CDC20 may contribute to PCa metastasis. Meanwhile, the functions of TOP2A, CCNB2, BUB1, CDK1 and EZH2 may contribute to both PCa development and metastasis.

| [1] |
R. L. Siegel, K. D. Miller, H. E. Fuchs, A. Jemal, Cancer Statistics, 2021, CA. Cancer J. Clin., 71 (2021), 7-33. doi: 10.3322/caac.21654

|
| [2] |
J. A. Hempelmann, C. M. Lockwood, E. Q. Konnick, M. T. Schweizer, E. S. Antonarakis, T. L. Lotan, et al., Microsatellite instability in prostate cancer by PCR or next-generation sequencing, J. Immunother. Cancer, 6 (2018), 29. doi: 10.1186/s40425-018-0341-y
|
| [3] |
L. Foj, X. Filella, Identification of Potential miRNAs Biomarkers for High-Grade Prostate Cancer by Integrated Bioinformatics Analysis, Pathol. Oncol. Res., 25 (2019), 1445-1456. doi: 10.1007/s12253-018-0508-3
|
| [4] | Z. Zhang, C. Chai, T. Shen, X. Li, J. Ji, C. Li, et al., Aberrant KIF20A expression is associated with adverse clinical outcome and promotes tumor progression in Prostate Cancer, Dis. Markers, (2019), 4782730. |
| [5] |
C. Yu, H. Cao, X. He, P. Sun, Y. Feng, L. Chen, et al., Cyclin-dependent kinase inhibitor 3 (CDKN3) plays a critical role in prostate cancer via regulating cell cycle and DNA replication signaling, Biomed. Pharmacother., 96 (2017), 1109-1118. doi: 10.1016/j.biopha.2017.11.112
|
| [6] |
J. D. Brown-Clay, D. N. Shenoy, O. Timofeeva, B. V. Kallakury, A. K. Nandi, P. P. Banerjee, PBK/TOPK enhances aggressive phenotype in prostate cancer via beta-catenin-TCF/LEF-mediated matrix metalloproteinases production and invasion, Oncotarget, 6 (2015), 15594-15609. doi: 10.18632/oncotarget.3709
|
| [7] |
Y. Zhang, Y. Cheng, Z. Zhang, Z. Bai, H. Jin, X. Guo, et al., CDCA2 inhibits apoptosis and promotes cell proliferation in Prostate Cancer and is directly regulated by HIF-1alpha pathway, Front. Oncol., 10 (2020), 725. doi: 10.3389/fonc.2020.00725
|
| [8] |
L. Gheghiani, S. Shang, Z. Fu, Targeting the PLK1-FOXO1 pathway as a novel therapeutic approach for treating advanced prostate cancer, Sci. Rep., 10 (2020), 12327. doi: 10.1038/s41598-020-69338-8
|
| [9] | S. B. Shin, S. U. Woo, H. Yim, Cotargeting Plk1 and androgen receptor enhances the therapeutic sensitivity of paclitaxel-resistant prostate cancer, Ther. Adv. Med. Oncol., 11 (2019), 1758835919846375. |
| [10] |
R. Yang, Y. Du, L. Wang, Z. Chen, X. Liu, Weighted gene co-expression network analysis identifies CCNA2 as a treatment target of prostate cancer through inhibiting cell cycle, J. Cancer, 11 (2020), 1203-1211. doi: 10.7150/jca.38173
|
| [11] |
Y. Mao, K. Li, L. Lu, J. Si-Tu, M. Lu, X. Gao, Overexpression of Cdc20 in clinically localized prostate cancer: Relation to high Gleason score and biochemical recurrence after laparoscopic radical prostatectomy, Cancer Biomark., 16 (2016), 351-358. doi: 10.3233/CBM-160573
|
| [12] |
K. Li, Y. Mao, L. Lu, C. Hu, D. Wang, J. Si-Tu, et al., Silencing of CDC20 suppresses metastatic castration-resistant prostate cancer growth and enhances chemosensitivity to docetaxel, Int. J. Oncol., 49 (2016), 1679-1685. doi: 10.3892/ijo.2016.3671
|
| [13] |
D. P. Labbe, C. J. Sweeney, M. Brown, P. Galbo, S. Rosario, K. M. Wadosky, et al., TOP2A and EZH2 provide early detection of an aggressive Prostate Cancer subgroup, Clin. Cancer Res., 23 (2017), 7072-7083. doi: 10.1158/1078-0432.CCR-17-0413
|
| [14] |
L. Jin, Y. Zhou, G. Chen, G. Dai, K. Fu, D. Yang, et al., EZH2-TROAP pathway promotes Prostate Cancer progression via TWIST signals, Front. Oncol., 10 (2021), 592239. doi: 10.3389/fonc.2020.592239
|
| [15] | M. L. Mo, Z. Chen, J. Li, H. L. Li, Q. Sheng, H. Y. Ma, et al., Use of serum circulating CCNB2 in cancer surveillance, Int. J. Biol. Markers, 25 (2010), 30B1A552-6F86-4064-888D-90FEC7A5BB29. |
| [16] | F. Cai, J. Li, J. Zhang, S. Huang, Knockdown of Circ_CCNB2 sensitizes Prostate Cancer to radiation through repressing autophagy by the miR-30b-5p/KIF18A axis, Cancer Biother. Radiopharm., (2020), Online ahead of print. |
| [17] | L. J. Zhu, Y. Pan, X. Y. Chen, P. F. Hou, BUB1 promotes proliferation of liver cancer cells by activating SMAD2 phosphorylation, Oncol. Lett., 19 (2020), 3506-3512. |
| [18] | X. Fu, G. Chen, Z. D. Cai, C. Wang, Z. Z. Liu, Z. Y. Lin, et al., Overexpression of BUB1B contributes to progression of prostate cancer and predicts poor outcome in patients with prostate cancer, Onco. Targets Ther., 9 (2016), 2211-2220. |
| [19] |
S. Chen, Y. Xu, X. Yuan, G. J. Bubley, S. P. Balk, Androgen receptor phosphorylation and stabilization in prostate cancer by cyclin-dependent kinase 1, Proc. Natl. Acad. Sci. U.S.A., 103 (2006), 15969-15974. doi: 10.1073/pnas.0604193103
|
| [20] |
J. M. Willder, S. J. Heng, P. McCall, C. E. Adams, C. Tannahill, G. Fyffe, et al., Androgen receptor phosphorylation at serine 515 by Cdk1 predicts biochemical relapse in prostate cancer patients, Br. J. Cancer, 108 (2013), 139-148. doi: 10.1038/bjc.2012.480
|
| [21] |
J. Zhang, W. Zhu, Q. Wang, J. Gu, L. F. Huang, X. Sun, Differential regulatory network-based quantification and prioritization of key genes underlying cancer drug resistance based on time-course RNA-seq data, PLoS. Comput. Biol., 15 (2019), e1007435. doi: 10.1371/journal.pcbi.1007435
|
| [22] |
J. Zhang, M. Guan, Q. Wang, J. Zhang, T. Zhou, X. Sun, Single-cell transcriptome-based multilayer network biomarker for predicting prognosis and therapeutic response of gliomas, Brief. Bioinform., 21 (2020), 1080-1097. doi: 10.1093/bib/bbz040
|


Figures(5) / Tables(4)

Peng Gu, Dongrong Yang, Jin Zhu, Minhao Zhang, Xiaoliang He. Bioinformatics analysis identified hub genes in prostate cancer tumorigenesis and metastasis[J]. Mathematical Biosciences and Engineering, 2021, 18(4): 3180-3196. doi: 10.3934/mbe.2021158


 DownLoad: