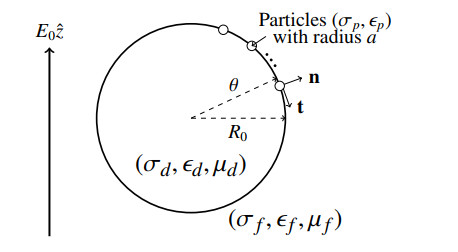
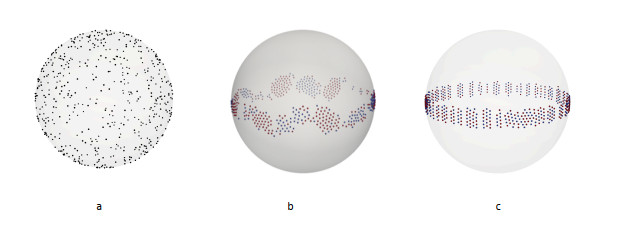
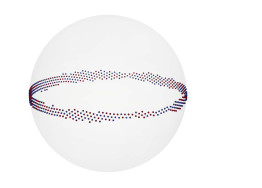
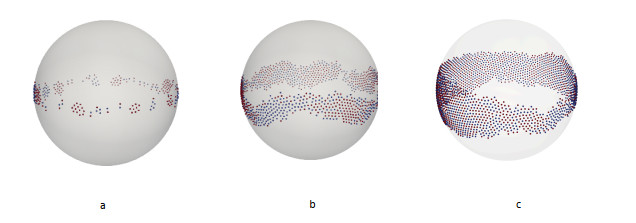
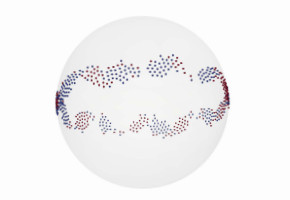
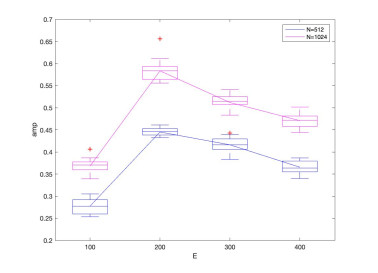
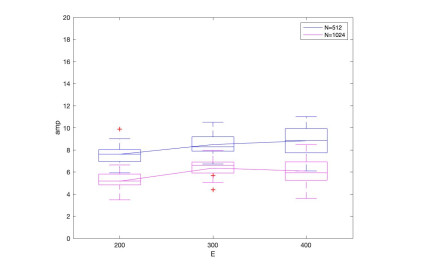
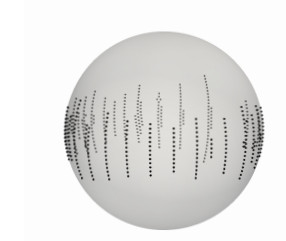
A mathematical model to simulate the dynamics of colloidal particles on a drop interface in an applied electric field is presented. The model accounts for the electric field driven flow within the drop and suspending fluid, particle-particle electrostatic interaction, and the particle motion and rotation due to the induced flow and the applied electric field. The model predicts the formation of chains in the case of conducting particles or an undulating band around the equator in the case of dielectric particles. The model results are in agreement with recent experimental work. A study is presented on the impact of particle concentration and electric field strength on the collective motions of the particles. In the case of non-conducting particles, we find that in the presence of Quincke rotation, the amplitude of the undulations of the observed equatorial particle belt increases with particle concentration but decreases with electric field strength. We also show that the wavelength of the undulations appears independent of the applied field strength.
Citation: Yi Hu, Petia M. Vlahovska, Michael J. Miksis. Electrohydrodynamic assembly of colloidal particles on a drop interface[J]. Mathematical Biosciences and Engineering, 2021, 18(3): 2357-2371. doi: 10.3934/mbe.2021119
A mathematical model to simulate the dynamics of colloidal particles on a drop interface in an applied electric field is presented. The model accounts for the electric field driven flow within the drop and suspending fluid, particle-particle electrostatic interaction, and the particle motion and rotation due to the induced flow and the applied electric field. The model predicts the formation of chains in the case of conducting particles or an undulating band around the equator in the case of dielectric particles. The model results are in agreement with recent experimental work. A study is presented on the impact of particle concentration and electric field strength on the collective motions of the particles. In the case of non-conducting particles, we find that in the presence of Quincke rotation, the amplitude of the undulations of the observed equatorial particle belt increases with particle concentration but decreases with electric field strength. We also show that the wavelength of the undulations appears independent of the applied field strength.

| [1] | W. Ramsden, Separation of solids in the surface-layers of solutions and suspensions (observations of surface-membranes, bubbles, emulsions, and mechanical coagulation) - preliminary account, Proc. R. Soc. London, 72 (1903), 156-164. |
| [2] | S. U. Pickering, Emulsions, J. Chem. Soc. Trans., 19 (1907), 2001-2021. |
| [3] |
J. Wu, G. H. Ma, Recent studies of Pickering emulsions: particles make the difference, Small, 12 (2016), 4633-4648. doi: 10.1002/smll.201600877

|
| [4] |
A. D. Dinsmore, M. F. Hsu, M. G. Nikolaides, M. Marquez, A. R. Bausch, D. A. Weitz, Colloidosomes: selectively permeable capsules composed of colloidal particles, Science, 298 (2002), 1006-1009. doi: 10.1126/science.1074868
|
| [5] |
Q. Sun, J-F. Chen, A. F. Routh, Coated colloidosomes as novel drug delivery carriers, Expert Opin. Drug Deliv., 16 (2019), 903-906. doi: 10.1080/17425247.2019.1652594
|
| [6] |
P. B. Binks, Particles as surfactants - similarities and differences, Curr. Opin. Colloid Interface Sci., 7 (2002), 21-41. doi: 10.1016/S1359-0294(02)00008-0
|
| [7] | P. Aussillous, D. Quere, Liquid Marbles, Nature, 411 (2001), 924-927. |
| [8] | R. Aveyard, B. P. Binks, J. H. Clint, Emulsions stabilized solely by colloidal particles, Adv. Colloid Interface Sci., 100 (2003), 503-546. |
| [9] |
E. Dickinson, Food emulsions and foams: Stabilization by particles, Curr. Opin. Colloid Interface Sci., 15 (2010), 40-49. doi: 10.1016/j.cocis.2009.11.001
|
| [10] |
Z. Rozynek, A. Jozefczak, Patchy colloidosomes — an emerging class of structure, Eur. Phys. J. Spec. Top., 225 (2016), 741-756. doi: 10.1140/epjst/e2015-50267-7
|
| [11] | P. Dommersnes, Z. Rozynek, A. Mikkelsen, R. Castberg, K. Kjerstad, K. Hersvik, et al., Active structuring of colloidal armor on liquid drops. Nat. Commun., 4 (2013), 2066. |
| [12] |
M. Ouriemi, P. M. Vlahovska, Electrohydrodynamics of particle-covered drops, J. Fluid Mech., 751 (2014), 106-120. doi: 10.1017/jfm.2014.289
|
| [13] |
Z. Rozynek, A. Mikkelsen, P. Dommersnes, J-O. Fossum, Electroformation of Janus and patchy capsules, Nature Commun., 5 (2014), 3945. doi: 10.1038/ncomms4945
|
| [14] |
Z. Rozynek, K. Khobaib, A. Mikkelsen, Opening and closing of particle shells on droplets via electric fields and its applications, ACS Appl. Mater. Interfaces, 11 (2019), 22840-22850. doi: 10.1021/acsami.9b05194
|
| [15] |
M. Oettel, S. Dietrich, Colloidal Interactions at Fluid Interfaces, Langmuir, 24 (2008), 1425-1441. doi: 10.1021/la702794d
|
| [16] |
P. A. Kralchevsky, N. D. Denkov, Capillary forces and structuring in layers of colloid particles, Curr. Opin. Colloid Interface Sci., 6 (2001), 383-401. doi: 10.1016/S1359-0294(01)00105-4
|
| [17] |
P. A. Kralchevsky, K. Nagayama, Lateral capillary forces between partially immersed bodies, Stud. Interface Sci., 10 (2001), 287-350. doi: 10.1016/S1383-7303(01)80048-X
|
| [18] |
L. Botto, E. P. Lewandowski, M. Cavallaro Jr., K. J. Stebe, Capillary interactions between anisotropic particles, Soft Matter, 8 (2012), 9957-9971. doi: 10.1039/c2sm25929j
|
| [19] |
V. R. Dugyala, S. V. Daware, M. G. Basavaraj, Shape anisotropic colloids: synthesis, packing behavior, evaporation driven assembly, and their application in emulsion stabilization, Soft Matter, 9 (2013), 6711-6725. doi: 10.1039/c3sm50404b
|
| [20] |
M. Cavallaro Jr., L. Botto, E. P. Lewandowski, M. Wang, K. J. Stebe, Curvature-driven capillary migration and assembly of rod-like particles, PNAS, 108 (2011), 20923-20928. doi: 10.1073/pnas.1116344108
|
| [21] |
M. P. Boneva, K. D. Danov, N. C. Christov, P. A. Kralchevsky, Attraction between particles at a liquid interface due to the interplay of gravity- and electric-field-induced interfacial deformations, Langmuir, 25 (2009), 9129-9139. doi: 10.1021/la9006873
|
| [22] |
K. D. Danov, P. A. Kralchevsky, Forces acting on dielectric colloidal spheres at a water/nonpolar fluid interface in an external electric field. 1. uncharged particles, J. Colloid Interface Sci., 405 (2013), 278-290. doi: 10.1016/j.jcis.2013.05.020
|
| [23] |
K. D. Danov, P. A. Kralchevsky, Forces acting on dielectric colloidal spheres at a water/nonpolar fluid interface in an external electric field. 2. charged particles, J. Colloid Interface Sci., 405 (2013), 269-277. doi: 10.1016/j.jcis.2013.05.015
|
| [24] |
Y. Hu, P. M. Vlahovska, M. J. Miksis, Dielectric spherical particle on an interface in an applied electric field, SIAM J. Appl. Math., 79 (2019), 850-875. doi: 10.1137/18M1195668
|
| [25] |
Y. Hu, P. M. Vlahovska, M. J. Miksis, Colloidal particle electrorotation in a nonuniform electric field, Phys. Rev. E, 97 (2018), 013111. doi: 10.1103/PhysRevE.97.013111
|
| [26] |
K. D. Danov, R. Dimova, B. Pouligny, Viscous drag of a solid sphere straddling a spherical or flat surface, Phys. Fluids, 12 (2000), 2711-2722. doi: 10.1063/1.1289692
|
| [27] |
A. Dani, G. Keiser, M. Yeganeh, C. Maldarelli, Hydrodynamics of particles at an oil-water interface, Langmuir, 31 (2015), 13290-13302. doi: 10.1021/acs.langmuir.5b02146
|
| [28] |
A. Dörr, S. Hardt, Driven particles at fluid interfaces acting as capillary dipoles, J. Fluid Mech., 770 (2015), 5-26. doi: 10.1017/jfm.2015.129
|
| [29] |
A. Doerr, S. Hardt, H. Masoud, H. A. Stone, Drag and diffusion coefficients of a spherical particle attached to a fluid-fluid interface, J. Fluid Mech., 790 (2016), 607-618. doi: 10.1017/jfm.2016.41
|
| [30] |
J.-C. Loudet, M. Qiu, J. Hemauer, J. J. Feng, Drag force on a particle straddling a fluid interface: Influence of interfacial deformations, Eur. Phys. J. E, 43 (2020), 13. doi: 10.1140/epje/i2020-11936-1
|
| [31] |
C. Pozrikidis, Particle motion near and inside an interfac, J. Fluid Mech., 575 (2007), 333-357. doi: 10.1017/S0022112006004046
|
| [32] |
P. Singh, D. D. Joseph, Fluid dynamics of floating particles, J. Fluid Mech., 530 (2005), 31-80. doi: 10.1017/S0022112005003575
|
| [33] |
F. Jansen, J. Harting, From bijels to Pickering emulsions: A lattice Boltzmann study, Phys. Rev. E, 83 (2011), 046707. doi: 10.1103/PhysRevE.83.046707
|
| [34] |
S. Cappelli, Q. Xie, J. Harting, A. M. de Jong, M. W. J. Prins, Dynamic wetting: status and prospective of single particle based experiments and simulations, N. Biotechnol., 32 (2015), 420-432. doi: 10.1016/j.nbt.2015.02.010
|
| [35] | G. I. Taylor, Studies in electrohydrodynamics. I. Circulation produced in a drop by an electric field, Proc. Royal Soc. A, 291 (1966), 159-166. |
| [36] |
S. Nudurupati, M. Janjua, P. Singh, N. Aubry, Electrohydrodynamic removal of particles from drop surfaces, Phys. Rev. E, 80 (2009), 010402R. doi: 10.1103/PhysRevE.80.010402
|
| [37] |
E. Amah, K. Shah, I. Fischer, P. Singh, Electrohydrodynamic manipulation of particles adsorbed on the surface of a drop, Soft Matter, 12 (2016), 1663-1673. doi: 10.1039/C5SM02195B
|
| [38] | G. Quincke, Ueber Rotation em im constanten electrischen Felde, Ann. Phys. Chem., 59 (1896), 417-486. |
| [39] | T. B. Jones, Quincke rotation of spheres, IEEE Trans. Industry Appl., 20 (1984), 845-849. |
| [40] |
D. Das, D. Saintillan, Electrohydrodynamic interaction of spherical particles under Quincke rotation, Phys. Rev. E, 87 (2013), 043014. doi: 10.1103/PhysRevE.87.043014
|
| [41] |
M. Ouriemi, P. M. Vlahovska, Electrohydrodynamic Deformation and Rotation of a Particle-Coated Drop, Langmuir, 31 (2015), 6298-6305. doi: 10.1021/acs.langmuir.5b00774
|
Figures(8)

Yi Hu, Petia M. Vlahovska, Michael J. Miksis. Electrohydrodynamic assembly of colloidal particles on a drop interface[J]. Mathematical Biosciences and Engineering, 2021, 18(3): 2357-2371. doi: 10.3934/mbe.2021119


 DownLoad: